
Volume analysis is a type of technical analysis that focuses on the interaction between the price of a financial asset and the volumes of executed trades. Volume analysis is an effective approach for predicting price movements. It is based on studying the forces of demand and supply, the drivers (causes) of quotes’ increases and decreases.
Read more:
How Volume Analysis Works
Trading volume is the amount of financial assets bought or sold during a specific period.
Trading volume is recorded by the exchange.
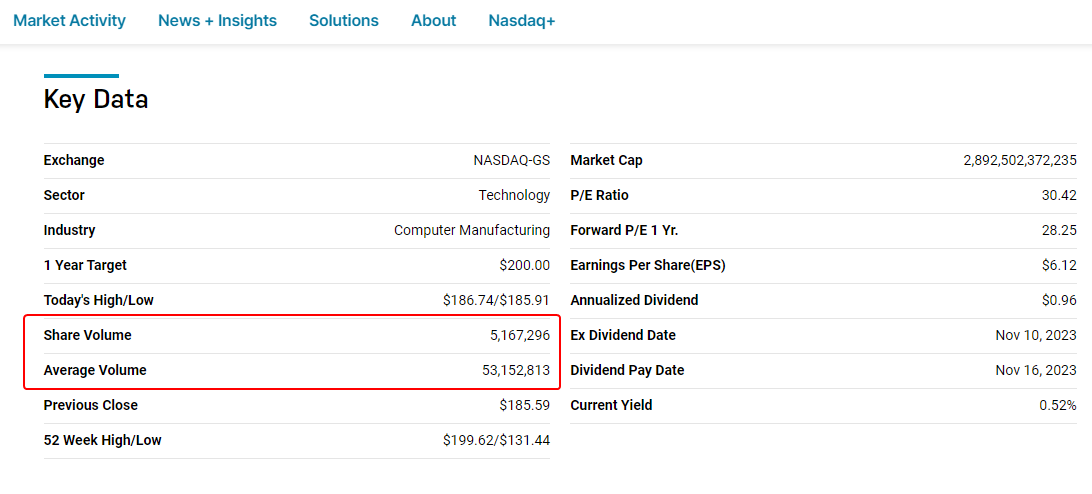
Example. On the Nasdaq exchange website, alongside other information, trading volume data for AAPL shares is published.
Volume analysis on the stock exchange is a method that enables traders and investors to assess market participants’ activity and identify potential trends. Volume analysis is based on the law of supply and demand — the price of an asset rises when demand exceeds supply and falls when supply exceeds demand.
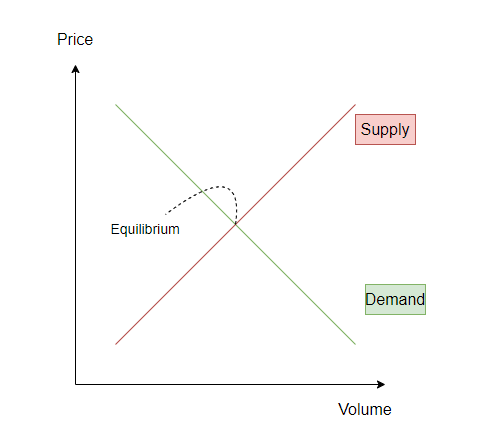
Looking at the graphical interpretation of the law of supply and demand, the axes represent:
- P, Price – the price of the exchange asset;
- Q, Quantity or Volume – the volume of bought/sold assets.
Volume analysis helps evaluate which force dominates in the market — buyers or sellers. Or they are in temporary equilibrium.
When the balance of supply and demand is disrupted, the price changes. By skillfully analyzing volumes, a trader can timely receive signals about these changes.
Useful tip: We recommend reading a series of articles on VSA and cluster analysis because Volume Spread Analysis is based on the logic of the law of supply and demand. The first article in the series: Bag Holding and End of Rising Market Patterns.
Pros and Cons of the Methodology
Pros of volume analysis in trading
- Volume analysis is based on the fundamental law of the market —the law of supply and demand. It serves as a reliable assistant to traders and investors in making informed decisions. Volume analysis helps reduce risks and identify more precise entry points.
- Volume analysis can be used to confirm or refute other technical indicators. It provides the most comprehensive understanding of the market, enabling more informed decision-making.
- Mastering volume analysis gives you a crucial advantage over other traders who either do not use this method or use it ineffectively.
Cons of volume analysis in trading
- Volume analysis is not a foolproof method for predicting price movements. The asset’s price can move in any direction, regardless of your assumptions, no matter how ‘correct’ they may seem.
- Volume analysis can be difficult to understand and implement. Traders and investors need to exert effort and spend a certain amount of time to gain enough proficiency to make trading decisions.
- Volume analysis can be used as a tool for manipulation by large players — false volumes can create a distorted perception of the market direction.
Overall, volume analysis is a powerful tool that helps many traders and investors improve their trading results. For more details on this topic, read an article on the pros and cons of volume analysis.
Types of Exchange Volumes
Analyzing volumes on the ATAS platform, you can work with various types of volumes:
- Volume. Standard volumes are expressed cumulatively in the quantity of the exchange asset.
- Ticks. Tick volumes.
- Trades. The number of trades in ‘pieces.’
- Ask. Ask trades. Market buys = Market Buy + Limit Sell.
- Bid. Bid trades. Market sells = Market Sell + Limit Buy.
- Delta. Delta: The difference between ask and bid trades.
Useful links: What is Bid, Ask, and Spread?
Volumes can also be categorized into:
- Vertical. They display information about volumes per unit of time (timeframe). This is the most common type of volume. Typically, vertical volumes are displayed below the chart as a histogram with vertical bars.
- Horizontal. They show information about volumes at a level over some time. This type is known as market profile. Data is displayed on the chart area as a histogram with horizontal bars.
- Combined. Footprint is a vivid example of this volume type. It combines the display of horizontal and vertical volumes ‘inside’ the candle.
We should also mention volumes in the Depth of Market (DOM or Level II). These are limit orders that have not found a counterparty yet. By default, these volumes are displayed on the right side of the price chart. Alternatively, specialized functionality, such as the Smart DOM module, can be used for their analysis.
Vertical Volumes
These are volumes that depict trading activity per timeframe unit.
Example. The chart of E-mini S&P-500 index futures and three indicators for analyzing volumes per timeframe unit, in this case, 30 minutes.
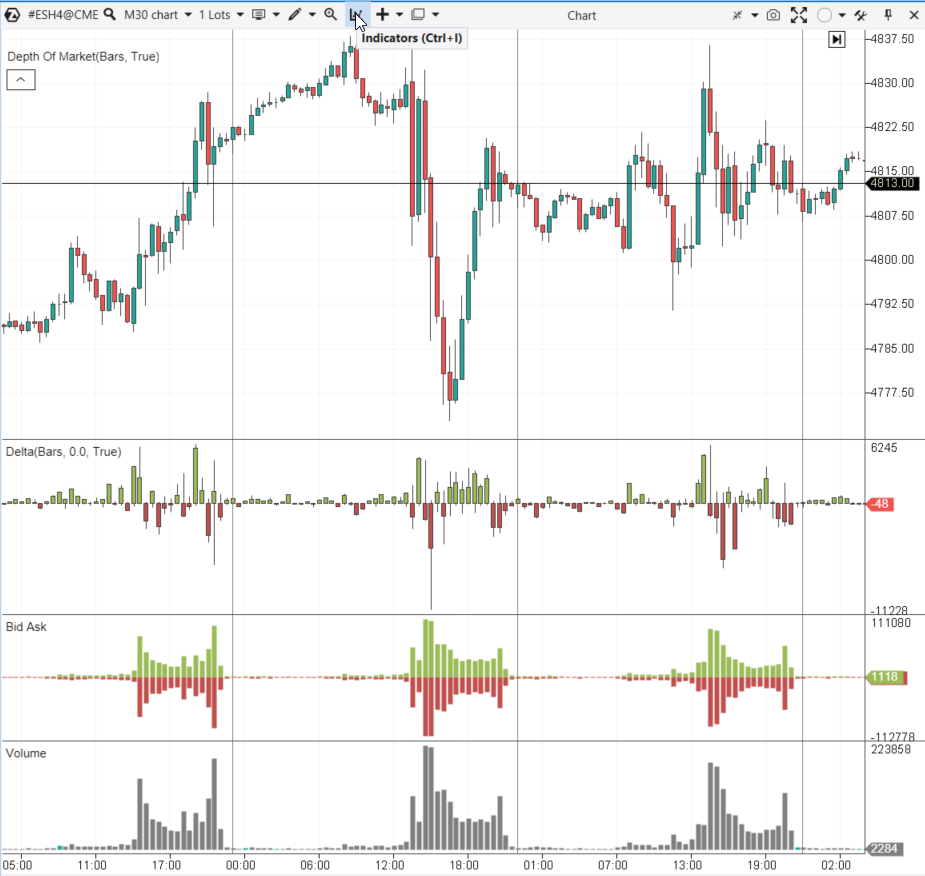
Below the price area, the following elements are included:
- Volume – the number of contracts bought/sold (traded) within 30 minutes.
- Bid Ask – this indicator shows how many trades were initiated by buyers (Asks trades have positive values, displayed in green) and how many were initiated by sellers (Bids trades have negative values, displayed in red).
- Delta – the difference between Bid and Ask trades, expressed in volumes.
Note. To add an indicator on the ATAS platform chart, press Ctrl+I or use the icon in the Chart module menu (shown in the screenshot).
How to Use Vertical Volumes in Trading?
It is generally considered that:
- if the price is rising and volumes are increasing, it is a sign of strong demand (bullish signal);
- if the price is rising but volumes are decreasing, it indicates exhaustion of demand (bearish signal);
- the opposite is true for a price decrease.
While these observations are generally correct, they require a couple of important additions:
- if the price is rising and volumes are increasing to excessively high values, it may be a culmination of buys (the beginning of a downturn);
- if the price is rising but shows only minor progress, and volumes are significantly high, it could mean that a wave of demand is met by a limit seller (also a potentially bearish signal).
Useful links:
Horizontal Volumes
Volumes that depict trading activity at specific levels over a selected period.
Example. You can see the chart of E-mini S&P-500 futures again. But now it is enhanced with a market profile indicator for the daily period. It shows how many contracts were traded per time unit.
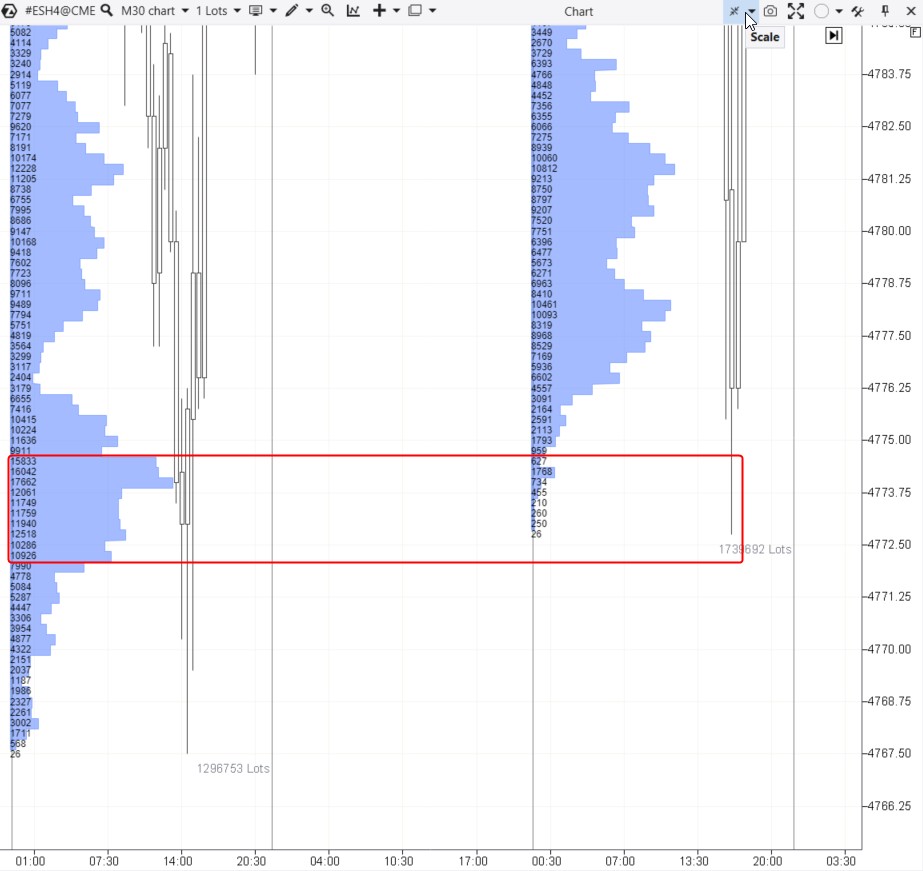
The market profile indicator shows:
- levels where trading was most active, indicated by wider bars on the histogram;
- levels where trading was less active, characterized by a narrower or thinner market profile.
In our case, numbers show how many contracts were bought/sold at each level within one day.
How to Use Horizontal Volumes?
It is believed that the price may (but not necessarily) react to sharp changes in the profile:
- Levels of significant volume. The most substantial levels over a period are called the Point of Control. In the example above, the price rebounds from the accumulation of levels with significant volumes (over 10 thousand contracts), formed during the previous session.
- Thin profile levels. A thin profile may indicate that one side (buyer or seller) has a clear advantage at a specific level.
- ‘Stair step’ pattern. When a cluster of active levels with significant volume is followed by a cluster of inactive levels (thin profile), it looks like a staircase. This pattern often leads to price reversals.
The price’s reaction to the mentioned profile characteristics can be explained by the fact that it touches the interests of those who previously traded at these levels. For example, testing the Point of Control makes numerous position holders to either close positions at breakeven, reduce positions, or add to them.
It is challenging to explain in words, it is better to see for yourself. Download ATAS, add the profile to the chart, and observe the price reaction.
Useful links:
Cluster Charts
Cluster charts (or footprints) are a way to visualize the trading history on the exchange with the maximum possible detail. With the advancement of technology, ordinary market participants have gained the ability to ‘look inside’ traditional candlesticks of the exchange chart and study how trading unfolded, down to each trade.
Example. A cluster chart of the Euro futures. To activate the cluster mode in ATAS, open the chart and press Shift+K (or stretch the time scale with the mouse). A menu for configuring clusters will appear on the left (indicated by the red arrow).
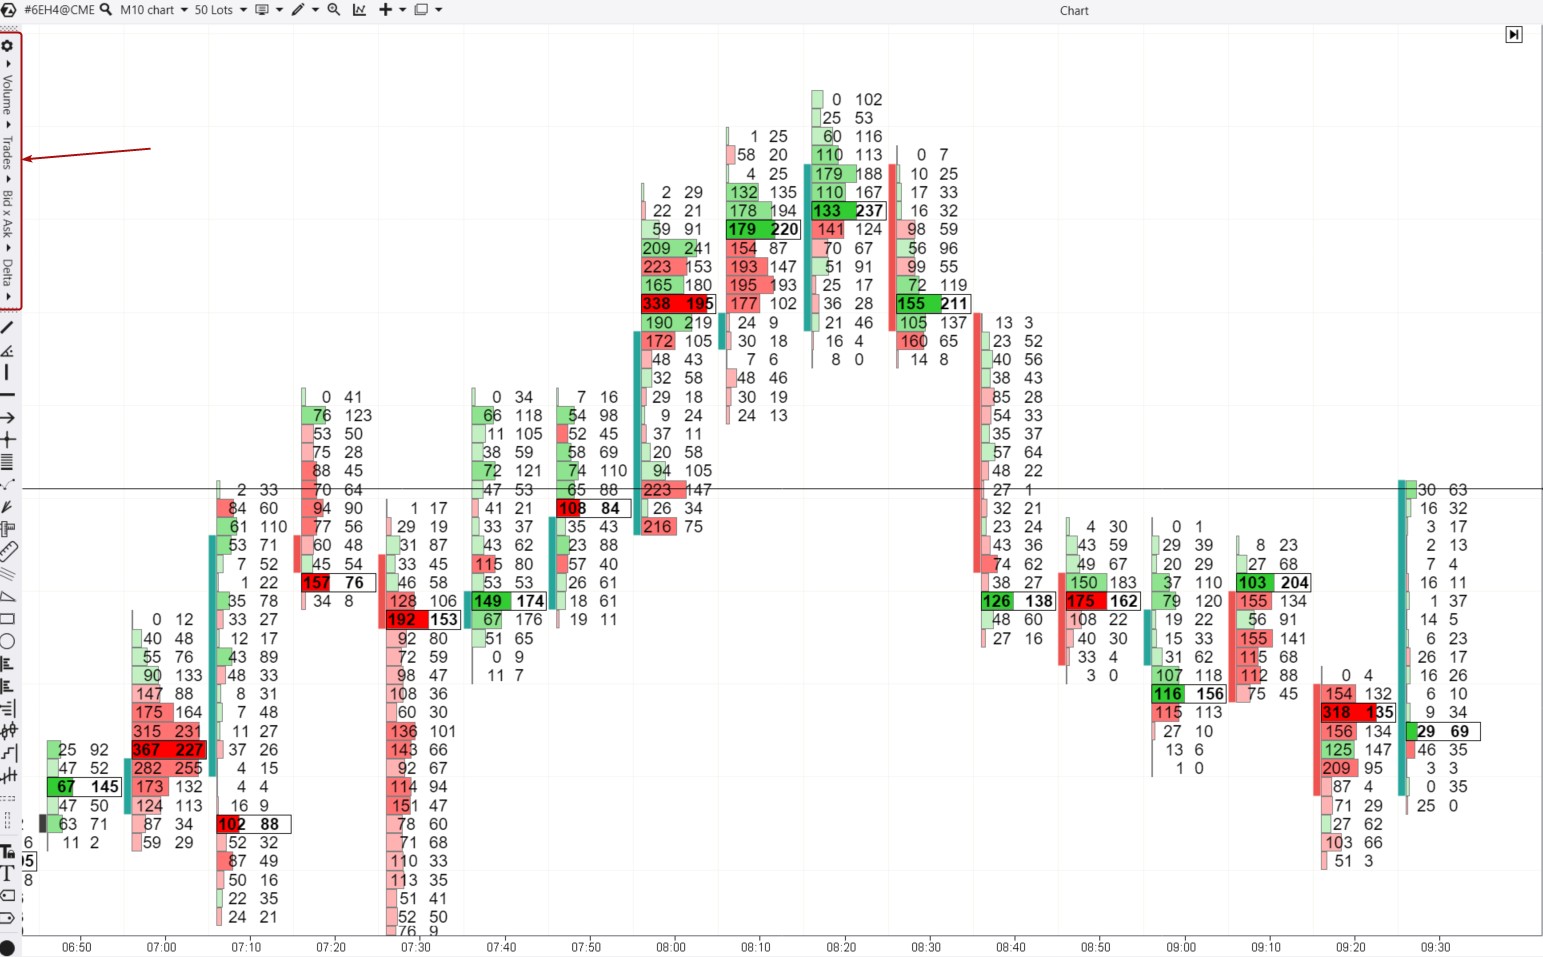
ATAS provides access to over 400 different variations of cluster charts. In the footprint above, you can see:
- numbers — two columns with bid and ask trades;
- a colorful histogram — the most important parts of the chart. The histogram makes visualizing information more accessible and user-friendly.
How to Analyze Cluster Charts?
Making trading decisions based on footprint charts is not based on the logic of ‘buying because the fast EMA crossed the slow one from below upwards.’ When analyzing cluster charts, focus on understanding the confrontation between buyers and sellers. Pay attention to:
- who takes the initiative, it can be observed through buy and sell volumes;
- what progress (price change) this initiative leads to;
- whether this progress is stable.
Useful links:
Volume Analysis of Level II
Market Depth (Depth of Market, DOM) is an indicator that displays information about buy and sell orders placed in the market.
This valuable Level II information is broadcasted by the exchange and can be used by traders to identify support and resistance levels.
Market depth analysis is also referred to as order book analysis.
Example. The DOM Levels indicator has been applied to the chart of Nasdaq index futures. It enables the analysis of price behavior at levels where significant volumes (limit buy and sell orders) have been placed.
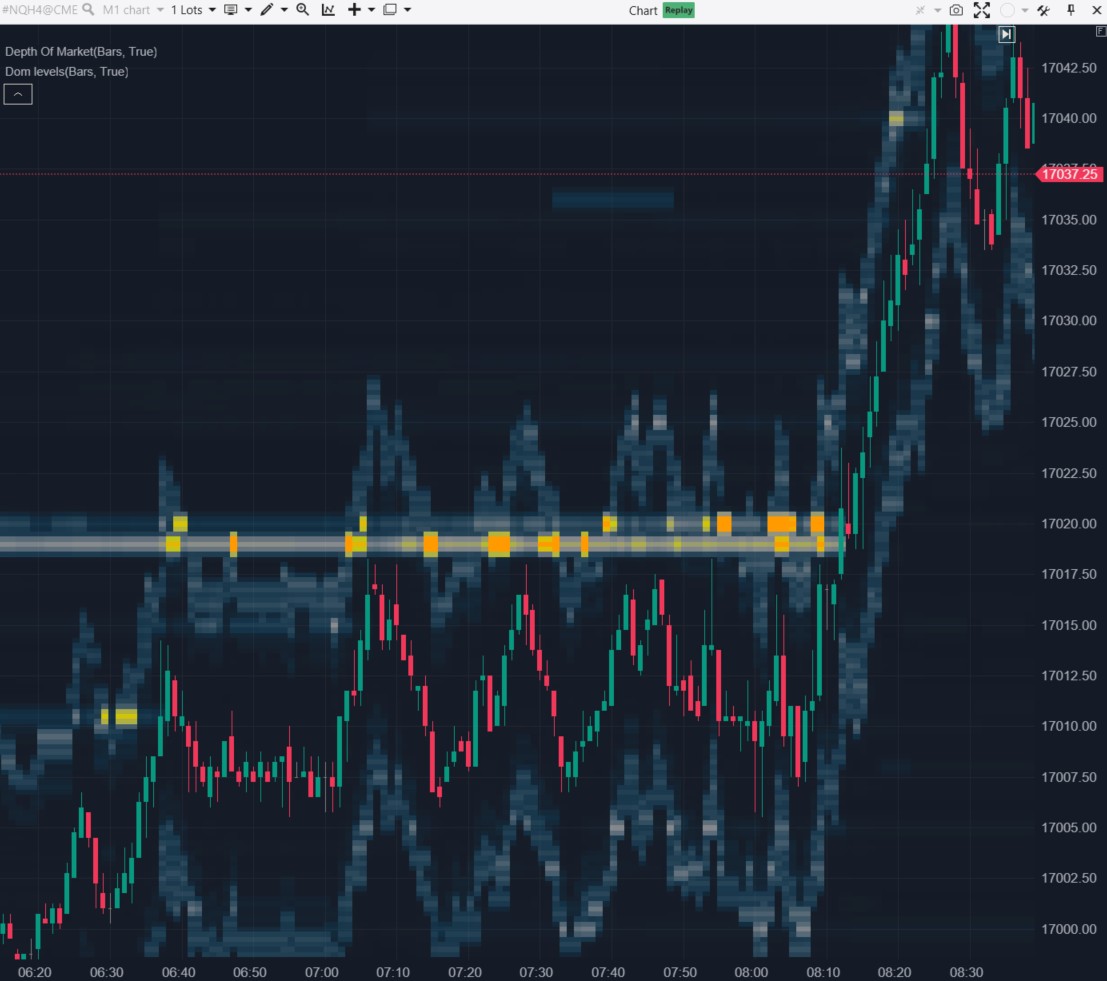
The indicator helps identify a strong resistance level around 17020. Pay attention to the price behavior:
- it bounces off the resistance several times – a signal to enter a short position;
- it sharply increases after the breakout – a signal to enter a long position.
How to Analyze the DOM?
Similar to other volume analysis methods, analyzing the DOM does not provide signals with 100% accuracy. However, by studying recurring patterns of price reaction to significant volume levels, you can assess the market situation more deeply. It will enable you to make more informed decisions when it comes to opening and closing positions.
Useful links:
Tip. You can combine footprints, market depth indicators, and horizontal and vertical volumes on a single chart. This way, you will gather the maximum of useful information for making well-informed trading decisions. This approach provides you with a competitive edge over other traders.
FAQ
How to calculate volumes in trading?
You do not need to calculate them. The exchange does that, while indicators and trading platforms provide the information in an easy format for analysis.
What does the volume indicator show in trading?
It can represent the number of bitcoins sold, the quantity of executed trades, or something else.
What is the name of the indicator that shows volumes?
The Volume indicator is commonly used for volume analysis. The Delta indicator is used to analyze volumes with a distinction between buys and sells. The Market Profile indicator is used for analyzing trading volumes at a specific price level.
What do volumes mean in trading?
Volumes convey information about trading activity. By applying the logic of supply and demand, hypotheses can be created. For example:
- If the price is slowly rising, and volumes are below average and gradually decreasing even further, it may indicate a lack of buyers. Market participants are unwilling to overpay for the asset, leading to a decrease in trading activity. Consequently, a further downturn reversal could be assumed;
- If the price rise is impeded at extremely high volumes, it may suggest the presence of a seller in the market, confronting the influx of buyers with a big wall of limit sells.
Study various patterns of price and volume interaction, by doing so, you will be able to get a full picture of changes in supply and demand over time. This allows you to make informed predictions about the chances of the price moving in one direction or another.
How to Start Analyzing Volumes
You need four components:
- A platform. A basic program will not suffice. For professional volume analysis, you will need a specialized platform with built-in indicators like Delta, Profile, and others.
- Data. This involves quotes from exchanges, including information on volumes (Level II data if necessary).
- Educational Materials. No course from trading gurus will make you a successful trader overnight. Be prepared to continually learn, and try to absorb information from various sources.
- Time, motivation, action. It all comes down to you – the time and effort you invest, along with your strengths and weaknesses.
How to Use ATAS for Volume Analysis
The first three components can be found on our website. Here, you can download the ATAS platform – premium-class software for volume analysis.
The benefits of this decision are crystal clear!
A wide range of connections. You can conduct comprehensive volume analysis in stock, futures, and cryptocurrency markets.
A training mode. You can learn to analyze volumes without a broker. Market Replay, a market simulator, reproduces historical data as if trading is happening in real time. Practice trading on the financial market in a simulator without risking real capital!
Educational Materials. Our blog, YouTube channel, and Knowledge Base provide specific instructions on setting up and working with charts, applying indicators, developing strategies, and other valuable information for day trading. Additionally, ATAS platform users can rely on responsive customer support.
A wide range of functionality for volume analysis:
- Indicators. ATAS offers tick-level granularity, enabling volume analysis with maximum accuracy. Some of the most useful indicators include: Cluster Search, Big Trades, and Speed of Tape.
- Cluster charts or footprints. By accessing information inside candlesticks, you can make more informed decisions compared to traders who only see 1-minute candlesticks. Additionally, you can experiment with different timeframes.
- Modules for the Tape and DOM analysis Useful ATAS tools for working with Level II and Order Flow include Smart DOM, DOM levels, Smart Tape. Do not forget the indispensable tool for scalpers — DOM Trader.
Conclusions
Volume analysis in trading is a methodology for assessing the strength or weakness of the market based on the number of trading operations over a specific period. This analysis helps understand how actively market participants are involved in price movements, providing crucial insights into potential reversals or trend continuations.
On one hand, volume analysis allows for a much more precise evaluation of the market situation. On the other hand, to become proficient in volume analysis, one needs to learn and have specialized software in their toolkit.
Download ATAS. It is free. During the trial period, you will get full access to the platform’s tools to experiment with volume analysis. Moreover, you can continue using the program for free even after the 14-day trial period is over, whether it is for cryptocurrency trading or volume analysis on history.
Do not miss the next article on our blog. Subscribe to our YouTube channel, and follow us on Facebook, Instagram, Telegram, or X, where we publish the latest ATAS news.
Information in this article cannot be perceived as a call for investing or buying/selling of any asset on the exchange. All situations, discussed in the article, are provided with the purpose of getting acquainted with the functionality and advantages of the ATAS platform.


