
Smart Money Concept (SMC) is a strategic trading approach developed by a trader known as Inner Circle Trader (ICT). This concept appeals to both beginners and experienced traders, as it focuses on the actions of so-called “Smart Money” and their strategies for influencing the market.
While the author emphasizes price action over volume analysis, the Smart Money Concept aligns perfectly with volume-based indicators. These tools provide deeper insights into market patterns and help traders apply them with greater confidence.
In this context, the capabilities of ATAS, a leading volume analysis platform, are particularly valuable. ATAS enhances the Smart Money Concept by equipping traders with powerful tools to identify Smart Money activity.
Mastering the Smart Money Concept can be challenging, particularly for beginners. This article will guide you through the key principles of the strategy and show you how to apply them in practice.
Read more:
Disclaimer: ATAS is not affiliated with Michael Huddleston (Inner Circle Trader, ICT) and does not promote his trading strategies. The articles on SMC published in our blog are intended to demonstrate how ATAS’s volume analysis tools can effectively complement the Smart Money Concept in trading.
Who Is Inner Circle Trader (ICT)?
Inner Circle Trader (ICT) is the alias of the trader behind the Smart Money Concept (SMC). His real name is Michael Huddleston, and he is based in the United States. The name Inner Circle Trader was inspired by Inner Circle Workshop, an educational program by Larry Williams. Huddleston liked the phrase so much that he adopted it as his personal brand.
The term suggests exclusive market insights and a focus on analyzing the strategies of major market participants—those who drive price movements.
Michael Huddleston grew up in an ordinary family. The only person close to trading in his circle was his uncle, who occasionally speculated on the commodities market, trading sugar futures. During family gatherings on weekends, he often encouraged Michael to explore futures and options trading. Huddleston’s professional journey, however, began with vending machine maintenance. Frustrated with the low rewards despite the effort he put in, he decided to pursue something different. When he came across an advertisement for trading courses, he decided to give it a try. This was in the early 1990s. His first trade after completing the course ended in a loss. But it fueled his determination to succeed—he wanted to be the person on the other side of the trade, making money instead of losing it. For the next nine months, he experienced a period of consistent profitability, but his success was cut short when the uptrend he had been following reversed. It took Michael several years to achieve consistent profitability in futures trading, regardless of market conditions. Rather than focusing on cryptocurrencies, he prefers trading futures on stock indices and currencies.
Michael Huddleston’s Path to Trading Success ↓

Michael distilled his trading insights into the Smart Money Concept and introduced it to a wider audience. His approach quickly gained traction among beginner traders by offering a structured framework for understanding how major market players operate. With its detailed breakdown of price movements and practical application strategies, SMC not only gained widespread recognition but also cemented ICT’s reputation as a leading mentor in the trading community.
How Does the ICT Strategy Work?
Michael Huddleston’s methodology became known as the Smart Money Concept (SMC) because its core focus is analyzing the intentions of Smart Money—a group of market participants who, despite being relatively few in number, control significant capital and drive price movements.
This process can be compared to whale hunting—just as whales need large schools of small fish to satisfy their appetite, Smart Money entices retail traders to open positions, allowing them to absorb liquidity and push the market in the desired direction. Whales are known to create bubble nets to herd small fish into dense schools, making them easier to catch. The same principle applies to financial markets:
- Whales represent Smart Money – large institutional players.
- Small fish are the counter liquidity from retail traders, which Smart Money needs to execute large positions.
ICT’s methodology focuses on analyzing market manipulations, understanding Smart Money tactics, and recognizing their strategies. By mastering these principles, traders can learn to follow major players rather than becoming their prey.
Market Structure Analysis
Traders following the ICT strategy start their analysis by identifying market structure, which appears as the trajectory of price swings between highs and lows. In this system, liquidity levels play a crucial role and can be seen as “departure” and “destination” points:
- Accumulation zones – areas where Smart Money finds enough sell orders from retail traders to build their positions.
- Distribution zones – areas where retail traders actively buy, generating the liquidity Smart Money needs to exit their positions.
According to Michael Huddleston, price moves from one liquidity zone to another. This movement reflects the logic behind market dynamics, its intentional nature, and what he describes as its algorithmic structure.
Market Manipulation Patterns
While traditional market analysis relies on candlestick patterns (such as the Shooting Star or Hanging Man) and chart patterns (for example, the Double Bottom), the Inner Circle Trader focuses on patterns driven by market manipulation. These include:
- False breakouts – instances where the price briefly crosses a key level, creating the illusion of a trend continuation, only to sharply reverse. This often forces traders to close positions at a loss. Read more here.
- Stop hunting – price movements designed to trigger stop orders and market orders placed by traders in obvious areas. Learn more in the article: Who Activates Your Stops and Why?
Order Flow Analysis
While volume analysis is not as fundamental to the Smart Money Concept methodology as it is in Volume Spread Analysis (VSA), integrating professional volume analysis tools can significantly enhance SMC.
ATAS, a leading platform in volume analysis, offers a robust set of advanced indicators that help traders identify Smart Money activity and gain deeper insights into the actions of major market players. These include:
Key Components of the ICT Trading Strategy
Do you need a break? Pause for a moment, grab a cup of tea, and check out our Smart Money video series on YouTube.
Now, let’s get back to the key components of the ICT strategy—this time with real trading examples to better understand how Smart Money moves the market.
Market Liquidity: SSL and BSL
A logical starting point for understanding the ICT strategy is liquidity, a concept we have already touched on. Here are two key terms:
- Buy Side Liquidity (BSL) — liquidity from retail buyers that Smart Money uses to execute their sell orders.
- Sell Side Liquidity (SSL) — liquidity from retail sellers that Smart Money needs to execute their buy orders.
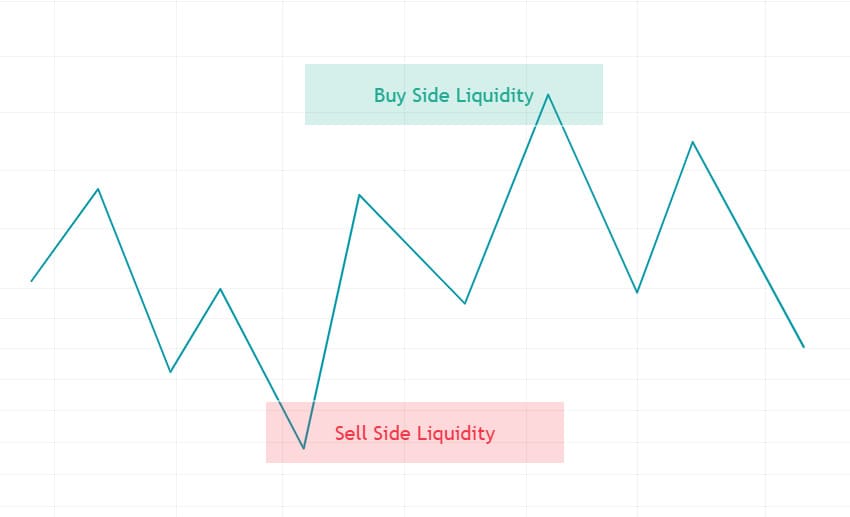
In other words, Smart Money buys at lows and sells at highs, while most retail traders do the exact opposite.
Market Structure and Break of Structure (BOS)
Market structure serves as the overall pattern of price movement, defining a sequence of swing highs and swing lows, which can be interpreted as follows:
- Uptrend – a series of Higher Highs (HH) and Higher Lows (HL).
- Downtrend – a sequence of Lower Highs (LH) and Lower Lows (LL).
- Consolidation (range ) – sideways price movement without a clear trend
A bullish structure forms when the price breaks out of the SSL zone and moves upward toward BSL. The diagram below illustrates an example of a downtrend.
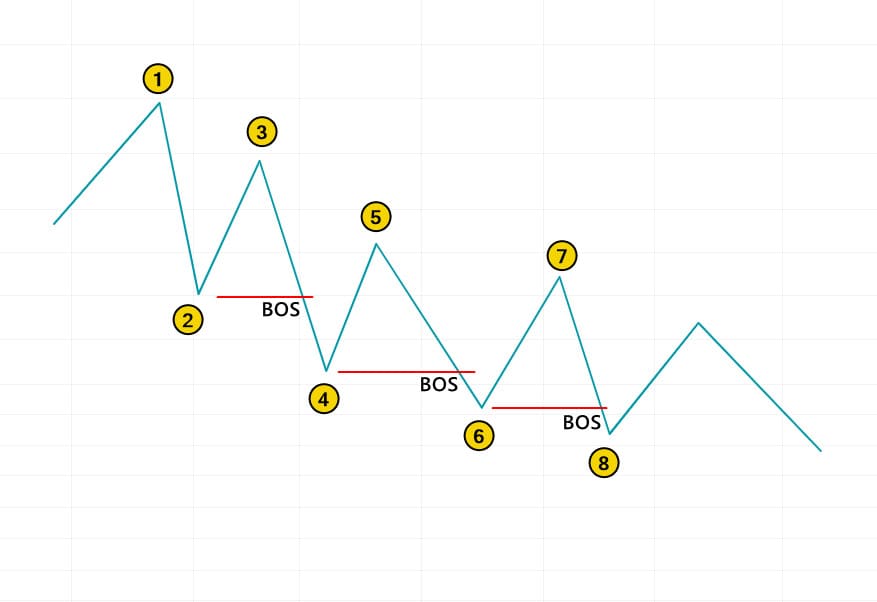
Break of Structure (BOS) occurs when the price breaks a previous swing high or low, confirming the trend’s continuation. In this context, BOS acts as a trend continuation pattern.
When analyzing market structure, ICT often incorporates Fibonacci ratios.
You can learn more about market structure and breakout patterns in the article: “Market Structure in the Smart Money Concept Strategy.”
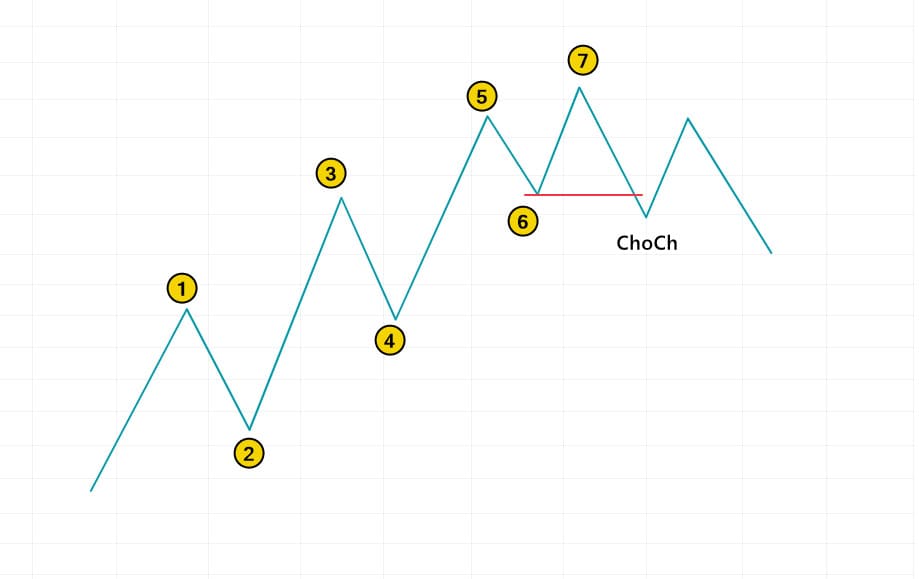
Change of Character (ChoCH)
Change of Character (ChoCh) is a key element of the Smart Money Concept (SMC) strategy, indicating a potential shift in market conditions and a trend reversal. It acts as an early signal that the current structure is breaking down, pointing to a change in price movement dynamics.
Learn more in the article “What Is a Change of Character (ChoCh)”, where you will find real chart examples of ChoCh patterns and learn how to use them effectively in trading alongside volume analysis.
Order block Pattern
The Order Block (OB) pattern forms at price reversal points. Typically, it is located to the right of the candle preceding the reversal and is then used to enter a position when the price retests the block. An example of a bearish OB is shown in the chart below:
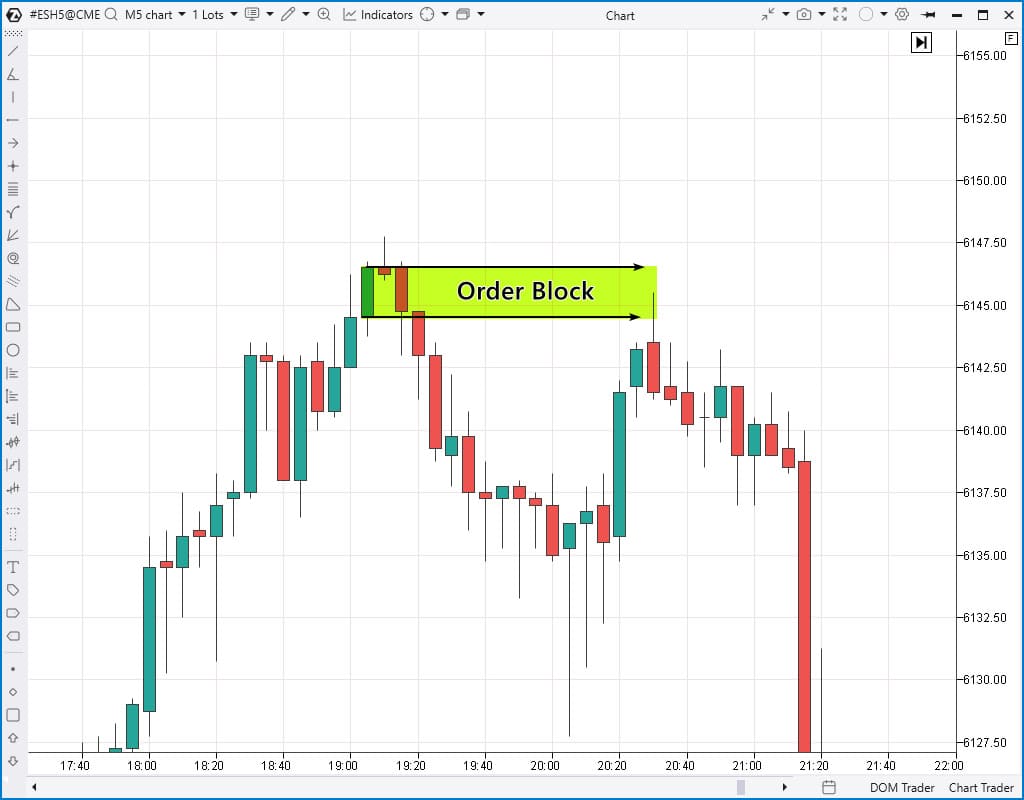
To learn more about identifying Order Blocks and confirming them with advanced volume analysis tools in ATAS, read the article “What Is an Order Block in Trading?” You will also find insights on the Breaker Block concept and how Smart Money uses these zones for market manipulation.
Fair Value Gaps (Imbalances)
Fair Value Gap (FVG) is a three-candle pattern that indicates a market imbalance. It forms when a gap appears between the highs and lows of the first and third candles during a sharp price movement.
An example of a bullish FVG is shown below, where the price surged after revisiting the SSL area.
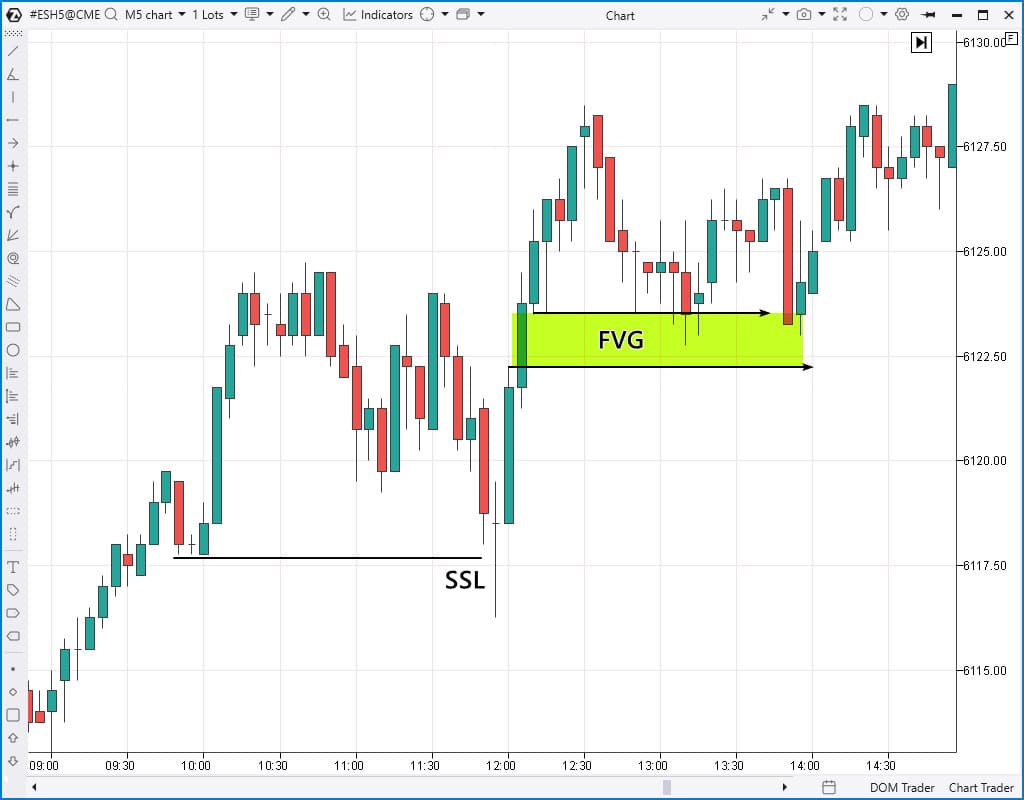
In SMC terms, Fair Value Gaps occur when price moves too quickly, creating zones where buying and selling are not balanced. These areas often attract the price later as the market seeks to rebalance liquidity. For traders, this can present an opportunity to enter a position in the trend’s direction when the price retests the FVG zone.
Learn more about Fair Value Gaps, with examples and indicators, in our dedicated article.
Kill Zones
In Smart Money Concept (SMC), the Kill Zone refers to price fluctuations within the three trading sessions within a 24-hour period: Asian, European, and New York.
The idea is that Smart Money active in the current session may use the range formed during the previous session to build positions, often pushing the price beyond its prior range’s boundaries.
Example. The chart below displays three market profiles corresponding to each trading session.
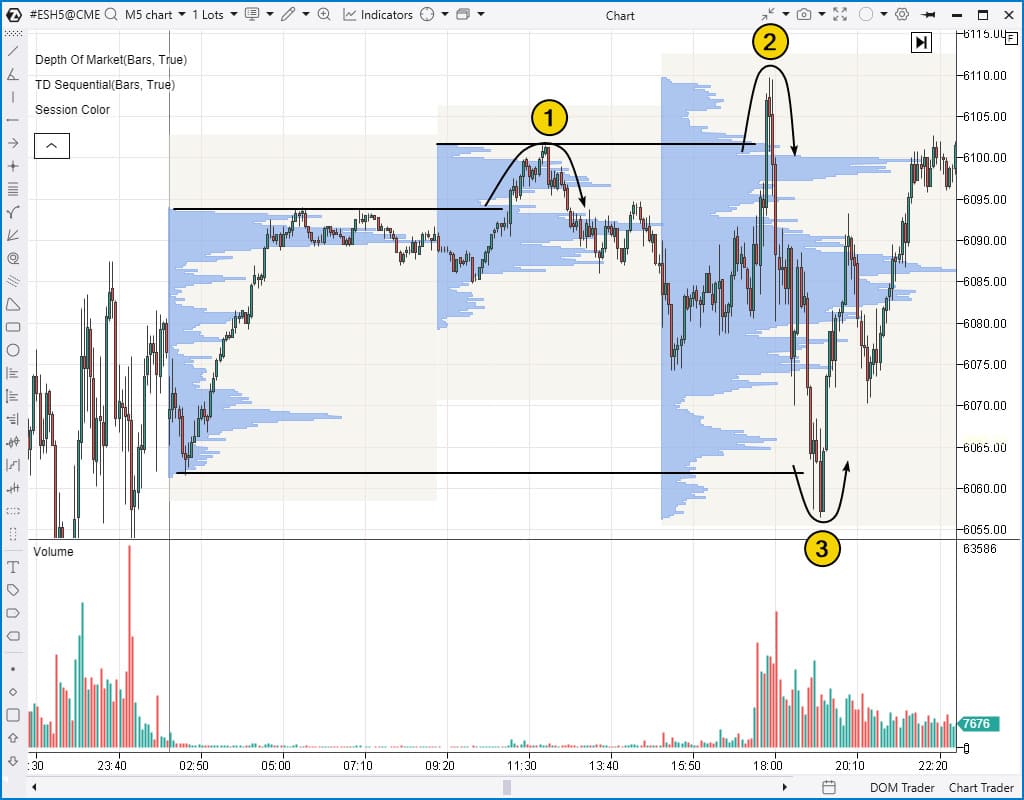
The numbers on the chart indicate key price movement points within the trading sessions:
(1) – The price moves above the Asian session high. Smart Money may have used this level to build short positions.
(2) – The price moves above the European session high. Another opportunity for Smart Money to enter short positions.
(3) – The price drops below the Asian session low. Smart Money could either open long positions or take profit on earlier short positions.
By applying the Kill Zone concept from Smart Money, traders can better manage their time and create support and resistance levels to enhance the effectiveness of their strategies.
Traders note:
- Asian session is a period of frequent consolidation, during which liquidity zones form and are later used in the following sessions, especially in London.
- London session is a time when the market often makes false breakouts before setting a trend direction for the day. This can be an ideal period for intraday trading and scalping.
- New York session is a phase when the price often tests liquidity zones created during the London session.
Mitigation block
Mitigation Block (MB) in the Smart Money concept refers to the principle where a support zone turns into resistance and vice versa. However, to properly assess market structure, certain rules must be taken into account.
For example, on the ES chart below, the price formed two peaks, H and LH (with the second one lower than the first), before dropping sharply below an intermediate low.
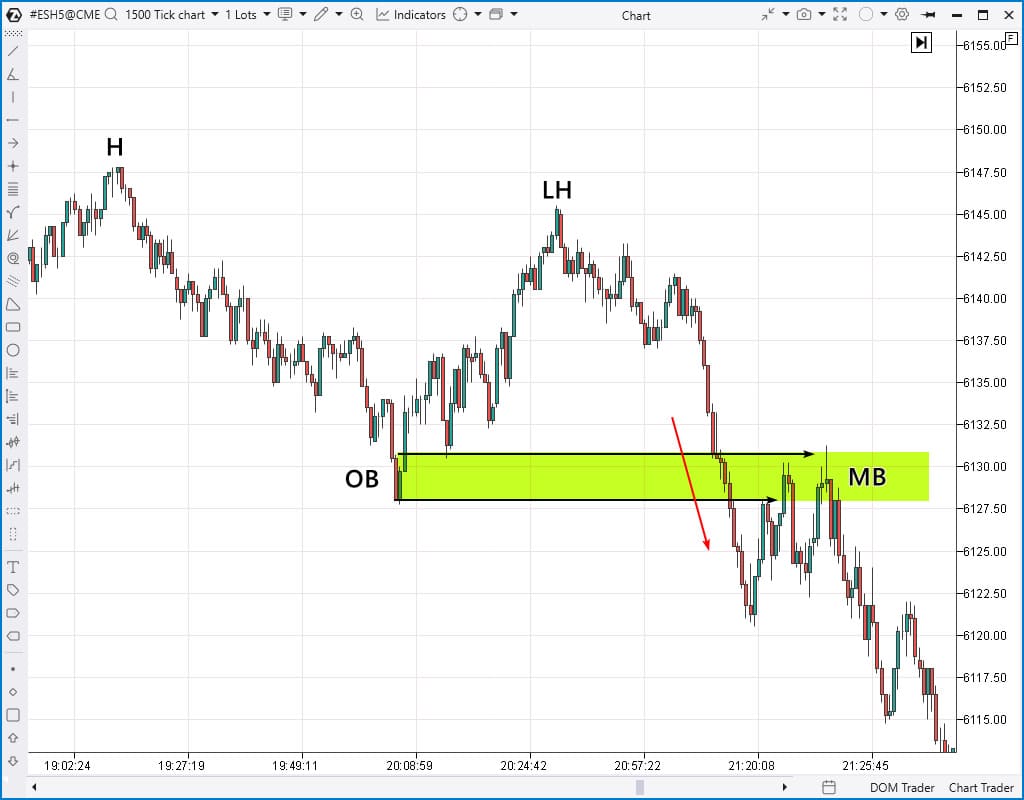
As shown in this case, the Order Block zone that previously acted as support began to show signs of resistance. This could have presented traders with an opportunity to enter short positions.
Balanced price range
A Balanced Price Range is often seen as a double FVG. When two opposing Fair Value Gaps form within the same price range over a short period, it can serve as a key trading signal.
Example. The chart below shows a prevailing bearish trend. At some point, bulls gained momentum and pushed the price up quickly, creating a bullish FVG (1).
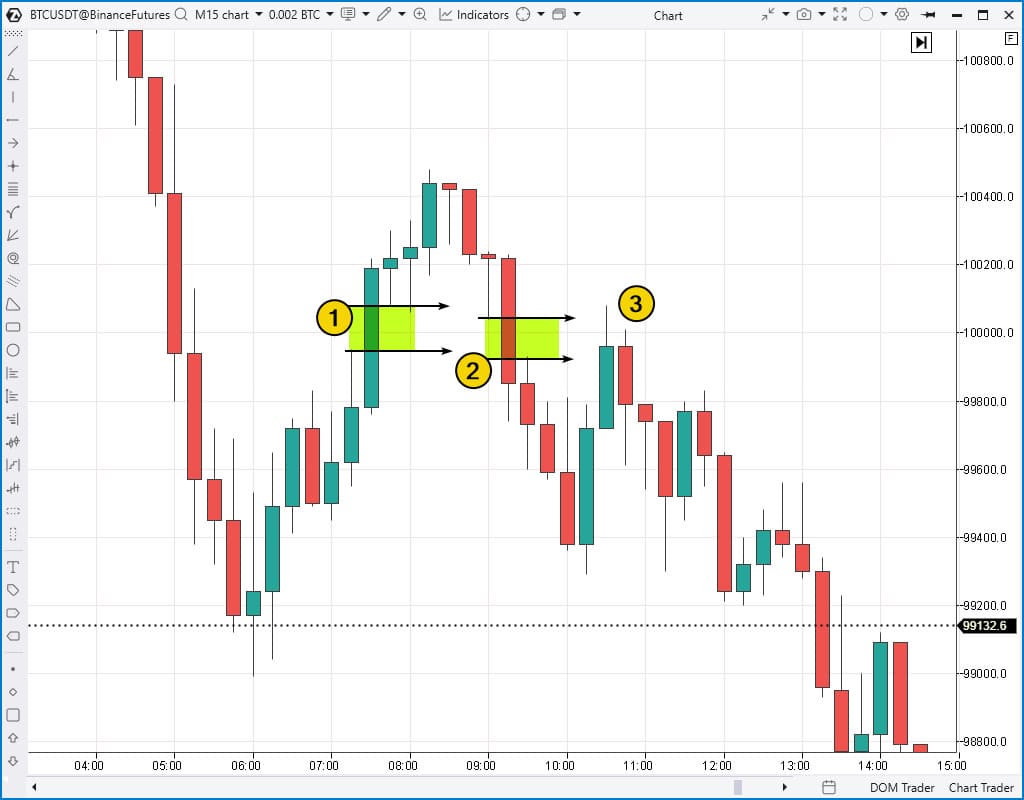
However, bears soon regained control, leading to the formation of a bearish FVG (2) at the same price level. Together, these two moves form a Balanced Price Range (BPR)—traders can look for a retest of this zone (3) as a trigger to enter a position in line with the trend.
FAQ About Smart Money Concept
What is the Smart Money Concept?
The Smart Money Concept (SMC) is a trading approach based on analyzing the actions of large market participants who manage significant capital and trade in high volumes.
What is the Smart Money strategy?
The Smart Money Concept (SMC) strategy is based on tracking the behavior of major market players who manipulate price movements to accumulate liquidity. The main goal is to follow Smart Money, using their algorithmic patterns, based on price shifts between liquidity zones.
Which is better: Wyckoff method or ICT strategy?
The Smart Money Concept and Richard Wyckoff method have a lot in common, as both focus on the actions of large market participants and their impact on price movements. What ICT refers to as Smart Money, Wyckoff called the Composite Operator. Overall, there are many parallels between these approaches.
Key differences:
- Wyckoff method puts more emphasis on volume analysis, particularly on daily timeframe charts.
- Smart Money Concept focuses less on volume but provides detailed guidelines for analyzing price patterns on intraday charts.
Rather than contradicting each other, these two concepts complement one another. Smart Money Concept is widely popular due to its extensive educational resources, continuously updated by ICT, but that does not mean Wyckoff method should be overlooked.
Asian Session Range
Traders with stock indices and other assets can use the price range of the Asian session (when price often forms consolidation zones) in the following way:
- create the high and low levels of the Asian session;
- during the European session, monitor the breakouts of these levels: it is possible that signs will appear indicating the price has entered a liquidity zone, and Smart Money is using this to form their positions;
- analyze the market structure and volume indicators – once confirmations are received, open a position, for example, using the FVG pattern.
New York Session Volume Profile
Although SMC does not typically focus on market profile, it can be a powerful tool for finding entry points when combined with the strategy’s rules.
Example. The 15-minute chart below shows how the Point of Control level from the previous day’s New York session could have been used to identify the extreme for the next day. Testing POC levels complements the Smart Money concept, as this is when the price is likely entering a liquidity zone.
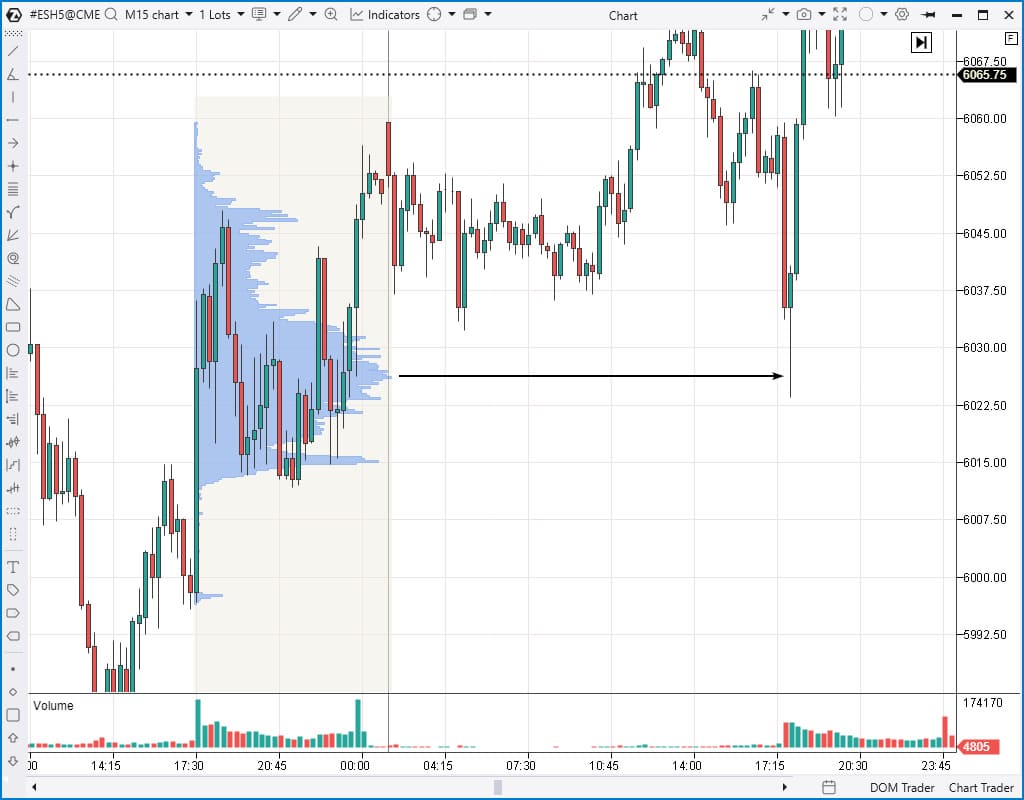
In such cases, switching to a minute time frame (or another lower time frame) is a logical step to identify an accurate entry with minimal risk.
How to Learn to Trade Using the Smart Money Strategy
To trade successfully using the Smart Money Concept (SMC), it is important to have a solid understanding of liquidity, market structure, and the behavior of major market players. Mastering the strategy requires studying patterns, testing them in real market conditions, and managing risk effectively.
Useful tips for trading with SMC:
✅ Study the source
Whenever possible, refer to the official ICT YouTube channel. Many other resources use the popularity of SMC but do not always explain the strategy correctly, distorting key principles.
✅ Use advanced ATAS tools
When analyzing charts with SMC, use additional tools: footprint charts, cumulative delta, vertical and horizontal volumes. These will help you better understand price movement and find more accurate entry points.
✅ Develop a clear trading plan
Choose one entry model that works for you (e.g., Liquidity Sweep + MSS + FVG) and practice it consistently until it becomes second nature.
✅ Train with a market simulator
Use ATAS Market Replay—one of the best tools to sharpen your skills. Replay historical data in real time, analyze charts, and test your strategy without risking your capital.
✅ Practice with minimal risk
Once you are ready, switch to a live account. Use minimal risk (no more than 1% per trade). Keep a trading journal to track all your trades, analyze mistakes, and adjust your strategy accordingly.
Conclusion
The Smart Money Concept provides an understanding of how smart money “hunts” for liquidity. A trader gains insight into why the price moves, where it goes, and for what purpose. However, like any other strategy, SMC has not only strengths but also weaknesses.
Advantages of the Smart Money Concept:
✔ Precise trading decisions. The market structure, Market Structure Shift (MSS), Fair Value Gap (FVG), Order Blocks (OB), and other SMC elements work together to enable traders to enter positions with high accuracy and minimal risk.
✔ Compatibility with volume analysis. Market profiles, footprint charts, Delta indicators, and other tools offer additional confirmations. Traditional and lagging indicators are not required for the strategy to work effectively.
✔ Versatility. SMC works across different time frames, markets (including forex, cryptocurrencies, stocks, and futures), and trading styles (making it suitable for both scalping and medium-term trading).
Disadvantages of the Smart Money Concept:
✘ Takes a lot of time to learn. The strategy is quite complex, beginners might find it challenging to understand all the key elements (Liquidity Sweeps, MSS, FVG, OB, Kill Zones) right away.
✘ Not suitable for simple mechanical trading. It requires analyzing market context, making it harder to automate compared to indicator-based strategies. As a result, backtesting on historical data is not possible.
✘ Subjectivity. Beginners may struggle to interpret market movements and build the right structure. Sometimes, conflicting arguments can add extra psychological pressure.
The ATAS platform offers powerful tools that can take your Smart Money Concept trading to the next level. With Market Replay, you can replay historical data and practice without any risk. Footprint charts give you a detailed view of order flow, while cumulative delta helps track the imbalance between buyers and sellers. These, along with many other tools on our platform, provide invaluable competitive advantages, enabling you to gain a deeper understanding of market dynamics and make more precise trading decisions.
Download ATAS. Once you install the platform, you will automatically get the free START plan, which includes cryptocurrency trading and basic features. You can use this plan for as long as you like before deciding to upgrade to a more advanced plan for additional ATAS tools. You can also activate the Free Trial at any time, giving you 14 days of full access to all the platform’s features. This trial allows you to explore the benefits of higher-tier plans and make a well-informed purchasing decision.
Do not miss the next article on our blog. Subscribe to our YouTube channel, follow us on Facebook, Instagram, Telegram or X, where we publish the latest ATAS news. Share life hacks and seek advice from other traders in the Telegram group @ATAS_Discussions or on Discord.
Information in this article cannot be perceived as a call for investing or buying/selling of any asset on the exchange. All situations, discussed in the article, are provided with the purpose of getting acquainted with the functionality and advantages of the ATAS platform.


