
The Dow Jones Industrial Average (DJIA) is one of the oldest and most respected stock indices in the United States. It tracks the stock prices of 30 major American companies to reflect the overall state of the U.S. economy.
Having a solid understanding of the Dow Jones Index is essential for successful investing and market trend analysis. In this article, we will explore:
Understanding the Dow Jones Industrial Average (DJIA)
The Dow Jones Industrial Average (DJIA) is calculated based on the stock prices of 30 of the largest U.S. companies. The higher the stock prices, the higher the index value.
The DJIA is often used as an indicator of the overall health of the U.S. economy. Since it consists of large, stable industrial companies, significant fluctuations in the index can signal major changes, such as economic expansions or recessions.
Historical Milestones
The Dow Jones Industrial Average is named after its founders:
- Charles Dow, a Wall Street legend;
- Edward Davis Jones, his business partner.
In 1882, they founded the Dow Jones & Company and began publishing stock indices in an investor bulletin, which later became the Wall Street Journal.
The first DJIA value was calculated as a simple arithmetic average of the stock prices of the included companies, amounting to approximately 62.75 points.
1896
The creation of the index. Initially, the index consisted of just 12 companies, mostly from the railroad sector. Over time, it expanded to include leading American companies from various sectors of the economy.
1928
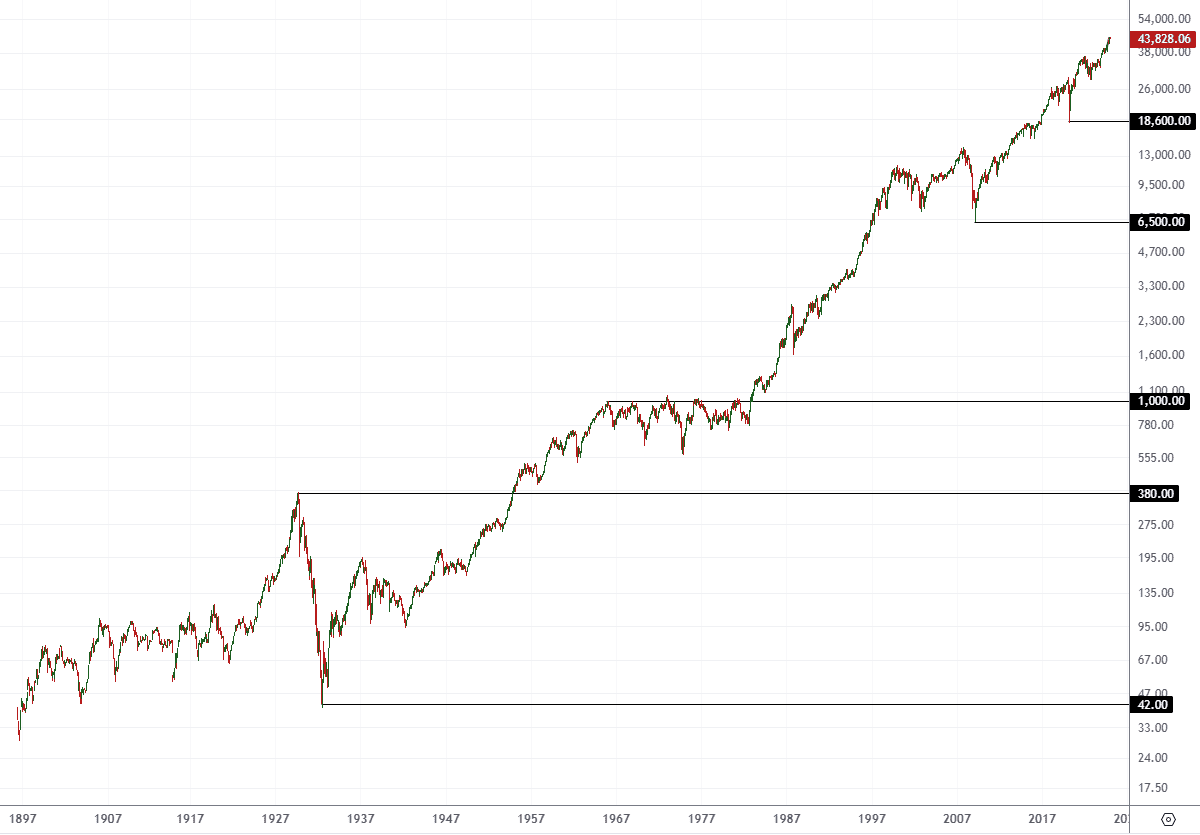
The number of stocks in the index increased to 30 shortly before the Great Depression. During the Depression, the Dow Jones lost approximately 88% of its value, demonstrating its vulnerability to economic downturns.
1954
The Dow Jones index surpassed its pre-Great Depression peak for the first time.
1966-1982
The index fluctuated below the key psychological barrier of 1,000 points.
1999
The Dow Jones broke through the 10,000-point mark.
2008-2009
Amid the global financial crisis, the index lost around 55%, bottoming out near 6,500 points.
2020
During the panic triggered by the spread of COVID-19, the index dropped by about 39%, reaching a low near 18,600 points.
How the Index Is Calculated
The DJIA is a price-weighted index, meaning its value is determined by the stock prices of the companies included in the index. A unique feature of the DJIA is its use of the Dow Divisor.
The Dow Divisor is not a fixed number but a coefficient that changes over time. It accounts for corporate actions like stock splits, mergers, and dividend payouts, ensuring the continuity of the index. As of early 2025, the Dow Divisor is approximately 0.16.
Formula for Calculating the DJIA

For example, if the total stock prices of the 30 companies in the DJIA add up to $3,000 and the current Dow Divisor is 0.147, the DJIA value would be ≈ 20,408.
The index is calculated by S&P Dow Jones Indices, an organization that is majority-owned by S&P Global.
- In its early years, the Dow Jones Industrial Average was highly volatile as the U.S. industrial economy was just beginning to develop.
- The historical low was 28.48 points, reached during the summer panic of 1896.
- The largest single-day drop occurred on “Black Monday,” October 19, 1987, when the index fell by 22.61%. The exact causes of the crash have never been determined.
- The smallest annual shift in the DJIA index was -52.67% in 1931, during the Great Depression.
- The largest annual increase of +81.66% occurred in 1915, marked by a strong market recovery after the downturn caused by the start of World War I and a period of economic instability.
- The average annual growth rate of the DJIA is approximately 7.59%.
- None of the companies included in the first calculation of the index are part of it today. The longest-standing company in the Dow Jones Industrial Average was General Electric (GE). It was part of the initial calculation in 1896 and remained in the index, with a few exceptions, until 2018, when it was removed due to worsening financial performance and a significant drop in stock price.
Components: The 30 Stocks in the DJIA
The DJIA consists of “blue-chip” companies—well-established businesses that are financially stable and have a long history of success. Companies like Apple, Boeing, Coca-Cola, Disney, and others are among its components.
Since its creation, the composition of the DJIA has undergone numerous changes, reflecting shifts in the economy. One major reshuffling occurred in 1932 under the influence of the Great Depression.
What stocks are included in the Dow Jones?
The companies in the Dow Jones are chosen by a specialized committee. Their selection is based on a mix of financial performance and the company’s importance within its industry.
- On August 31, 2020, Amgen, Honeywell, and Salesforce replaced ExxonMobil, Pfizer, and Raytheon Technologies.
- On February 26, 2024, Amazon replaced Walgreens Boots Alliance.
- On November 8, 2024, Nvidia replaced Intel, and Sherwin-Williams replaced Dow Inc.
Investing in the Dow Jones Index
The DJIA often serves as a key indicator of overall market sentiment and is used in various ways depending on investors’ strategies and goals.
✓ Underlying asset. Many financial products, such as Exchange-Traded Funds (ETFs) and other derivatives, are tied to the DJIA. By investing in these products, investors aim to track the price movements of the companies included in the index.
✓ Comparative analysis. Analysts use the DJIA to evaluate the price performance of individual stocks relative to the index. This helps determine whether a stock is a market leader or lagging behind.
✓ Strategic planning. The DJIA’s rich historical data allows for building models, developing long-term investment strategies, and analyzing economic development.
✓ Diversification tool. Investing in the Dow Jones Index can be effectively combined with investments in stock indices from other countries or commodities markets. Additionally, the DJIA’s lower volatility can help reduce the risks associated with investing in individual stocks.
Criticism of the Index
The Dow Jones Industrial Average (DJIA) cannot be considered a poor index, given its 125+ years of history and continued growth. However:
- DJIA only includes 30 stocks. While this number might have been representative 100 years ago, it falls short in today’s economy with numerous emerging industries. Compared to broader indices like the S&P 500, the DJIA does not fully capture economic activity or market trends.
- Price-weighted index. The DJIA is calculated based on the stock prices of its components rather than their market capitalization. As a result, higher-priced stocks have a greater impact on the index, which can distort the overall picture.
How to Use the Dow Jones Index in Trading
In 1997, the Chicago Board of Trade (CBOT), now part of the CME Group, launched trading in futures contracts on the Dow Jones Industrial Average, known as E-mini Dow Futures. This development, driven by the rise of online trading, created new opportunities for traders worldwide:
✓ A valuable underlying asset. Futures, as derivative financial instruments, closely track all fluctuations in the index, reflecting them in the contract price. (Learn more: What is a futures contract?)
✓ Two-way trading. Traders can take long positions (expecting the Dow Jones Index to rise) or short positions (expecting its decline), allowing them to profit from price movements in either direction.
✓ 24/5 trading. E-mini Dow futures can be traded almost around the clock, regardless of the standard trading hours of stock exchanges.
✓ Hedging opportunities. E-mini Dow futures offer investors a way to hedge their portfolios against market risks. For example, if an investor anticipates a market downturn, they can open short positions in E-mini Dow futures to offset potential losses from holding stocks.
✓ Speculation potential. Thanks to its high liquidity, tight spreads, relatively low fees, and leverage options, the E-mini Dow is a popular instrument for intraday traders.
The screenshot below illustrates the potential opportunities available when trading Dow Jones Index futures.
Example of a Trade with the E-mini Dow Futures Contract
The left chart shows a 30-minute chart with a Delta indicator and a customized market profile, offering insight into the overall market context. On the right, the footprint chart shows detailed data on trading volumes at each price level.
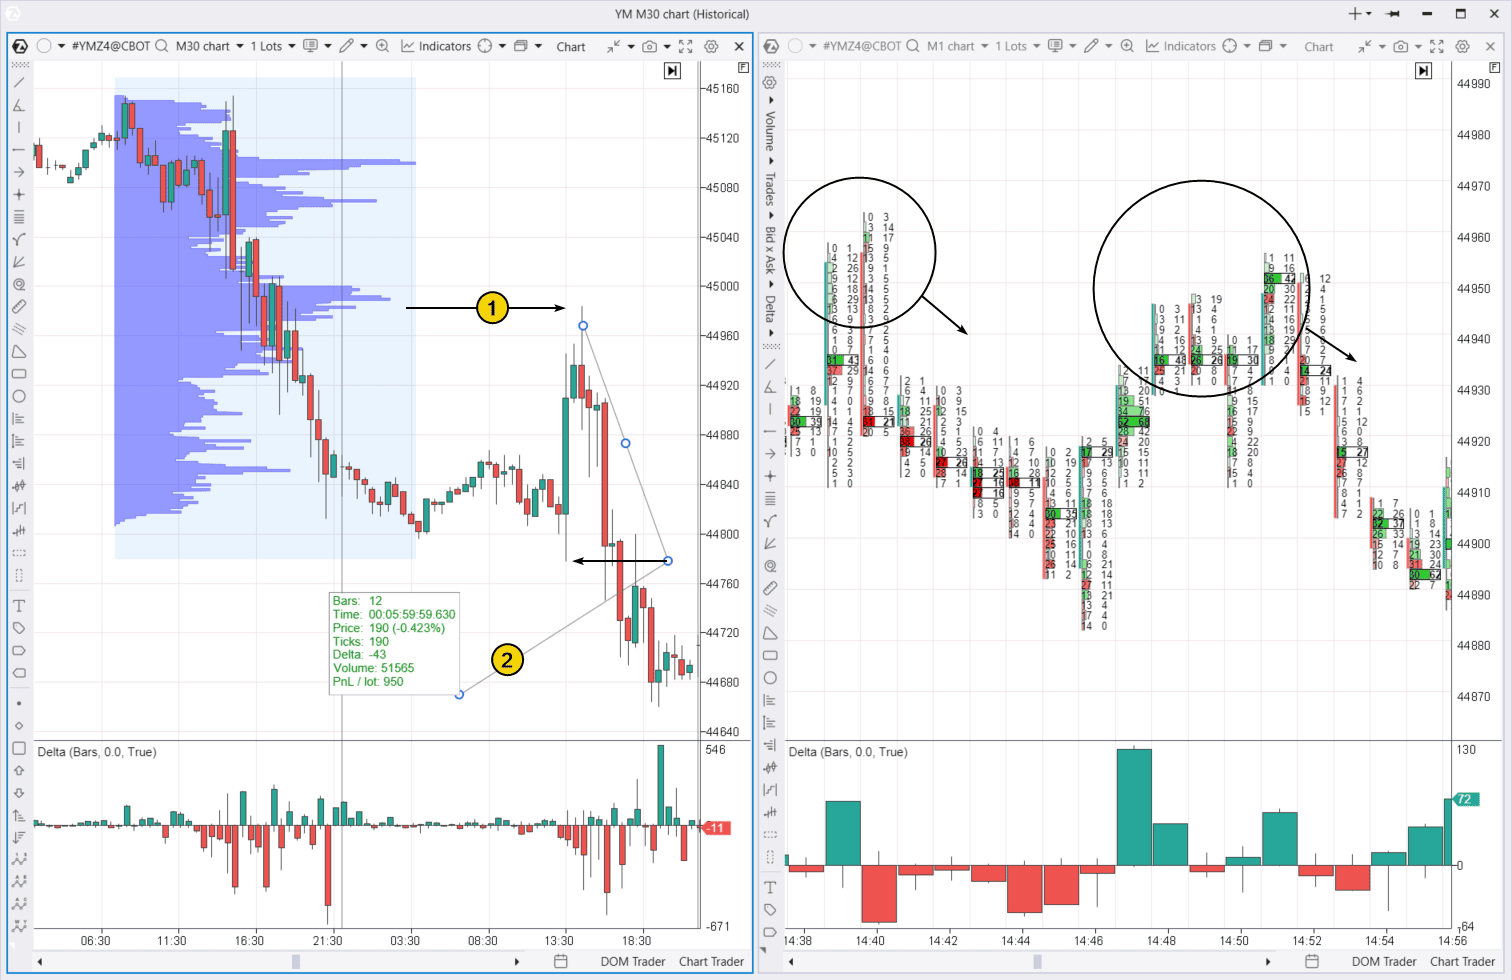
Let’s consider a scenario where a trader identified a key level (1) on a 30-minute chart using a profile bulge. That level represented a point where supply and demand were temporarily balanced—trades were executed without significant price movement because both buyers and sellers were equally satisfied with the price. Afterward, the balance tipped in favor of the sellers, causing the price to move downward.
However, the following day, the price rose, providing the trader with an opportunity to enter a short position. The trader anticipated that the price would reverse downward from this identified level (a test of the high-volume level), where sellers had gained some control the previous day.
The footprint chart confirmed this trade setup. Despite market-buying activity (green clusters), the price was moving lower. This presented an opportunity to potentially earn up to $1,000 per contract (as indicated by figure 2) within a few hours, assuming the short position was opened and held until the daily low was broken.
While there is no guarantee of making a profit from trading Dow Jones index futures, you can greatly improve your chances by taking a structured approach: get proper training, develop a solid strategy, test it with historical data, and trade with discipline.
How to Start Trading Dow Jones Index Futures
First, download, install, and launch the ATAS platform for free. The platform also has a “Learn” tab, offering useful resources focused on volume-based trading.
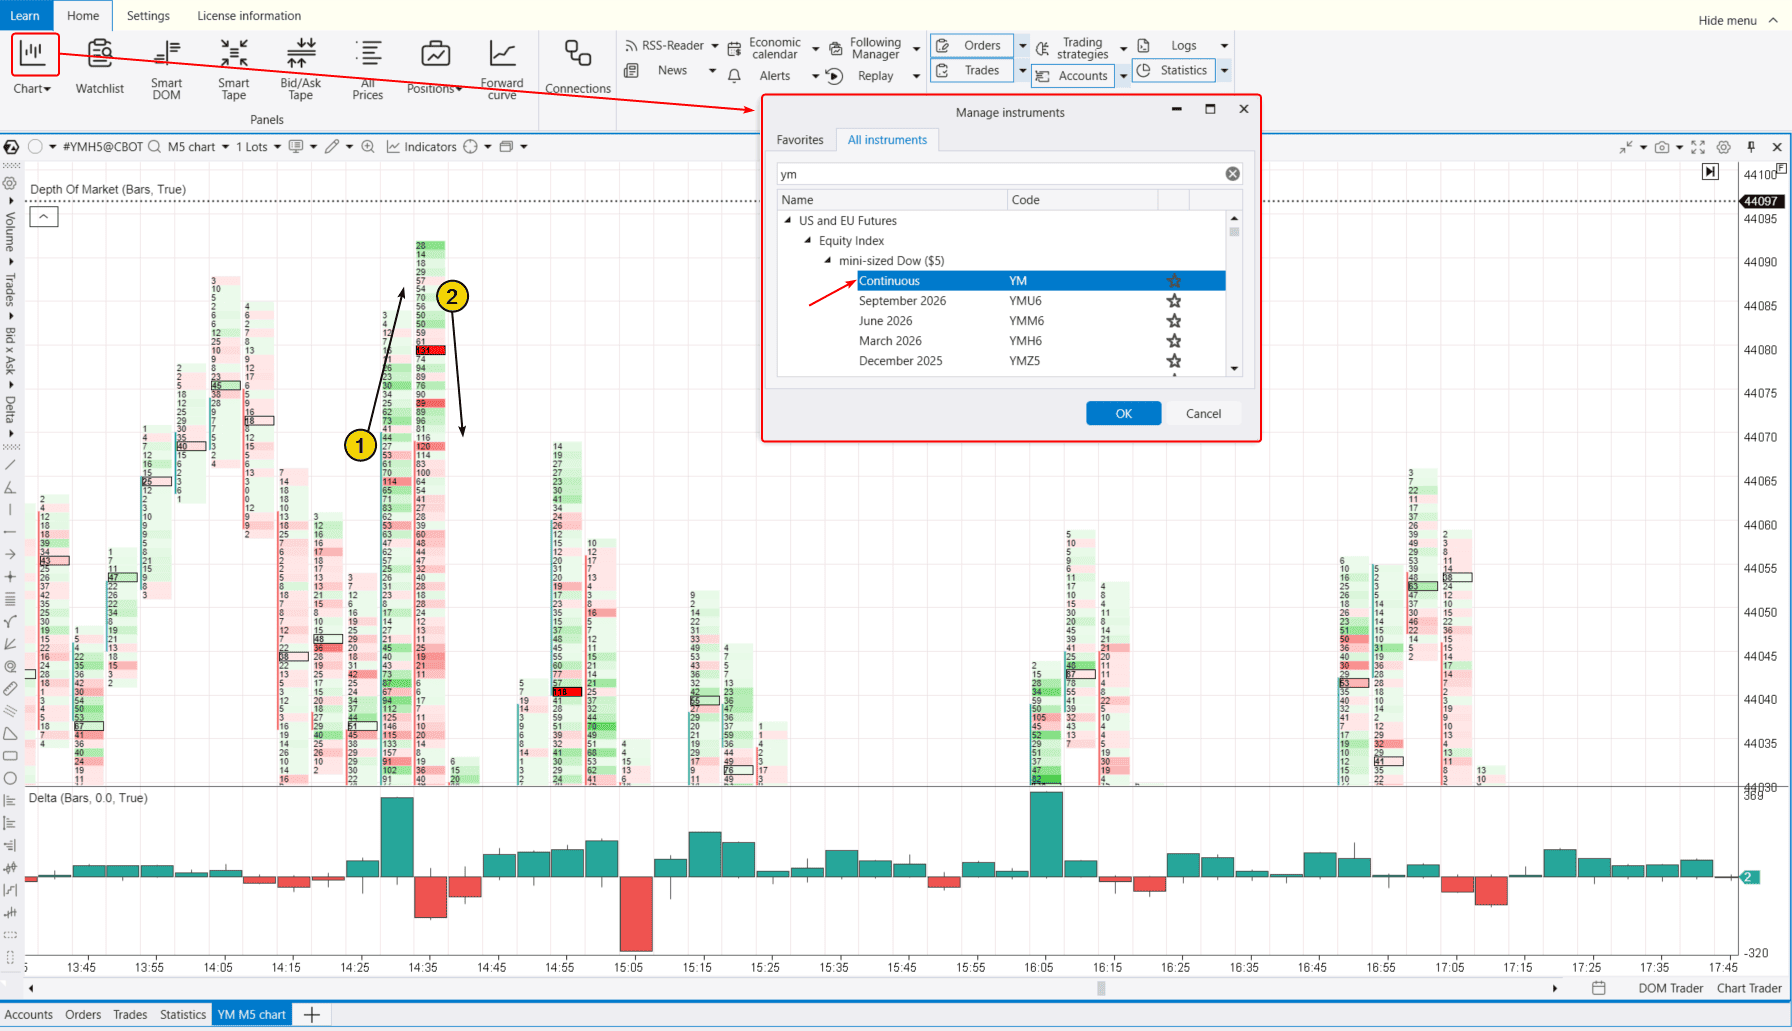
Set up the platform by following the instructions marked with arrows in the example below:
- Open a new chart.
- Choose the E-Mini Dow Continuous Contract – YM ticker.
- Switch the chart to footprint mode to analyze footprint patterns.
- Add professional indicators for volume analysis.
Example. The footprint chart below shows the intraday trading dynamics of the E-mini Dow futures.
The numbers show how the buying pressure (1), indicated by the green clusters at the market peak, shifted to active selling, which drove the futures price below the 44,070 level, turning it into resistance for the rest of the trading session.
You can spot similar patterns regularly. To practice, you can use the ATAS Market Replay simulator. This module of the ATAS platform recreates real trading conditions using historical data, enabling you to study the trading patterns of E-mini Dow futures (and other financial instruments) without any risk to real funds.
When practicing in the Market Replay simulator, you can:
- adjust the playback speed and pause;
- analyze footprint charts;
- use over 200 indicators;
- use Chart Trader and other features to trade on the Replay built-in demo account and then analyze your performance;
- use exit strategies.
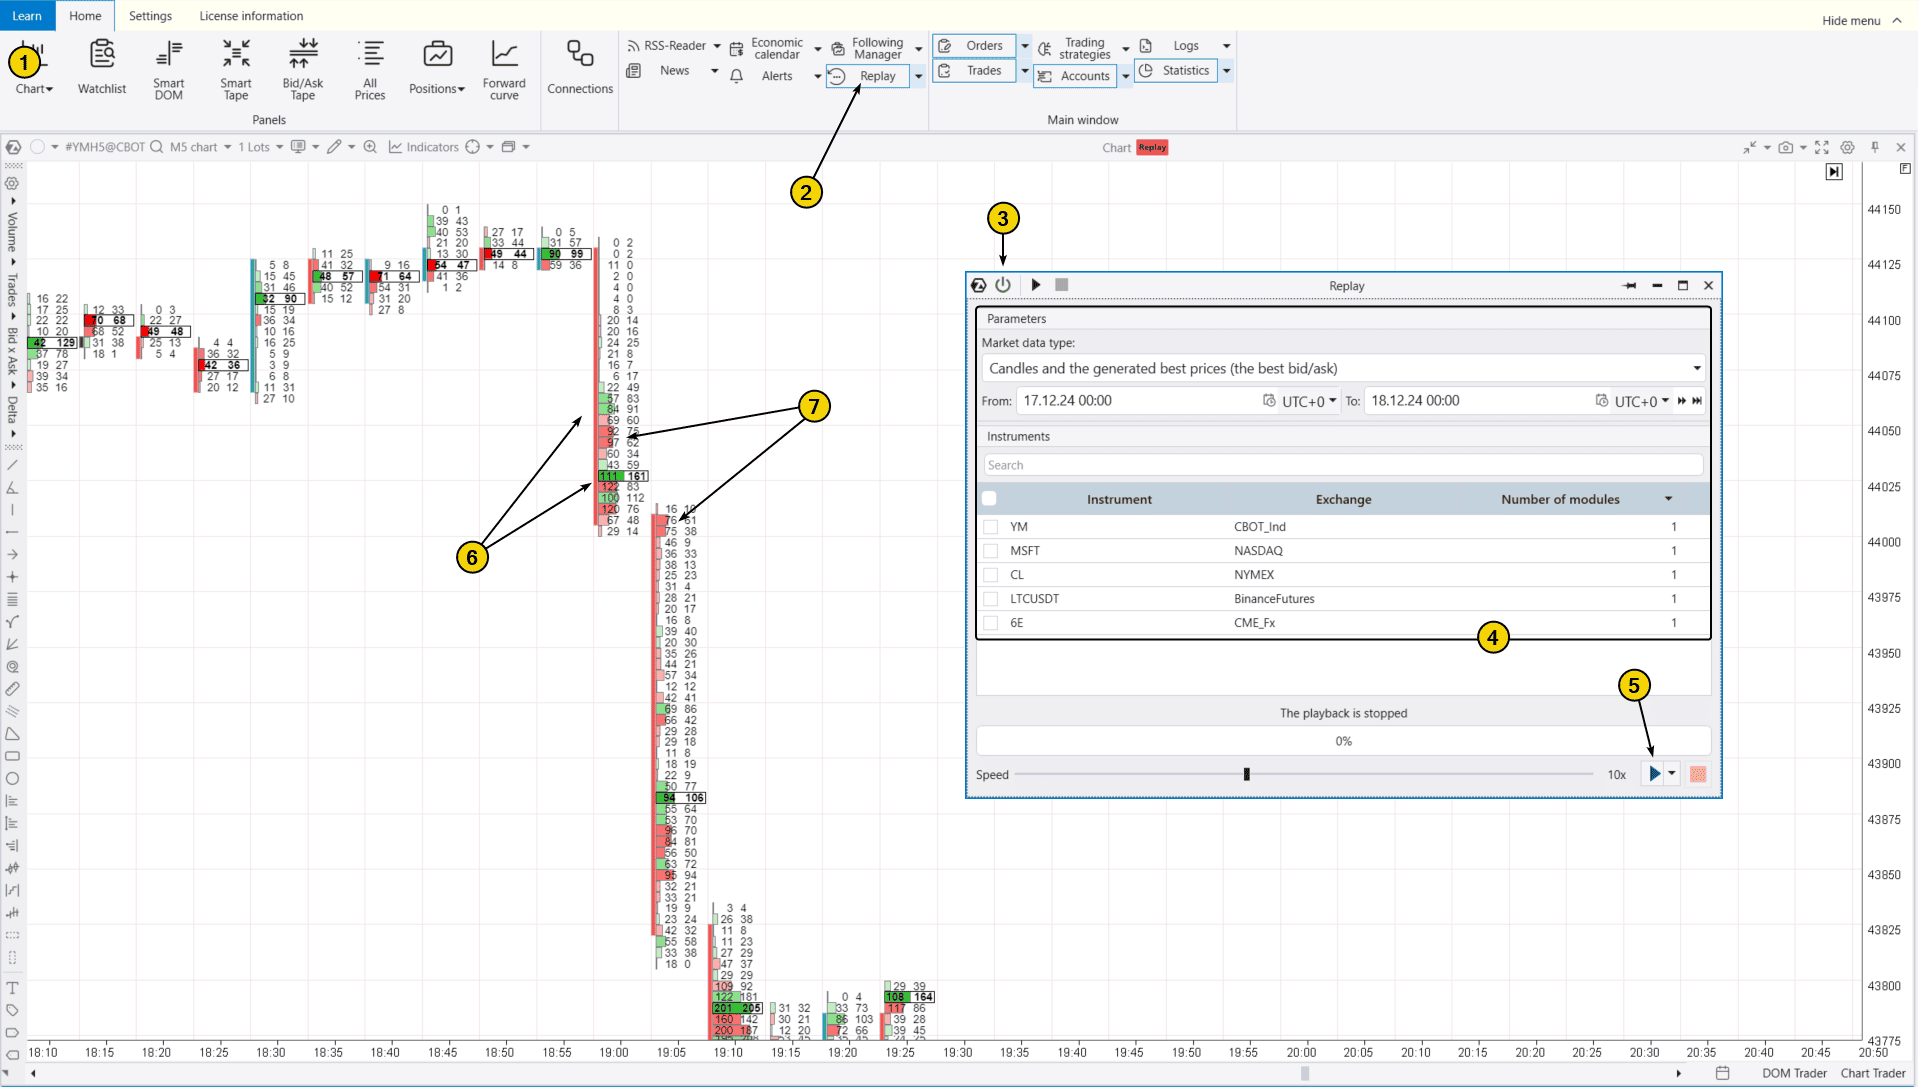
How to Launch Market Replay
To launch the simulator, download the ATAS platform for free, install, and launch it, and then:
- Open a chart of a financial instrument.
- Click on the Market Replay button in the main ATAS menu.
- Activate the Replay mode (the icon should turn green).
- Adjust settings (date and data type).
Start the replay and look for entry points using volume analysis tools. To open the trading panel, click on Chart Trader in the bottom-right corner.
Example. The chart above illustrates what happened after the Federal Reserve announced an interest rate cut. The E-mini Dow futures price dropped sharply, breaking through the key 44,000 level. Buyers tried (1) to support the price, but sellers (2) kept pushing it lower, which is visible in the green and red clusters.
FAQ
What does Dow mean?
Dow is the surname of Wall Street legend Charles Dow, who is considered the founder of technical analysis. He created the Dow Jones indices and started publishing the Wall Street Journal.
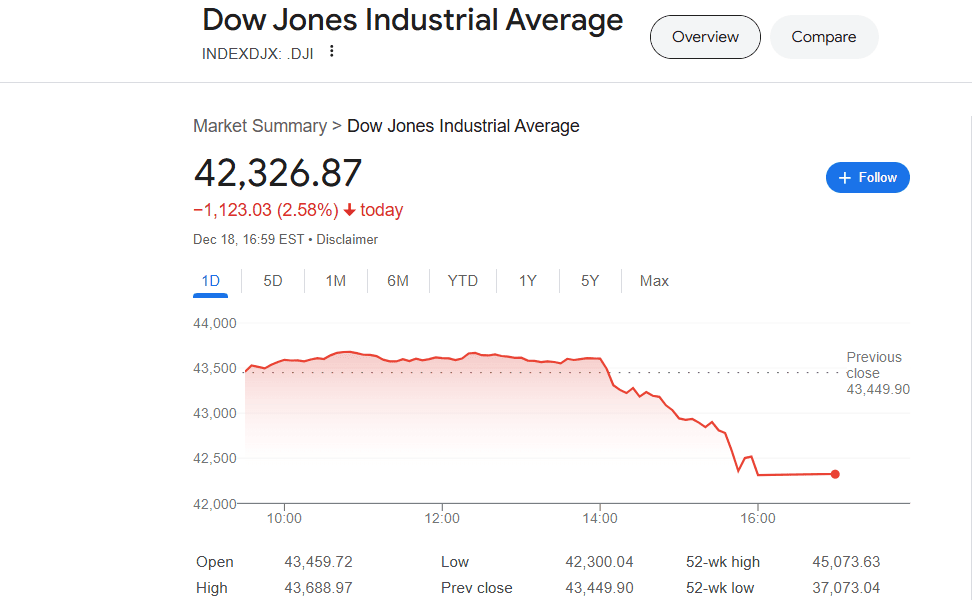
What is the current Dow Jones index?
You can find this information easily in a few ways. One of the quickest is to simply search on Google, where you will get the latest index value and an updated chart in the quick answers section.
You can also view the current Dow Jones value using futures market data on the ATAS platform. Moreover, you can use volume analysis tools, study price movements in detail, and access historical data.
How does the Dow differ from the S&P 500?
Unlike the Dow Jones, which is based on the stock prices of 30 companies, the S&P 500 includes 500 companies and is weighted by market capitalization. This makes it a more accurate reflection of the U.S. economy and is used more often by investors and analysts.
What are Dogs of the Dow?
The Dogs of the Dow are the ten stocks with the highest dividend yield.
Where is the Dow Jones Index traded?
The Dow Jones index futures are traded on an exchange within the CME Group.
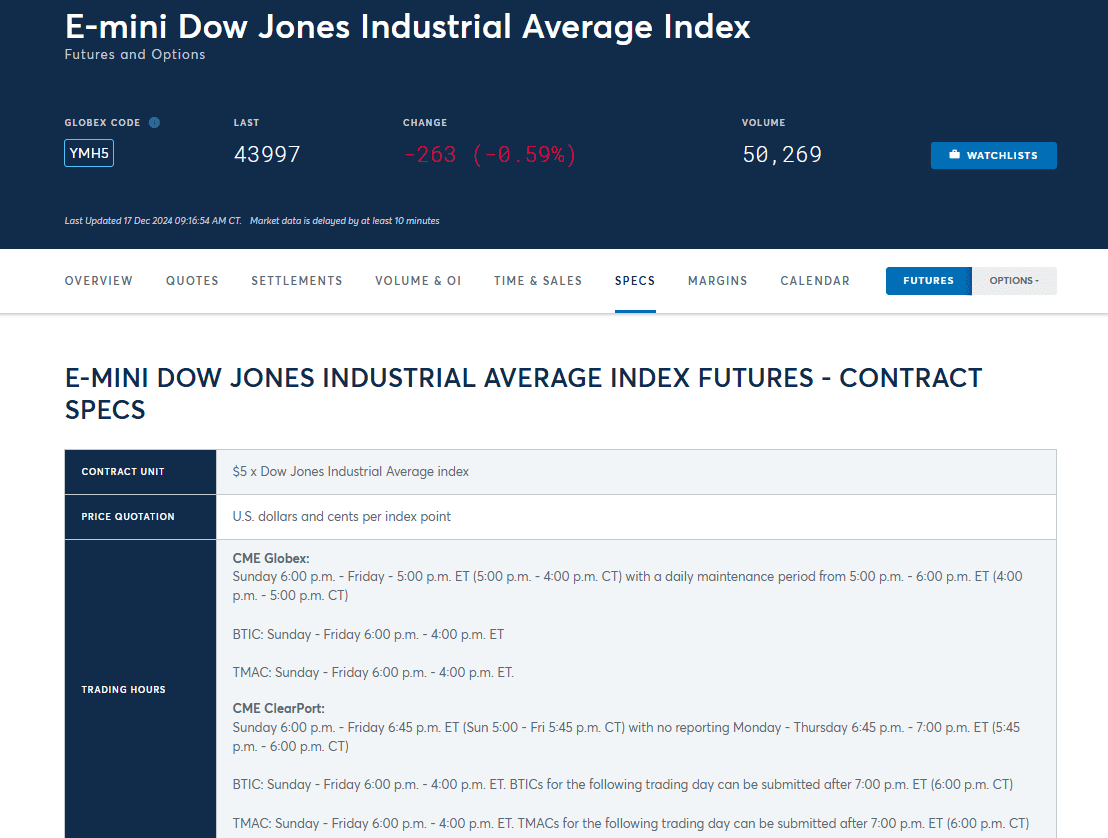
You can find all the detailed specifications for the Dow Jones futures contract on the CME Group website.
When can you trade the Dow Jones Index?
According to the exchange’s specifications, Dow Jones futures can be traded 24/5, with a brief pause around midnight.
How Much Do You Need to Start Trading Dow Jones Futures?
The required amount is quite reasonable, especially considering there are two types of contracts, as outlined on the AMP Futures broker page (you can connect the ATAS platform to this broker):
- E-mini Dow: To open an intraday position, your account with the broker must have at least $500*.
- Micro E-mini Dow. To open a position without holding it overnight, only $50 is required.
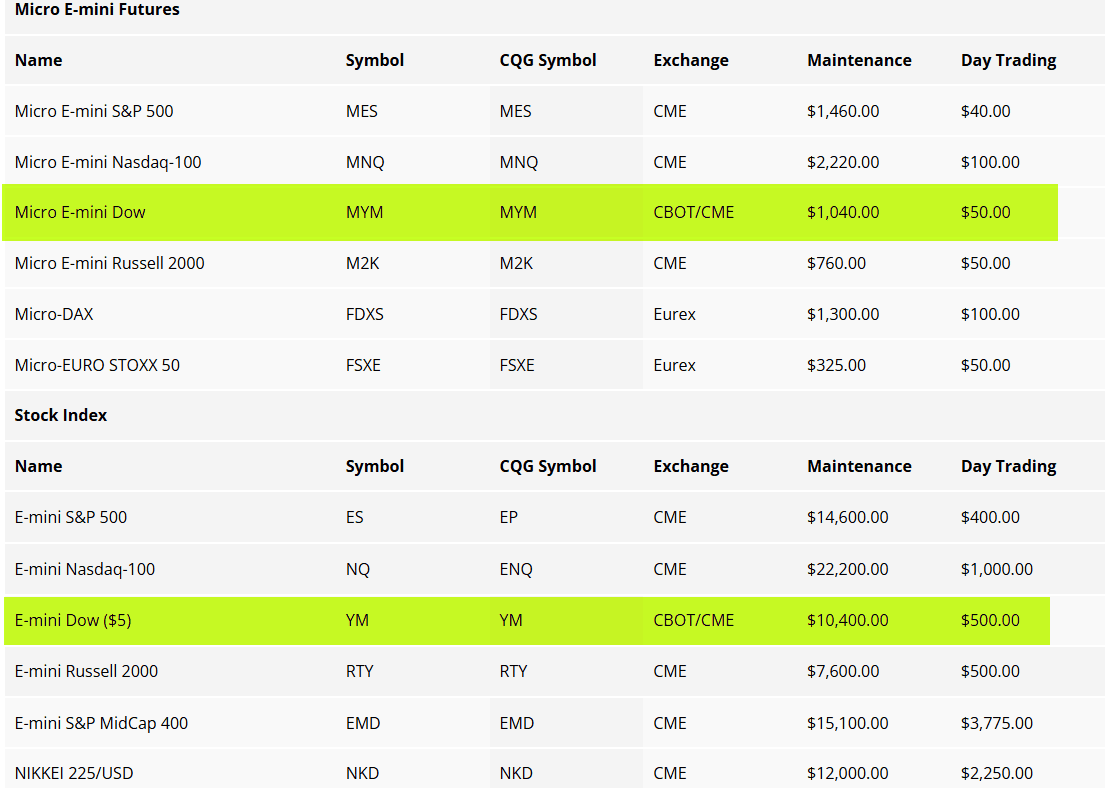
*The broker may change the terms of service for traders.
Conclusion
DJIA (Dow Jones Industrial Average) is one of the oldest and most well-known stock indices in the world, created in 1896.
Advantages of Dow Jones Analysis
✔ A time-tested index with over 100 years of history.
✔ Reflects the performance of the largest and most stable U.S. companies.
✔ Great for analyzing long-term market trends.
✔ Offers a futures contract with favorable conditions for intraday trading.
Disadvantages of Dow Jones Analysis
✘ Can be difficult to interpret. Knowledge of both technical and fundamental analysis is necessary to properly assess fluctuations in the index.
✘ Covers only 30 companies, which limits its representativeness.
✘ It is based on stock prices, without accounting for market capitalization.
You can trade Dow Jones Industrial Average futures using the ATAS platform, which offers professional volume analysis tools such as cluster charts, the Delta indicator, the market profile, and more to give you a trading advantage. Start exploring ATAS today to improve your trading strategies and use advanced volume analysis features.
Download ATAS. Once you install the platform, you will automatically get the free START plan, which includes cryptocurrency trading and basic features. You can use this plan for as long as you like before deciding to upgrade to a more advanced plan for additional ATAS tools. You can also activate the Free Trial at any time, giving you 14 days of full access to all the platform’s features. This trial allows you to explore the benefits of higher-tier plans and make a well-informed purchasing decision.
Do not miss the next article on our blog. Subscribe to our YouTube channel, follow us on Facebook, Instagram, Telegram or X, where we publish the latest ATAS news. Share life hacks and seek advice from other traders in the Telegram group @ATAS_Discussions or on Discord.
Information in this article cannot be perceived as a call for investing or buying/selling of any asset on the exchange. All situations, discussed in the article, are provided with the purpose of getting acquainted with the functionality and advantages of the ATAS platform.


