Swing trading is a method of trading on financial markets that involves holding positions for several days or even weeks. It aims to profit from expected swings – price fluctuations that form longer trends than intraday impulses. This usually happens in response to significant news events.
The concept of swing trading was introduced by George Douglas Taylor in his book The Taylor Trading Technique (1950). Taylor analyzed market trends by breaking down candle sequences into individual cycles. He described his “three-day cycle” theory, which identified buy and sell days and became the foundation of swing trading.
Swing trading does not guarantee profits, but it can enhance your experience in the financial markets if active intraday trading is not suitable for you.
Read more:
How Does Swing Trading Work?
In our article on the Six Types of Trading, we classified trading based on how long positions are held:
High-frequency trading (holding positions for fractions of a second).
- Scalping (holding positions for a few seconds to a few minutes).
- Intraday trading (holding positions for a few minutes to a few hours).
- Swing trading, or short-term trading (holding positions for a few days to a few weeks). The term swing refers to the market’s swings, or price movements, over this period.
- Medium-term trading (holding positions for a month to several years).
- Long-term investing (holding positions for many years).
Simply put, swing trading involves speculating on trends that last longer than a single day.
Swing trading can be applied to a variety of markets, including stocks, currencies, commodity futures, and cryptocurrencies. This trading style allows traders to select the most suitable market based on current conditions.
Special Features of Swing Trading
Swing trading offers a unique balance between trade frequency, commission costs, emotional stress, the number of instruments tracked, and the time spent on analysis.
However, it comes with more risk as it requires wider stop-losses to account for market volatility. Swing traders often need a larger initial deposit to hold positions overnight.
Who Should Consider Swing Trading?
Swing trading is ideal for those who want to actively participate in various markets without dedicating all their working hours to trading. Here are some categories of individuals for whom this type of trading is particularly suitable.
Busy professionals
Swing trading does not require constant market monitoring throughout the day, making it easy to combine with a primary job. For example, Dr. Alexander Elder successfully balanced his career as a psychologist with trading.
Beginner traders
Swing trading is less stressful compared to day trading and does not demand quick, high-stakes decisions. One can gradually learn the fundamentals of analysis and risk management, which makes it an optimal choice for those new to trading.
Investors
If you have long-term investments in cryptocurrencies but see signs of market weakness near a key resistance level, you might anticipate a correction in the coming days. Instead of selling your long-term positions, you can open a swing short position. This approach allows you to use your capital more efficiently compared to traditional long-term investing.
Fans of various analytical methods
Swing trading suits traders who enjoy combining technical analysis (such as chart patterns) with fundamental analysis (price reactions to significant news events).
Wondering if swing trading is right for you? Keep reading as we explore the pros and cons of swing trading and delve into some of the most effective strategies using examples.
Example of a Swing Trade
In swing trading, the main focus is on daily and 4-hour charts, though smaller timeframes can also be used to fine-tune entry points and gather additional confirmation.
Example of a swing trade in the futures market
Imagine a swing trader noticing a strong upward trend developing in late April and the first half of May on the E-mini S&P 500 futures market (highlighted using an arbitrary profile tool).

During this uptrend, two significant ledges form at 5245.00 and 5212.00 levels (marked by turquoise lines). The swing trader placed two buy-limit orders at those levels with stop-losses at 5233.50 and 5199.75 (marked by light brown lines), anticipating that the uptrend would continue after testing these high-volume levels.
As shown in the charts, prices often react to such levels. You can check this out yourself by downloading ATAS and analyzing historical data for futures, cryptocurrencies, or stocks.
Let’s go back to the example. Near the previous peak formed in late March, the upward trend slowed down, and fundamental news about the weak US labor market led to a subsequent price drop, triggering the execution of 2 buy orders:
- swing long trade №1 was closed at the stop loss (minus 46 ticks) the day after opening;
- swing long trade №2 may still be active (+650 ticks) to date, for instance, utilizing a trailing stop.
Example of a swing trade in cryptocurrencies
During a sudden price surge starting on February 26 in the Bitcoin market (as depicted in the profile spanning 8 days), 2 distinct ledges were formed (highlighted with turquoise lines).
A swing trader could have placed limit buy orders (with protective stops near the orange lines where the profile narrows), anticipating a price reversal upward if it dipped to these ledges.

The calculation turned out to be correct: in both cases, there was an upward reversal without triggering the stop losses (although for the second setup to work, the swing trader had to wait for 2 months – an eternity for a scalper).
Positions can be closed:
→ near significant resistance levels (horizontal or sloping);
→ using trailing;
→ based on mathematical criteria, such as setting a stop loss to ensure the potential reward outweighs the risk by 5-10 times;
→ using other methods.
What Tools Are Used in Swing Trading?
Reliable tools are a way to stay resilient in competitive markets, where your profit often comes at the expense of another trader’s loss.
Effective Tools:
- Market Profile. This tool enables traders to analyze trading volume distribution across different price levels, identifying key support and resistance levels. It helps determine major activity zones and market participants’ interest areas.
- Price Alerts. They ensure traders do not miss crucial entry or exit points, allowing them to focus on other tasks without constantly monitoring price movements.
- Vertical Volumes (Volume and Delta). They aid in assessing the market in terms of effort and result, helping to evaluate supply and demand balance.
- Footprint Charts. These charts offer detailed information about trades within each candle, including volume and direction at specific price levels. For example, daily timeframe footprints can be valuable for swing traders.
- Margin Levels. Margin zones often act as significant support and resistance levels.
- Non-standard chart types like range charts. They enable you to filter out market noise and focus on short-term trend changes.
- ZigZag Pro Indicator – it helps break down candle sequences into waves, including statistics for each wave.
- Wave Analysis. Elliott Wave principles and other wave analysis tools can be used on higher timeframes to determine the current market stage and potential direction of the next swing.
- Economic calendars.
Ineffective Tools:
Overly sensitive Order Flow Indicators
For example, DOM (Depth of Market) – this indicator shows the market depth and the volumes of buy and sell orders at different price levels. While highly useful for scalpers, it is less effective for swing trading since it reflects immediate market activity that changes rapidly.
Indicators reflecting activity in the DOM can help a swing trader find a more precise entry point (thus reducing risks), but they are unlikely to change the trader’s perspective on the market over several days or weeks.
Moving averages (MA) for swing trading
Tools such as moving averages and oscillators have questionable effectiveness and cannot be recommended as reliable aids for making trading decisions. Research shows that their predictive power is often limited.
For example, a study published in the “Journal of Risk and Financial Management” concludes that trading rules based on MACD and RSI indicators do not always effectively predict price movements across various markets. This data confirms that technical indicators can be useful in certain market conditions, but they often provide false signals.
Swing Trading: Types of Strategies
Let’s break down the strategies used by swing traders into two main categories:
- Trend trading.
- Counter-trend trading (trading against the trend).
Swing Trend Trading
Trend trading involves buying assets during an uptrend and selling during a downtrend. We will not get into the specifics of identifying trends here, as that topic is covered in another article.
For entering a position, swing traders typically use two scenarios:
- Breakout entry. Buying when the price breaks above resistance in an uptrend or shorting when the price breaks below support in a downtrend.
- Pullback entry. Buying during a temporary price drop in an uptrend or shorting during a temporary price rise in a downtrend.
Breakout Trading
Breakout trading is based on the idea that after a breakout, the price will continue moving in the same direction, offering a chance to profit if the trend persists.
Example. Bitcoin and ETF approval
The anticipation of SEC approval for a Bitcoin ETF significantly influenced the BTC/USD uptrend at the end of 2023. The official decision was made on January 11, during a period of extreme market volatility (circled #1 on the daily footprint chart below), with the price surpassing $49,000 per coin.
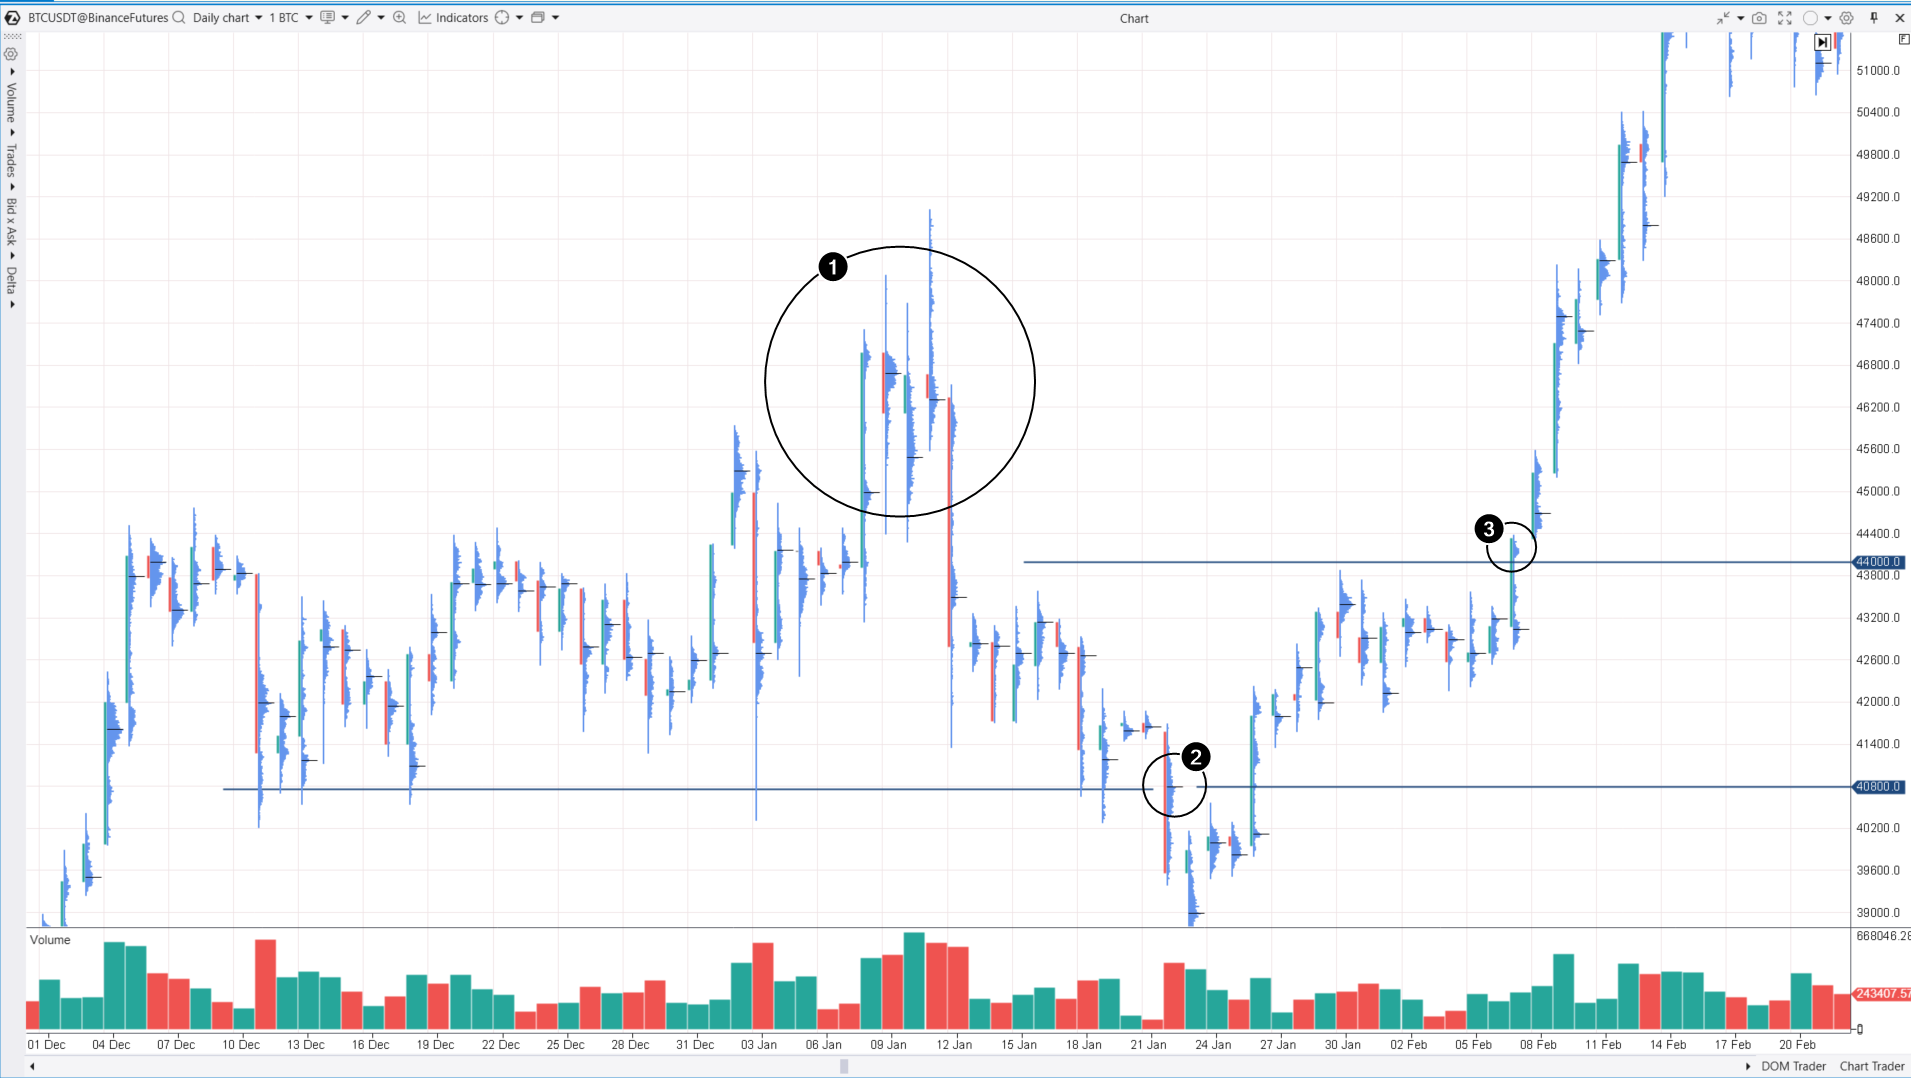
Following the approval, the market experienced a “buy the rumor, sell the news” effect, leading to a price drop below the $40,800 level, which had previously acted as support.
In this situation, a swing trader might have expected the uptrend to resume after the initial cooling-off period, considering that ETFs make Bitcoin more accessible to a wider audience, including institutional investors.
Let’s focus on two setups that a swing trader can use following the breakout buying method:
- the buy-stop order is slightly above 40,800 – this level can be seen as crucial, where bears had exerted significant effort to break through (indicated by volume on the footprint chart – number 2).
- the buy-stop order is slightly Above 44,000 – this level appeared as resistance, but on February 8, the balance between buyers and sellers settled above it (indicated by volume on the footprint chart – number 3), suggesting a shortage of sellers and the continuation of the uptrend.
Example. Gold price and the attack on Israel
At the end of September 2023, the gold market was in a downtrend, with the price dropping from 1950 to 1833. The profile covering this period of decline shows a bulge around the 1833 level (1), indicating a strengthening balance between supply and demand. It seems gold at 1833 attracted buyers due to:
- high inflation prevalent in Western countries in 2023;
- demand for gold from central banks, particularly the People’s Bank of China.
The ledges on the profile (marked by numbers) could indicate resistance levels the price might face when attempting to rise from the balance zone (1).
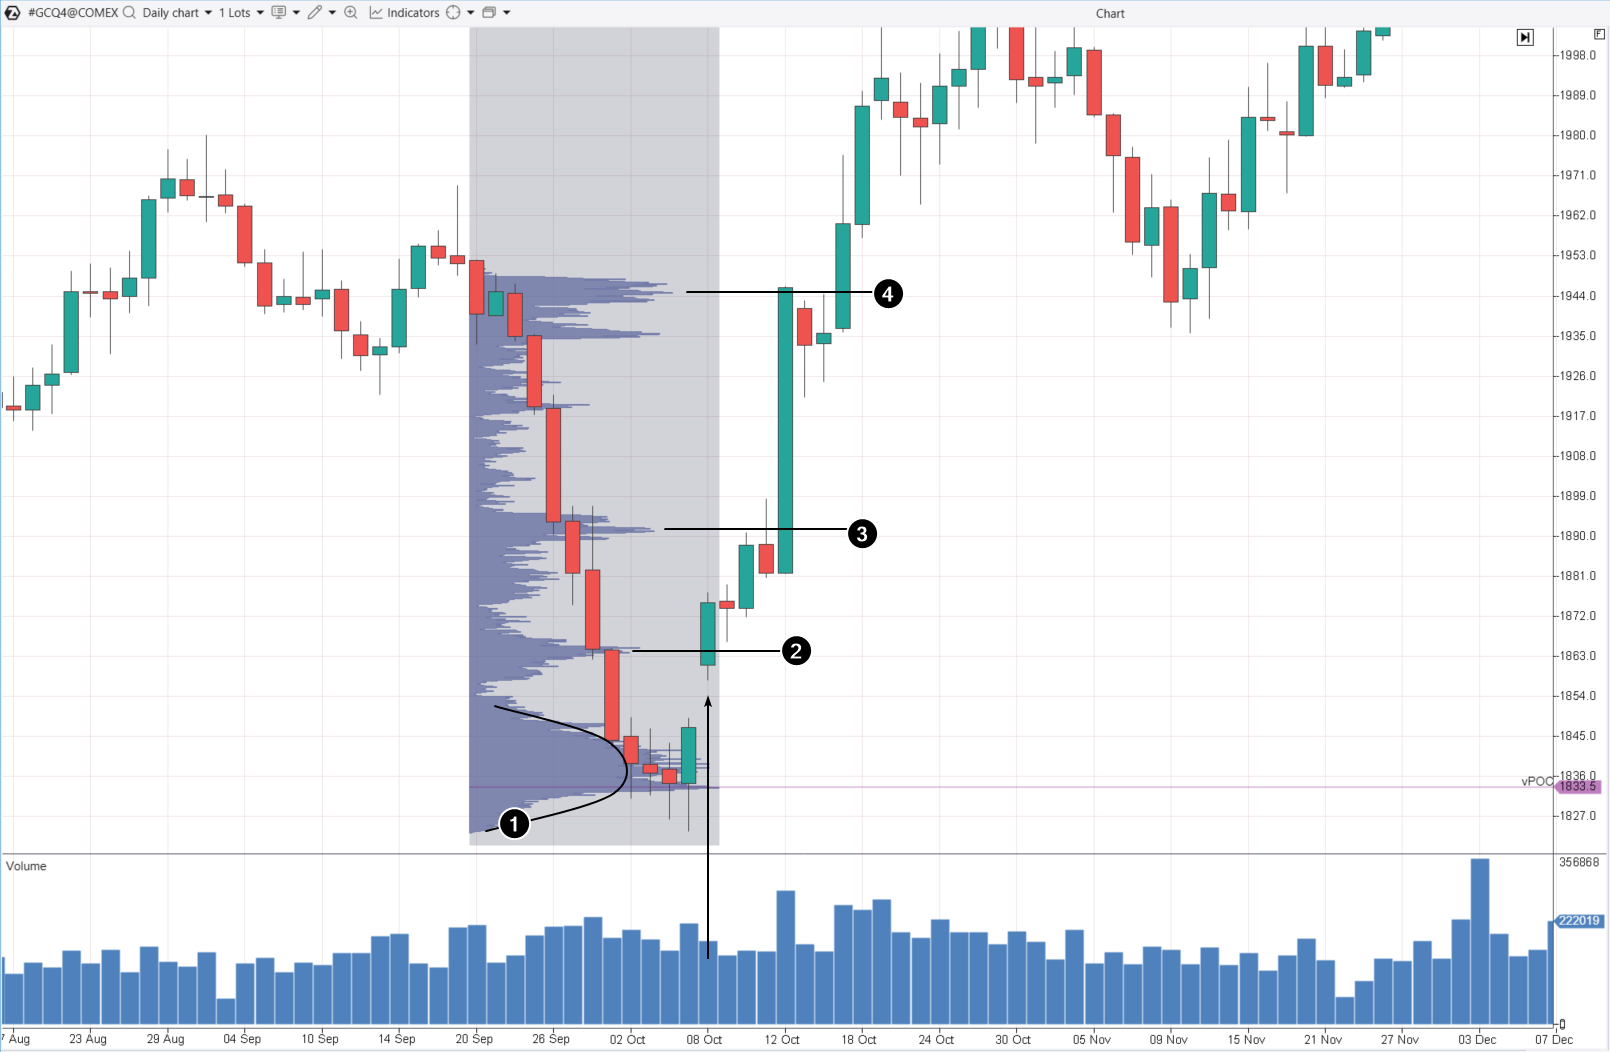
However, on October 7, 2023, there was an attack on Israel by Hamas. On the 8th, gold trading opened with a significant bullish gap (indicated by the arrow), surpassing the resistance level (2) around the $1863 per ounce mark. A swing trader could have:
- speculated that the increase in geopolitical tensions (in addition to the factors mentioned above) would act as a major driver;
- bought gold above the $1863 resistance, anticipating that the price would not drop below the gap area;
- continued purchasing on breakouts above resistance levels 3 and 4.
As events unfolded, the price of gold surged to a historical high.
Example from the MSFT stock market. As the long-term trend indicates, the value of one of the market’s leading capitalization leaders continues to rise year after year. A swing trader can leverage this momentum by buying MSFT stock at the onset of an anticipated uptrend swing.
The daily footprint chart shows what it can look like:
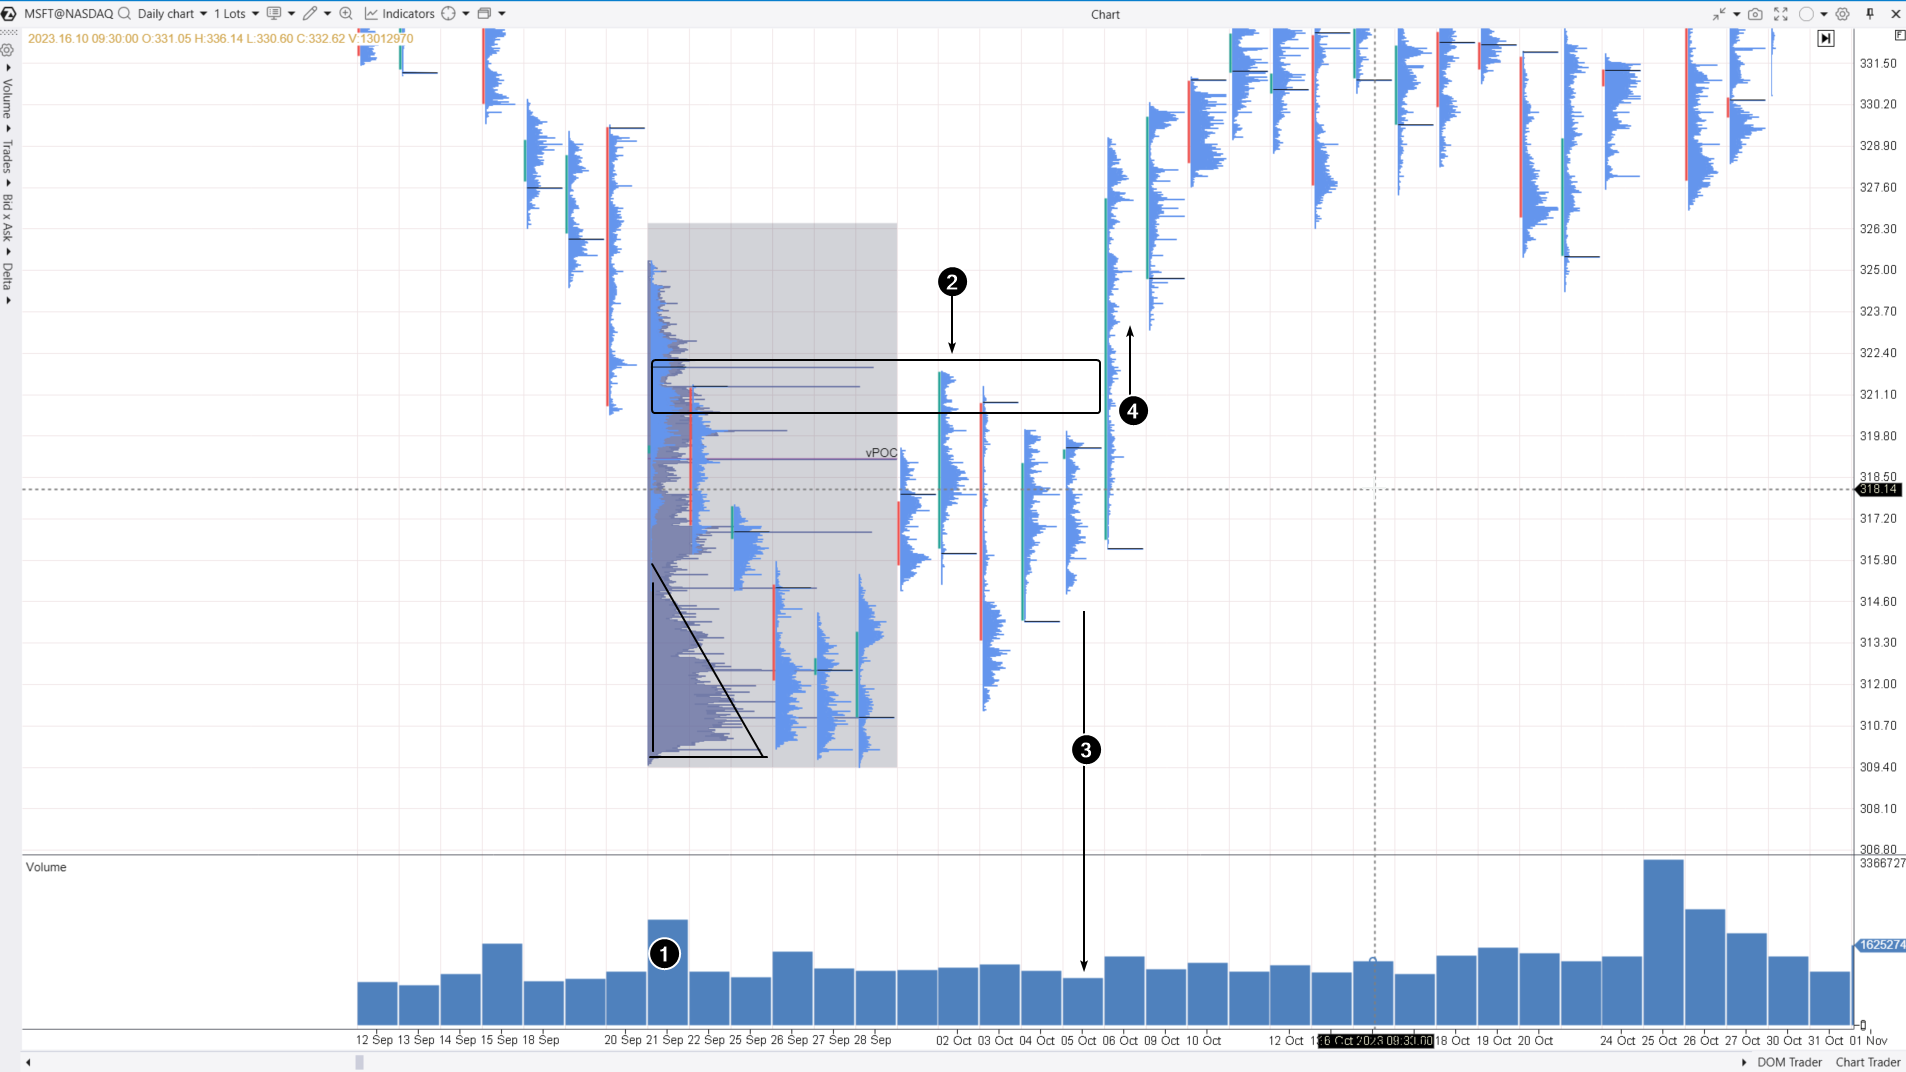
Numbers indicate:
- A decline (1) on high volume. It occurred after the Federal Reserve’s September meeting, where they decided to keep interest rates unchanged and signaled that they would maintain high rates longer than Wall Street expected to combat inflation.
- The downward-expanding triangle (shown with black lines) indicates the presence of a limit buyer in the market, who preferred to accumulate fundamentally strong stocks from September 26-28, preventing them from falling below $310.
- The upward movement with a test (2) of high-volume levels from September 21-22 confirmed the buyer’s activity, and the subsequent decline on October 3 failed to establish a new low.
- (3) – an inside bar, indicating market indecision.
- (4) – a bullish breakout of the resistance zone (2), which a swing trader could use to enter a long position, expecting the balance of supply and demand to have shifted upwards and the price to stay above the inside bar. Footprint signals provided the confidence to buy on the breakout.
Pullback Trading
In this approach, a swing trader needs to consider the current trend and enter a trade after a pullback in the direction of that trend.
We have already discussed two examples of buying on a pullback to a high-volume level. Now, let’s delve into another scenario involving opening a short position.
Example. Silver market, daily timeframe. Cluster chart reflecting the events of the first half of 2024.
During this period, a swing trader might have noticed the breakout of the psychological level of $30 per ounce of silver and the establishment of a multi-month high.

What happened next?
Fact 1. Formation of a bulge on the profile above the $31.50 level.
Fact 2. Formation of a series of lower highs and lower lows, noticeable with the ZigZag Pro indicator.
Fact 3. The price drop to the June 3 low had higher volume and more ticks than the rise to the May 28 high, indicating that sellers were gaining control amidst weak demand (more details in the Weiss Waves article).
Thus, testing the high-volume level around $31.5 per ounce of silver was a reasonable move for a swing trader, anticipating that the price would not sustain at the multi-month high and would experience a notable decline over the coming days or even weeks.
Swing Failure Pattern
The Swing Failure Pattern (SFP) trading method is commonly found online and can also be applied to trend-based swing trading. This method (credited to Tom Dante) involves:
- Buying after a false bearish breakout below the previous swing low in an uptrend;
- Selling after a false bullish breakout above the previous swing high in a downtrend.
Example. Euro futures market, 4-hour chart
The market profile indicates a shift in supply and demand balance with the price decline from point A to point B. This could be attributed to the start of a new year (or low liquidity and susceptibility to manipulation during the Christmas period). The formation of peak (1) around the 1.102 level signaled that the market was not ready to move higher. The false breakout of peak (1), forming a slightly higher peak (2), represents the Swing Failure Pattern, indicating an unsuccessful attempt at a new uptrend.
This price action suggests the potential for further decline, which was initiated by the A to B impulse.
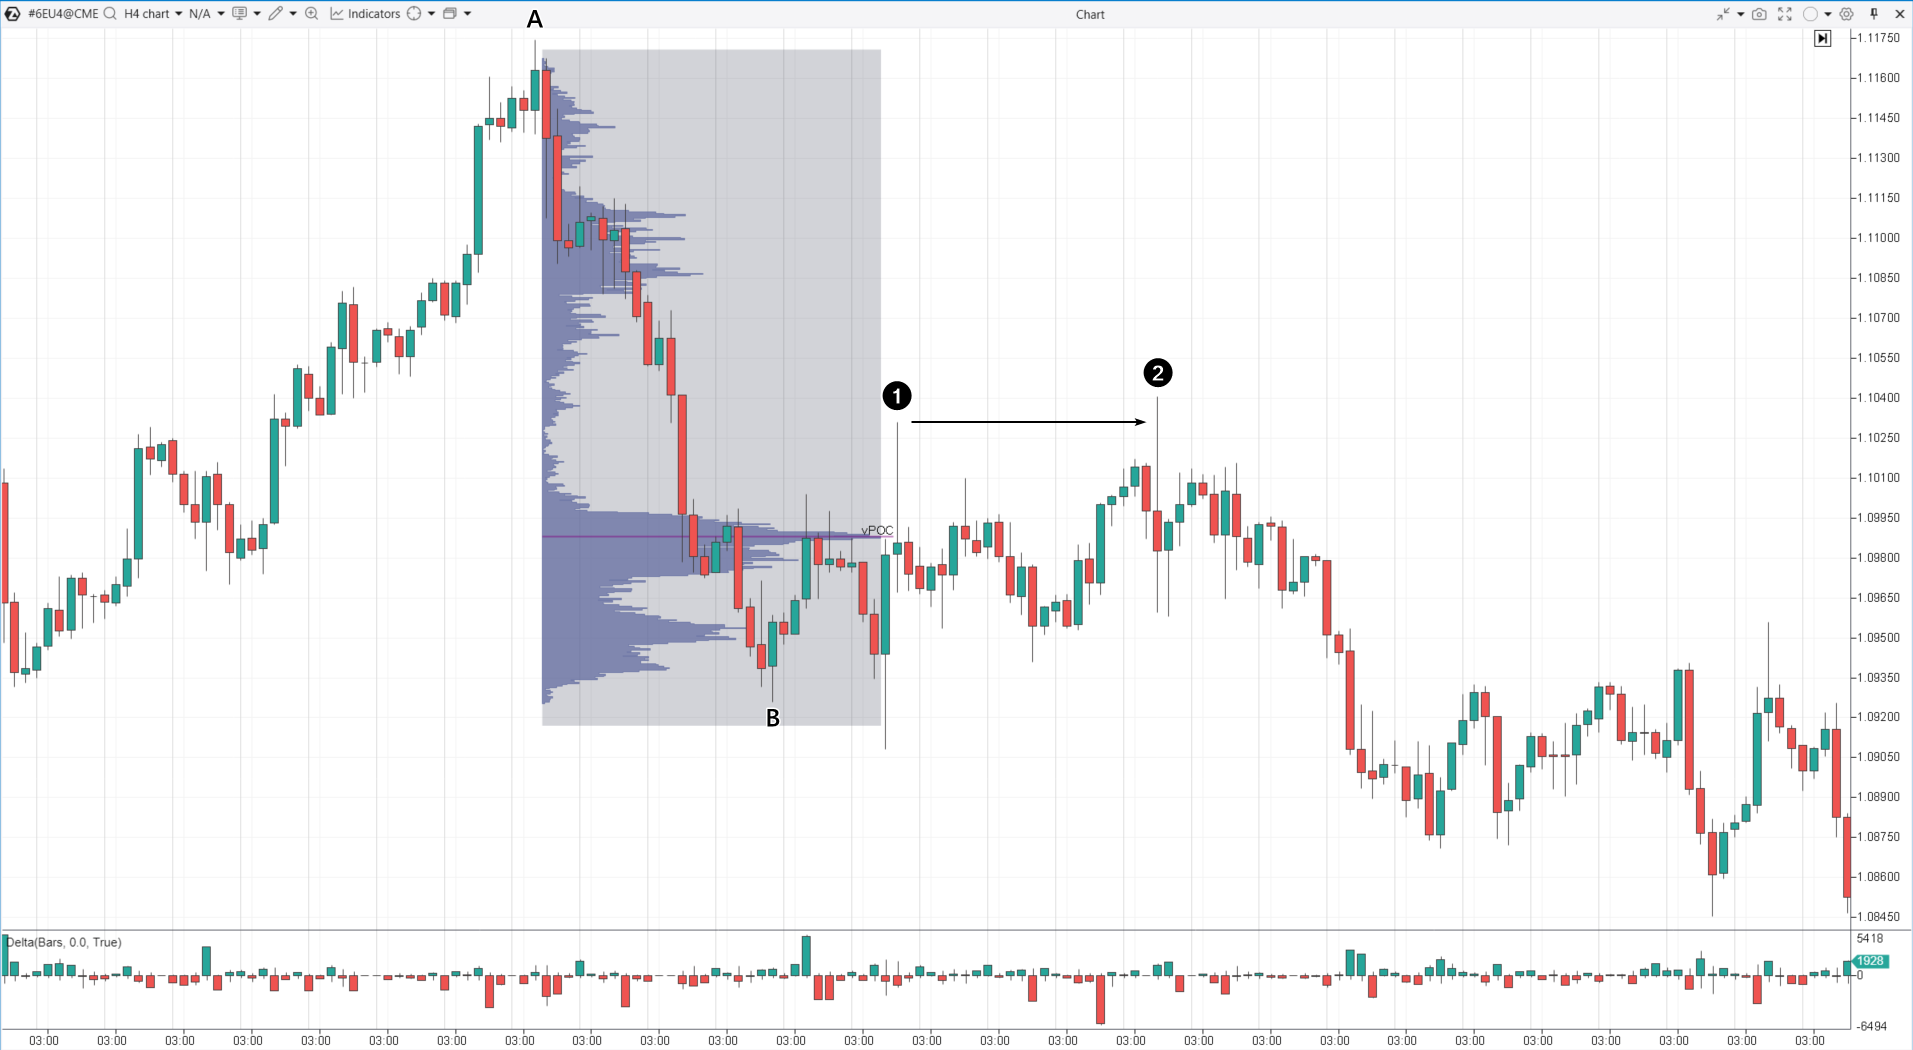
In simple terms, to sell based on the Swing Failure Pattern (SFP), you should:
- Wait for a strong bearish impulse;
- Observe the formation of an intermediate peak (the first pullback);
- Enter a short position after a false bullish breakout above the peak of the first pullback. If the breakout above the initial peak is brief, it confirms the SFP.
This false breakout is often designed to mislead market participants into thinking the price will go up. Buyers rush to enter long positions, and sellers close their shorts with stop-losses. Ultimately, both are disappointed when the market does not move as expected.
The opposite scenario can be seen in the daily chart of BNB/USDT:
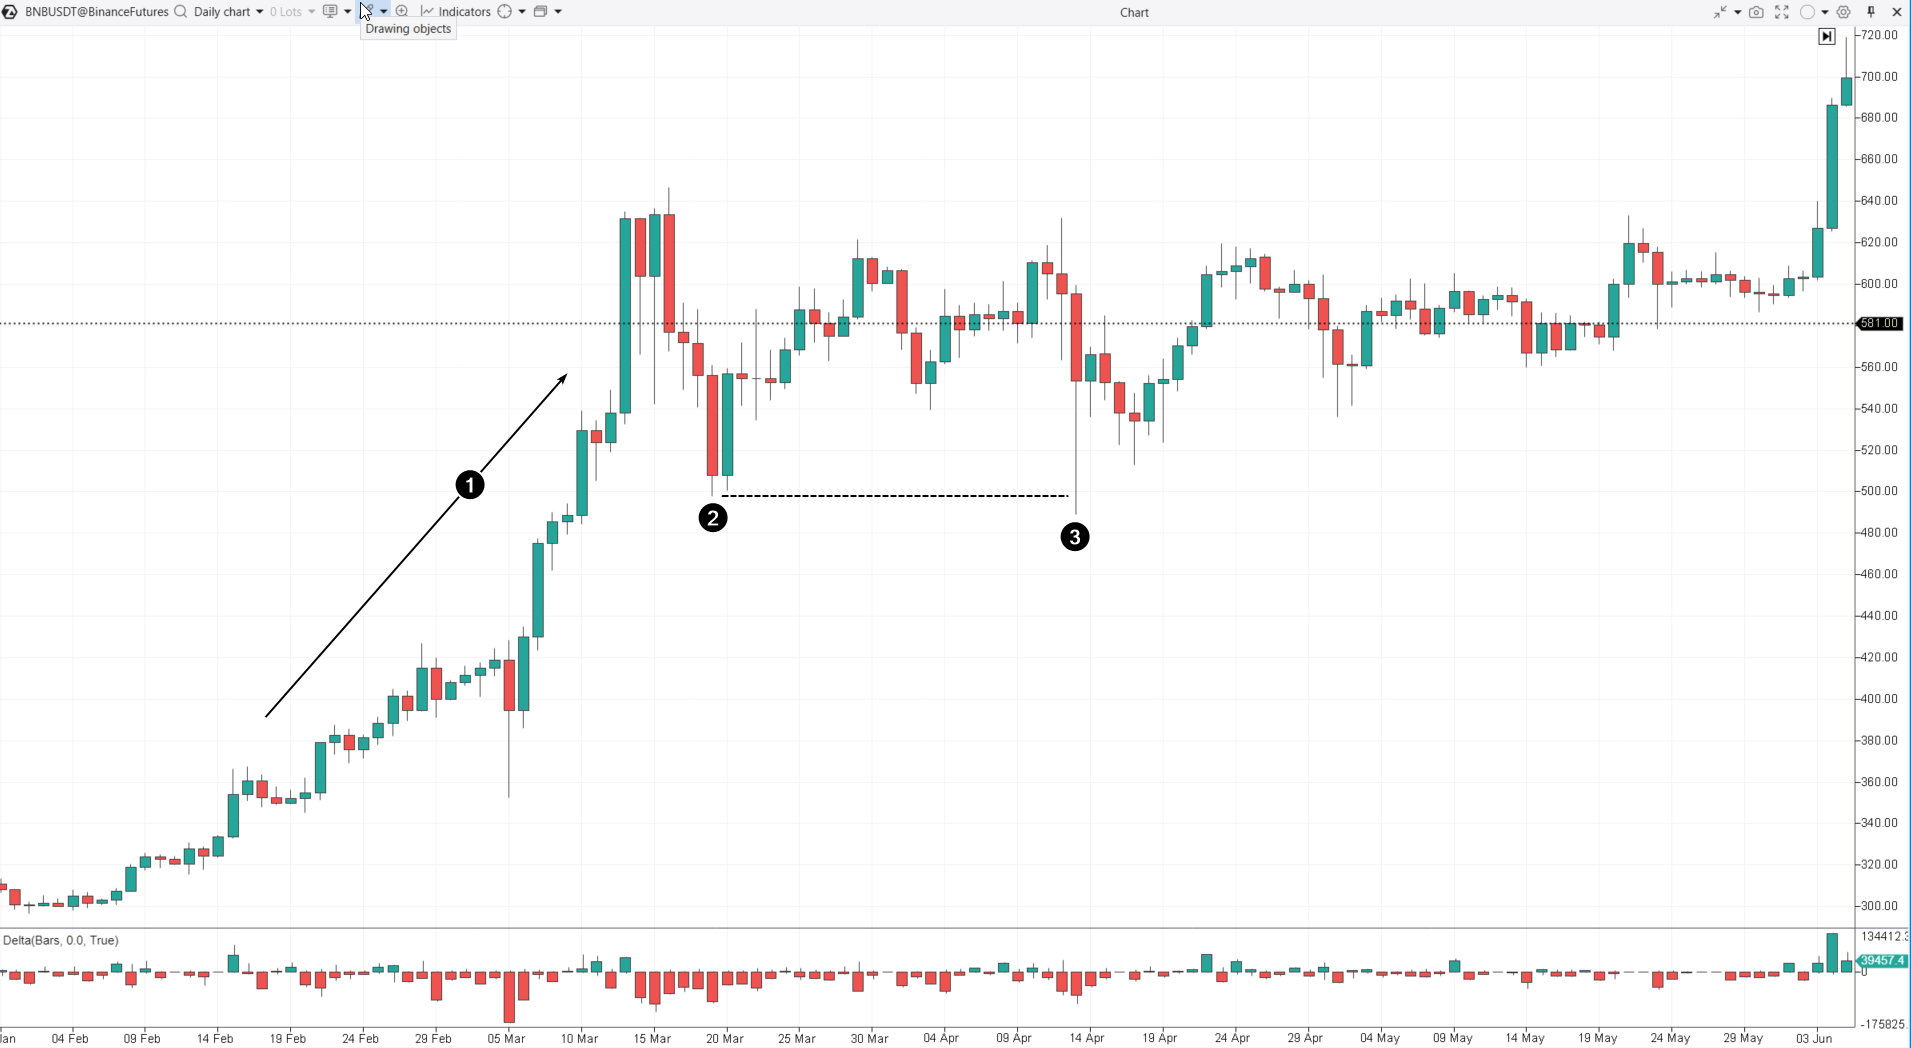
Numbers indicate:
- Uptrend.
- Intermediate low.
- False breakout of the previous low and a signal to enter a long position.
In the highly volatile cryptocurrency market, a false breakout can occur within seconds, giving swing traders only a brief window to enter using a limit order. Despite this, the Swing Failure Pattern is a reliable strategy not just for cryptocurrencies, but for other markets as well, offering a high potential reward-to-risk ratio.
Trend Reversal Trading
Trend reversal trading focuses on spotting and taking advantage of moments that signal a change in the primary market direction. This can happen when:
- the factors driving the main trend lose momentum (the trend fades);
- new factors emerge, initiating a new trend in the opposite direction of the previous main trend.
Example. E-mini Nasdaq 100 (NQ) futures market
A daily footprint chart in the screenshot shows:
- Until mid-April 2024, the price moved within the channel 1-2.
- On April 11, there was a bearish breakout of the lower boundary (2) and a drop to the parallel channel boundary (3).
How to combine swing trading and parallel channel strategy? Check out the ideas in this article.
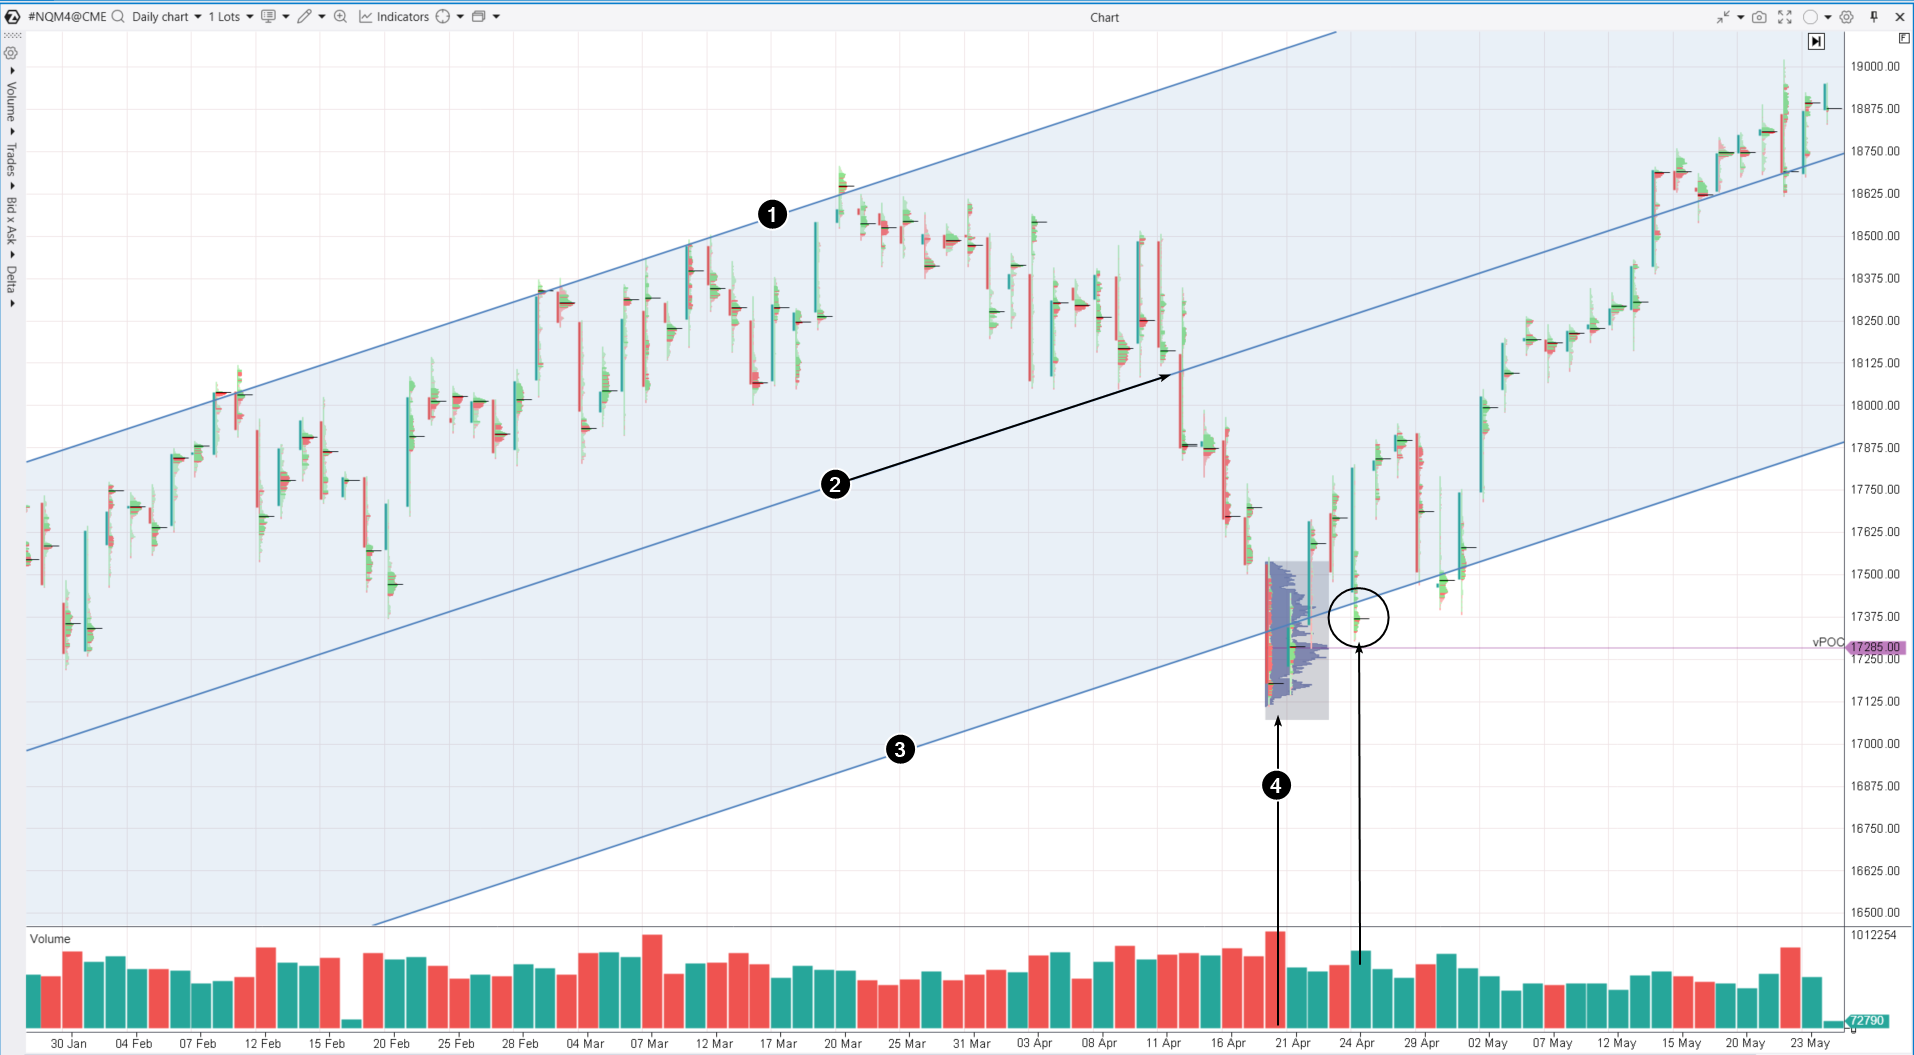
The arrow marked with the number 4 highlights a day (Friday, April 19) with exceptionally high volume, likely indicating a panic and a selling climax with the Point of Control (POC) = 17285. Notably, the following week opened with a bullish gap, and the price moved above this POC, confirming the selling climax as a bullish signal.
A swing trader might have interpreted the volume spike and subsequent 2-day rally as an indication that a significant player anticipated further price increases. Therefore, the price drop on April 24, forming a bulge (shown with a circle), could be seen as an opportunity to go long:
- this approach can be considered trading against the trend since many indicators pointed to a downtrend in the market since late March;
- the expectation would be that the price would not fall below the Monday gap and the POC level from Friday, April 19.
Example. Pound futures, 4-hour chart
The arrow marked with the number 1 indicates an active price increase. This rise likely attracted retail buyers who opened long positions and placed stop-loss orders below the wave’s low.
A savvy swing trader could have set an alert for a potential price drop to this level. This drop (2) occurred on June 7, 2024, following news about the U.S. labor market.
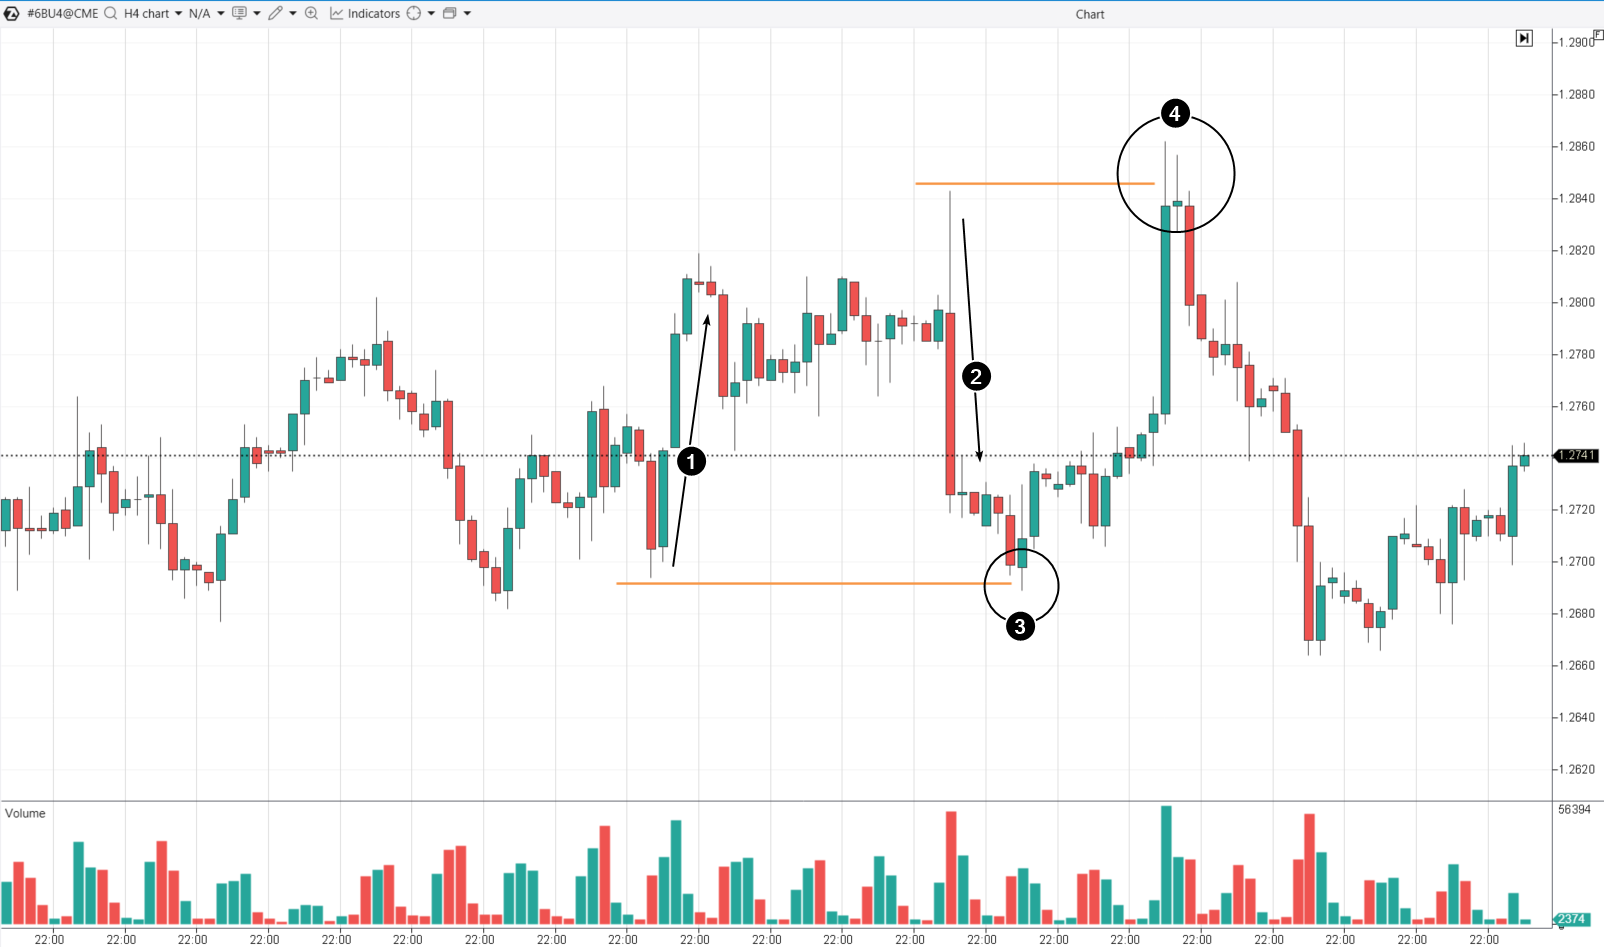
The circle marked with the number 3 indicates a false breakout of the previous local low. How could a swing trader interpret this? The activation of retail buyers’ stop-losses and the accumulation of long positions by professionals. A swing trader could then open their trading platform and establish a long position at the previous low, expecting the breakout to be false. Naturally, they would set a stop-loss and take-profit with a favorable risk-reward ratio.
On June 12, the opposite situation occurred: the price surpassed (4) the previous local maximum, from which a sharp decline began. A swing trader’s reasoning would have been the same but in a mirrored perspective:
- “the price triggered the stop-losses of sellers who had short positions during the decline (2)”;
- “a professional is working on establishing a short position using the stop-loss orders of retail sellers”;
- “I am also opening a short position, anticipating that the peak breakout will prove to be false.”
This kind of strategy for swing trading against the trend can be risky for newcomers; however, it offers an appealing risk-reward ratio, making it practical. This approach is effective for those with the personal qualities needed to handle a high level of risk.
More ideas on the topic can be found in the following articles:
Pros and Cons of Swing Trading
Swing trading attracts traders with the potential to profit from holding positions for several days, but not everyone finds success. Short-term trading has its nuances, and success often hinges on how adeptly traders combine fundamental types of analysis, their psychological attributes, and risk management skills. Personal preferences also play a significant role: some traders thrive on dynamic position changes, while others prefer longer-term investment strategies.
Pros of Swing Trading
Reasonable time commitment. It requires less time for analysis and position monitoring compared to day trading. Traders can dedicate a few hours per week to the market, making it possible to combine swing trading with their primary job.
Moderate volatility. Swing trading does not require reacting to every instant market change, unlike day trading.
Potential for significant profits. Trends can persist longer than expected, allowing for substantial profits through short-term trends and market fluctuations.
Flexibility in choosing instruments. It is suitable for trading various financial instruments, including stocks, currencies, futures, and cryptocurrencies.
Diverse strategies. The ability to use different trading strategies such as breakout, pullback, and trend trading, allows for adaptation to different market conditions.
Transaction costs. While transaction fees and costs do not heavily impact the final result in swing trading, they should still be considered when planning a strategy.
Cons of Swing Trading
High starting capital requirements. They are related to wider stop losses that prevent the position from closing due to insignificant price movements in terms of swing trading. Additionally, the increased capital demands may necessitate holding positions overnight.
Gap risk. Holding positions overnight or for several days (weeks) carries the risk of unexpected price gaps due to unforeseen news events.
Forecasting requirement. Swing trading requires the ability to comprehensively analyze the market: taking into account fundamental background and technical analysis. Errors in judgment can lead to losses.
Psychological pressure. Swing trading is considered to involve less emotional pressure than active day trading. However, stress can arise from holding a position for an extended period, especially during periods of high volatility and/or anxiety when holding positions overnight.
Continuous learning requirement. It requires constant updating of knowledge and skills, as well as adaptation to market changes.
Day Trading or Swing Trading?
You can combine both styles: for instance, swing trading in less volatile stock markets and active day trading in cryptocurrencies.
| Day Trading | Swing Trading | |
| Profit Potential | Excessively high. Profiting from small fluctuations during the day | High. Profiting from swings |
| Duration of Trades | Trades close within one trading day | From several days to several weeks |
| Time Commitment | Requires full attention during the trading day | Allows for flexibility with other activities |
| Risk | High risk due to frequent trades and market volatility | Relatively lower risk due to comprehensive analysis |
| Psychological Pressure | High due to quick decision-making demands | Lower, allowing more time for thoughtful decisions |
| Chart Analysis | Swift response to sensitive indicators | In-depth analysis of trends and patterns |
FAQ
What does Swing mean in trading?
Swing in trading refers to short-term movement (fluctuation, trend, wave) that lasts from several days to several weeks at most.
As swing trading profitable?
Yes. Like any strategy, swing trading can be profitable if risks are managed correctly and the market is analyzed.
Is swing trading legal?
Yes.
Is swing trading suitable for beginners?
Swing trading can be suitable for beginners if they are willing to invest time in learning analysis. It is important to develop a trading plan, start with a small capital or on a demo account to minimize potential losses.
How much money is needed to become a swing trader?
For swing trading with futures, it is recommended to have at least a few thousand dollars to cover margin requirements for overnight positions and risk management. For starting swing trading with cryptocurrencies, a couple of hundred dollars might suffice, although small positions are unlikely to yield significant profits.
Is it possible to do swing trading without indicators?
Indicator-free swing trading relies on analyzing price patterns and support/resistance levels without the use of technical indicators. In this approach, cluster charts can be highly beneficial if you know how to interpret them.
What timeframe is best for swing trading?
The most suitable timeframes for swing trading are typically daily charts (D1), although some traders also utilize 4-hour (H4) and weekly (W1) charts. It is advisable to consider non-standard chart types that do not consider time and offer better visibility of swing movements.
Example:
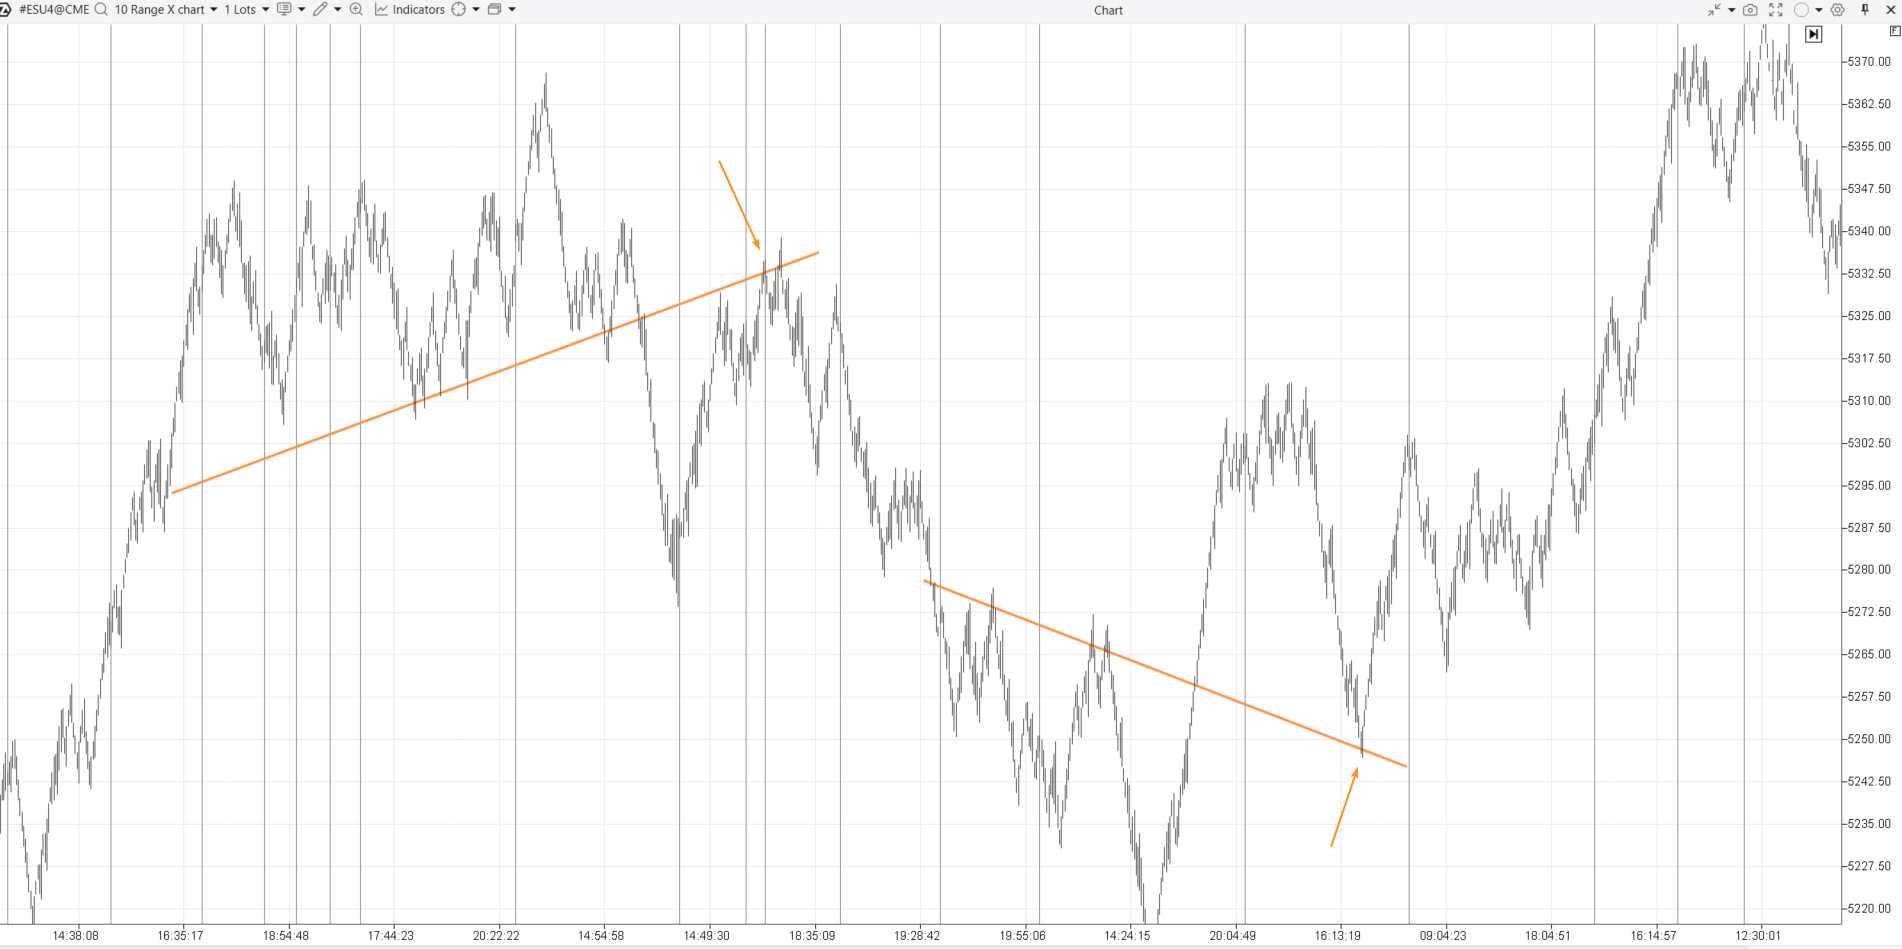
The screenshot above shows a range (10) chart of ES futures. It helps to identify swings, corresponding trend lines, line breakouts, the shift of lines from support to resistance and vice versa (indicated by arrows).
How to Start Applying Swing Trading
To try your hand at swing trading, use the ATAS Market Replay simulator for traders. This module within the ATAS platform utilizes historical data to replicate real-time trading conditions.
Beginner traders can hone their skills in completely real conditions, avoiding any financial risks.
To try the simulator, download the ATAS platform for free, install, and launch it, and then:
- Open a chart of a financial instrument.
- Click on the Market Replay button in the main ATAS menu.
- Activate the Replay mode (the icon should turn green).
- Adjust settings if necessary (date, data type).
- Start playback and enhance your skills as a futures trader.
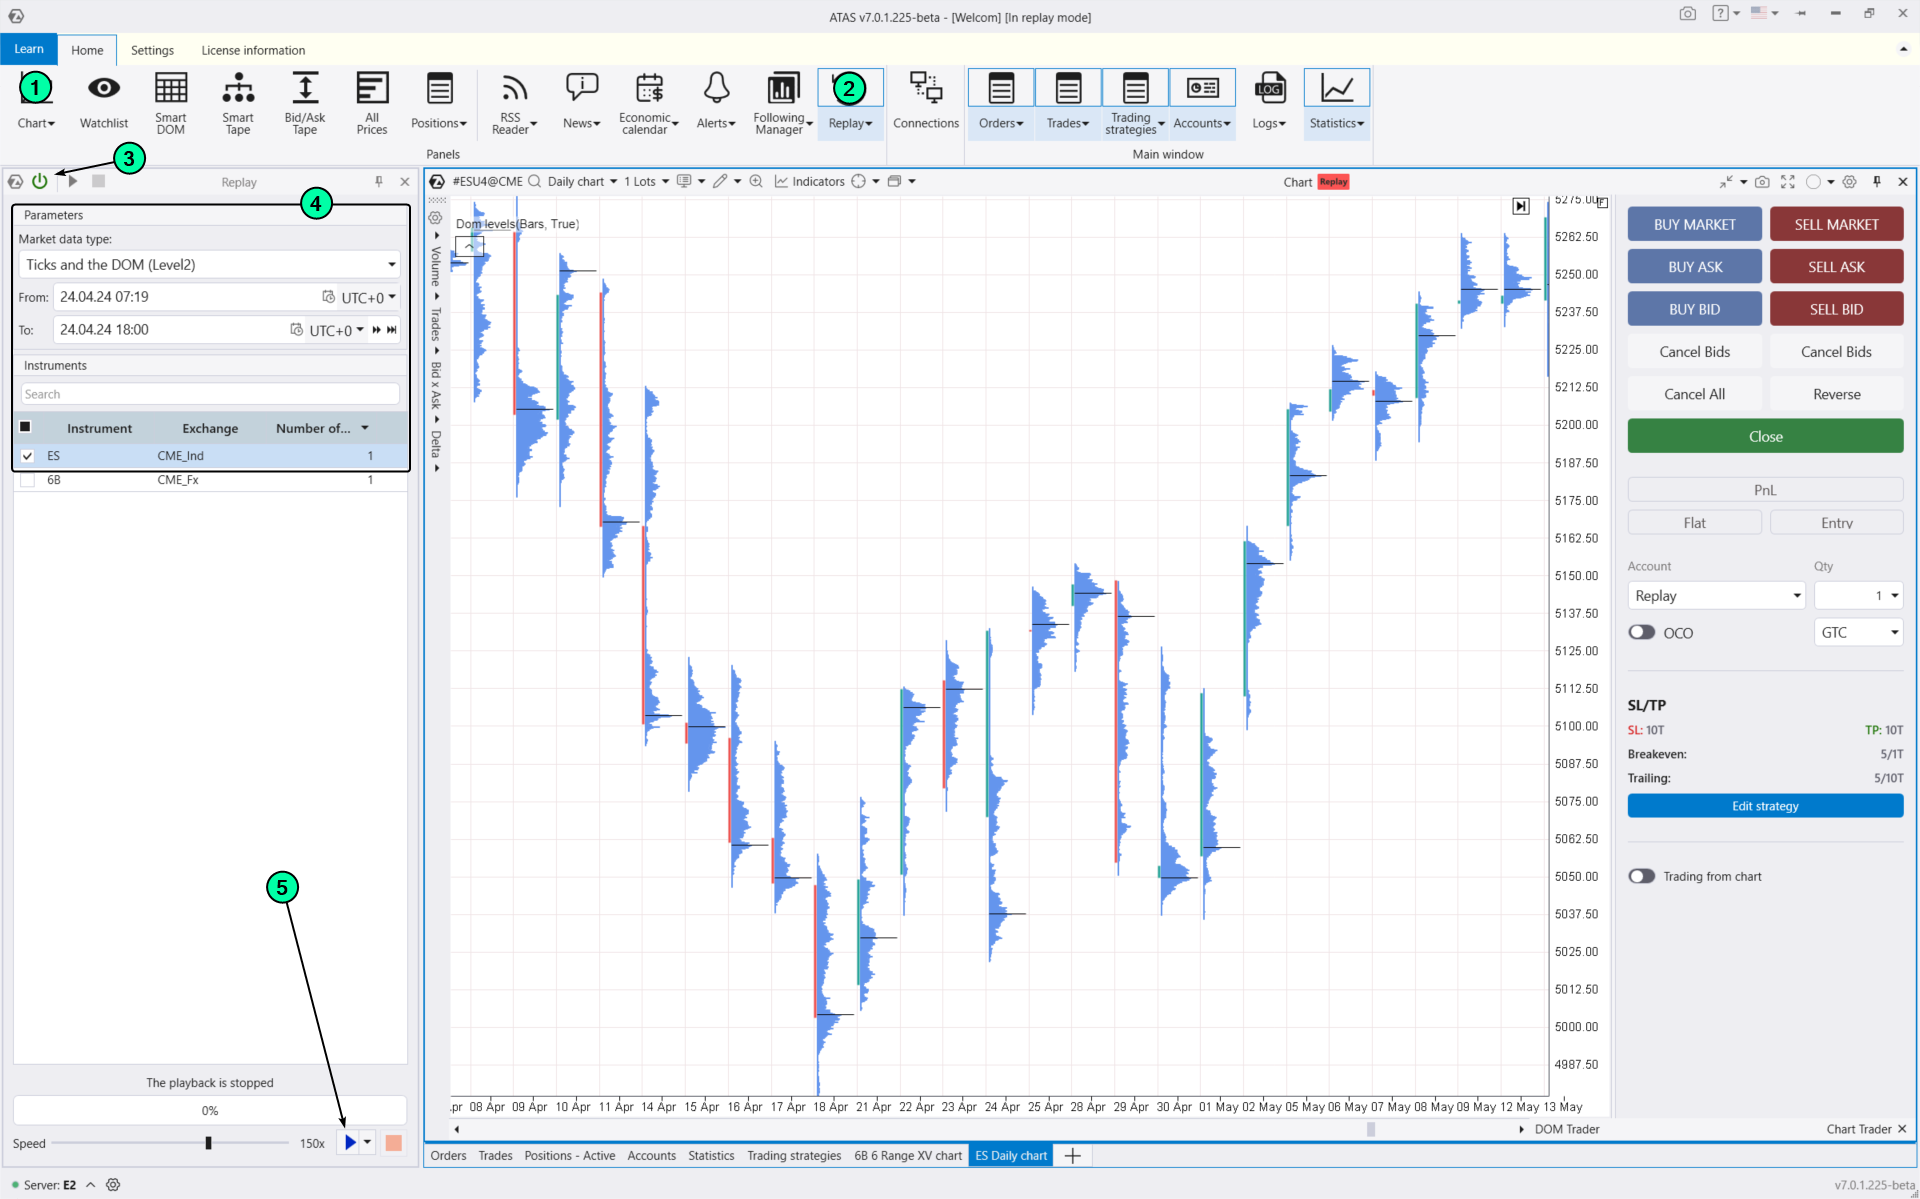
The screenshot above shows a cluster chart of E-mini S&P 500 futures on a daily timeframe. Try to anticipate the next swing based on the price movement and significant volume levels.
During swing trading training in the Market Replay simulator, you can:
- adjust the playback speed, and pause;
- use more than 400 indicators;
- of course, use Chart Trader and other features to trade on the built-in demo Replay account and then analyze your performance;
- use drawing objects, for example, mark support and resistance levels;
- use various chart types (e.g., non-standard Range XV);
- use exit strategies;
- do much more to learn how to spot swings.
Moreover, ATAS enables you to upload tick data history from cryptocurrency, stock, and futures markets, giving you a comprehensive base to find patterns in price-volume interactions and develop your own swing trading strategy.
Conclusions
Swing trading is between day trading and long-term investments. It is ideal for those willing to hold positions for a few days and remain calm during market swings. This style focuses not on small profits from a large number of trades, but on quality, emphasizing carefully chosen entry and exit points, which requires patience.
Swing traders actively use technical analysis, complementing it with fundamental analysis for a deeper understanding of supply and demand balances. Despite the potential for profits from trends that last more than a day, it is important to remember the risks and costs associated with holding positions overnight, gaps after weekends, fluctuations that one can ignore on minute timeframes. All the things mentioned above highlight the importance of establishing clear trading rules based on identified patterns.
Download ATAS. It is free. During the trial period, you will get full access to the platform’s tools to experiment with different strategies for swing trading. Moreover, you can continue using the program for free even after the 14-day trial period is over, whether it is for cryptocurrency trading, analyzing volumes and identifying potential swings.
Do not miss the next article on our blog. Subscribe to our YouTube channel, follow us on Facebook, Instagram, Telegram or X, where we publish the latest ATAS news. Share life hacks and seek advice from other traders in the Telegram group @ATAS_Discussions.
Information in this article cannot be perceived as a call for investing or buying/selling of any asset on the exchange. All situations, discussed in the article, are provided with the purpose of getting acquainted with the functionality and advantages of the ATAS platform.