
The doji pattern is a candlestick where the opening and closing prices are nearly the same. While doji candles are a common feature on charts, the real challenge lies in the uncertainty during their interpretation.
Traders are often advised to consider the broader market context and use additional tools to enhance their trading strategies.
In this article, we will explore how the footprint and volume analysis indicators on the ATAS platform can help you make informed trading decisions when a doji appears on your chart.
Learn more:
What Is the Doji Pattern?
The doji candlestick pattern is named after the Japanese word “同事,” which means “the same thing.”
This reflects its key characteristic: the price of the financial asset remains almost unchanged during the trading period.
Example on the Chart
On October 28, Apple Inc. (AAPL) opened (1) at $233.32 and closed (2) at $233.49.
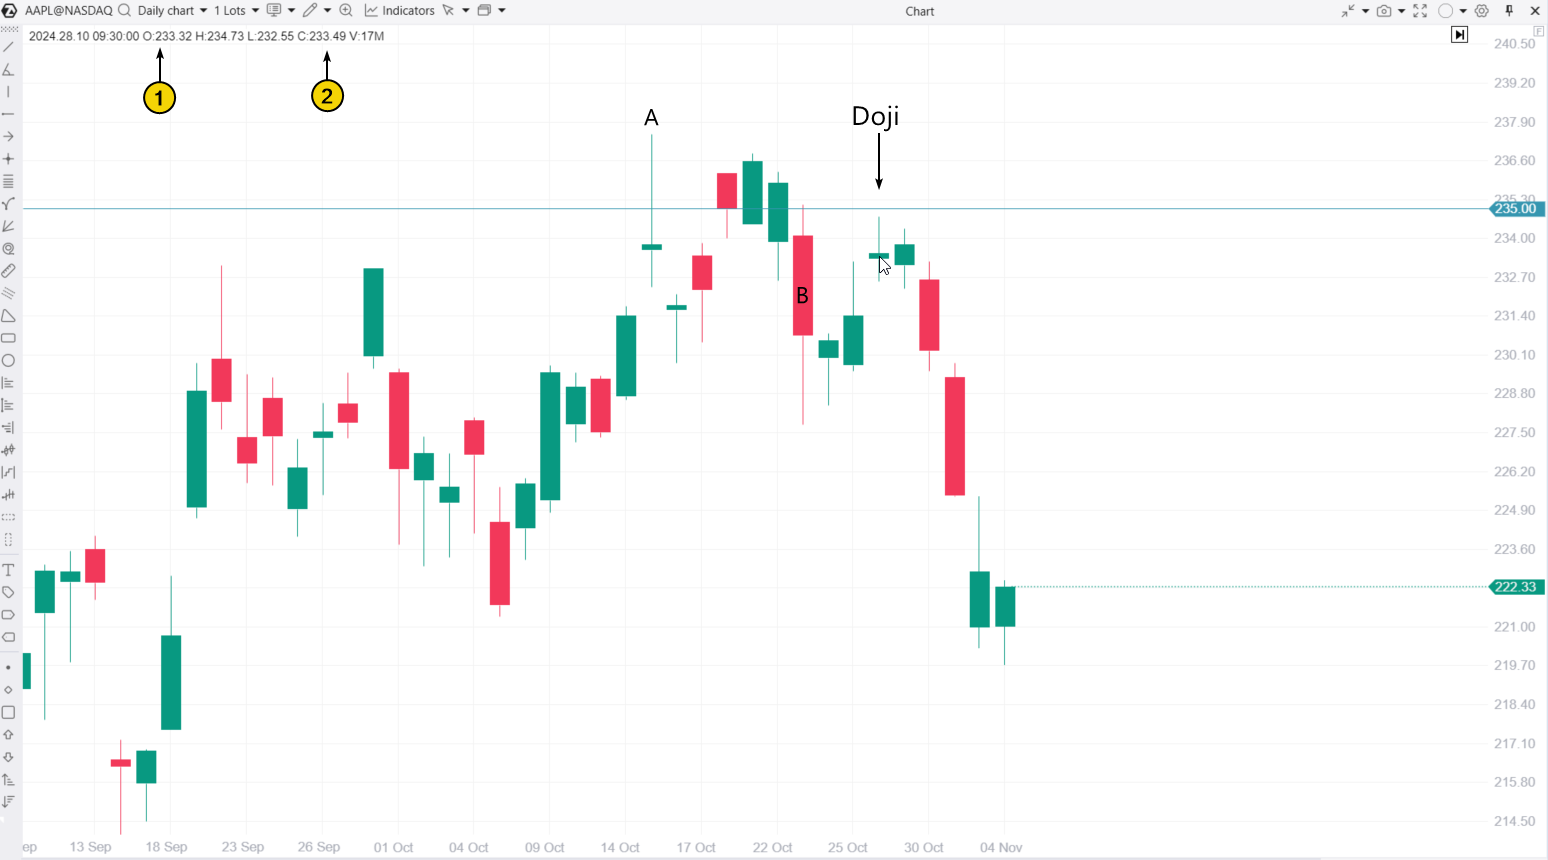
Although the stock price increased by 17 cents, the difference is so small that this candlestick (highlighted by the arrow) is considered a doji.
What Does the Doji Candle Mean?
The Japanese doji candlestick offers a lot of room for interpretation:
✔ Balance of indecision. When both buyers and sellers lack strong initiative, the price remains largely unchanged, often accompanied by low trading volume.
✔ Balance of momentum. The efforts of buyers and sellers counterbalance each other, which may be reflected in a rise in trading volume.
✔ Reversal candlestick. A doji appearing after a strong trend may signal a potential reversal, indicating that the momentum has run out.
When a doji candlestick appears on the chart, analysts often use additional indicators to get more insights into the developing situation. For instance, the doji marked with an arrow on the chart above could signal a bearish trend, as it is accompanied by the following:
- An upthrust (A) – a candlestick with a long upper shadow, suggesting that sellers may be gaining momentum as the price crosses the psychological $235 level;
- A wide bearish candle (В), confirming strong selling activity.
In this context, the doji could indicate indecision among buyers as they struggle to overcome the $235 level. In other words, if the bulls show weakness, it creates an opening for the bears to take control.
Types of Doji Candle Patterns
The doji pattern consists of a single candlestick. However, depending on the position of the shadows relative to the open and close prices, there are five different doji candle types (the exact number may vary depending on the source):
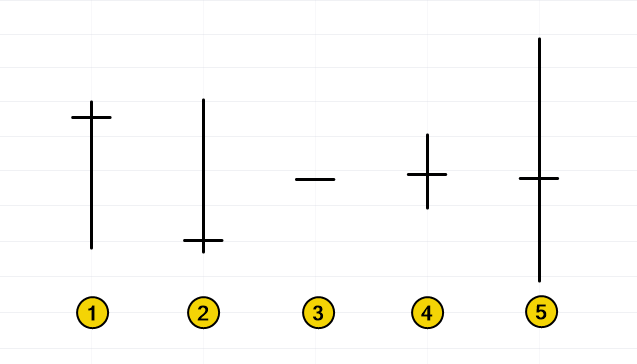
Each type has its own interpretation:
1. Dragonfly doji candle — this type of doji has the open, high, and close prices all at roughly the same level. It can signal a potential reversal to the upside after a downtrend, especially if the following candlestick closes above the body of the Dragonfly Doji.
2. Gravestone doji candle — this candlestick has the open and close near the low. It can indicate a potential reversal to the downside in an uptrend, particularly if the next candlestick closes below the body of the Gravestone Doji.
3. Four-price doji candle — this candlestick forms when the open, close, high, and low prices are either identical or nearly the same, signaling no price movement during the trading period. This often reflects extreme uncertainty or other unusual market conditions.
4. Standard doji candle — the classic doji candlestick, characterized by a small body. It typically appears during periods of low volatility and may indicate a pause in the current trend, market anticipation of significant news, or other factors.
5. Long-legged doji candle — this candlestick features long shadows, indicating significant price swings during the trading session but no clear advantage for buyers or sellers by the close. It often appears during times of heightened market uncertainty, following major news releases.
Analyzing the Doji Candlestick on a Cluster Chart
Below is a screenshot of the US Oil (USO) chart, a fund closely linked to oil prices. The footprint chart adds extra detail with a volume profile (shown in blue), allowing for more accurate analysis and deeper insights.
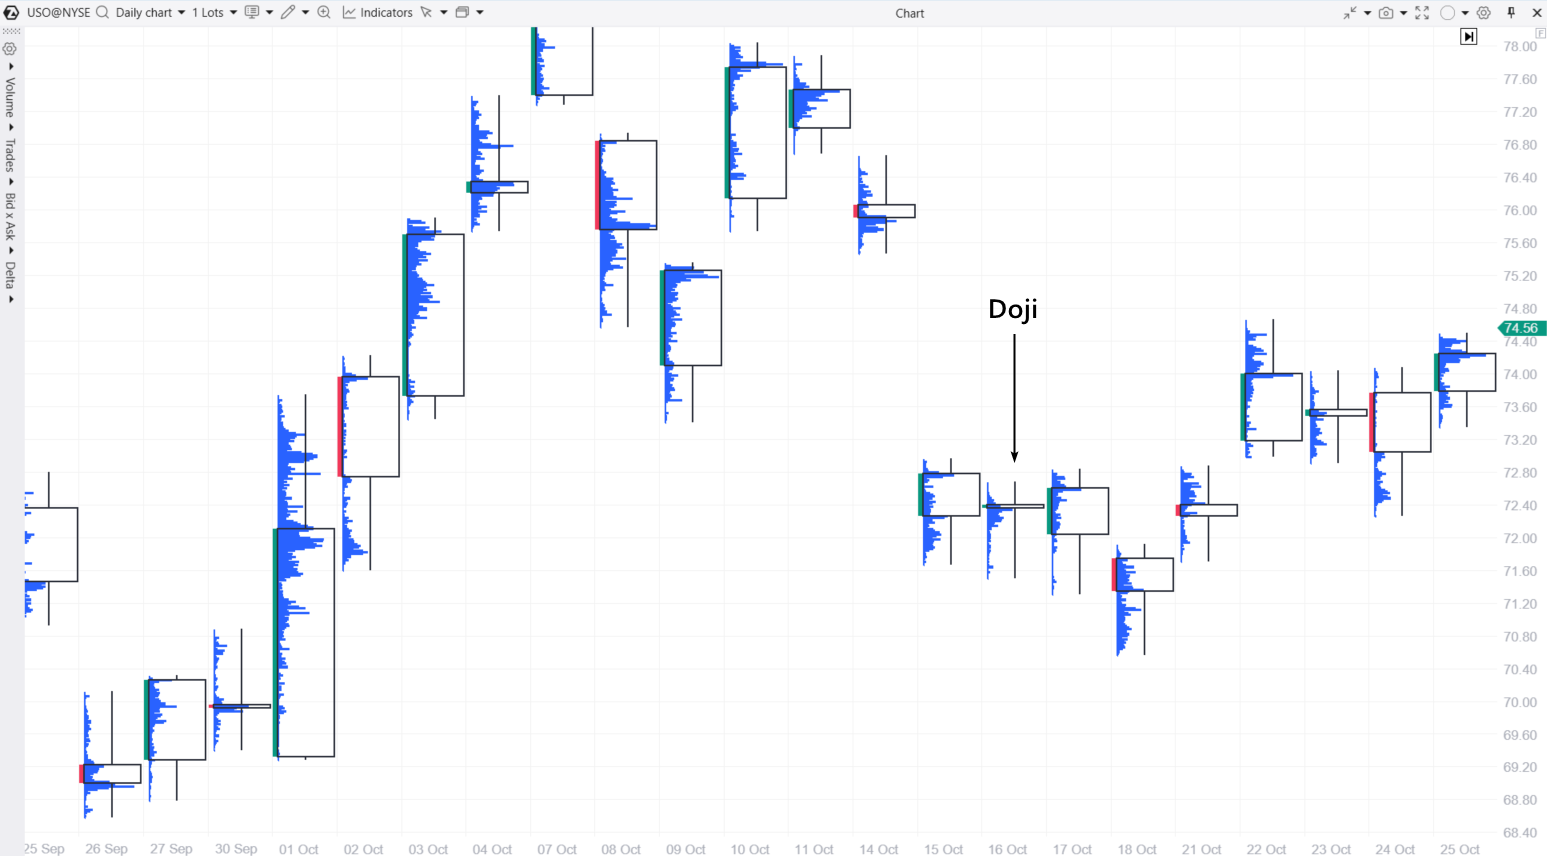
A key market context can be observed with the candlestick from October 15, which opened with a wide bearish gap. This was triggered by Israel’s anticipated strike on Iran, which did not target nuclear or oil facilities. As tensions in the Middle East eased, oil prices dropped. Could traders expect further declines?
On October 16, a doji candlestick formed, suggesting potential bullish signals:
- The candlestick closed in the upper half
- The lower portion of the candlestick showed minimal trading activity, suggesting seller exhaustion.
In this context, the doji could be interpreted as a sign that further price declines were becoming less likely.
Supporting the bullish outlook, the candlestick on October 17 closed above its open and above the previous day’s close. While October 18 saw a downward move, it lacked momentum and appeared to be a bear trap (as indicated by the activity near the lower shadow).
Trading the Doji Pattern
Let’s explore a few practical examples of making trading decisions when a doji candlestick appears on the chart. We will highlight the importance of considering context and the insights provided by cluster charts and ATAS professional indicators for volume analysis.
Classic Recommendations for Trading with the Doji Candlestick
Trading the doji pattern requires a sharp focus and additional analysis, as this candlestick is a clear sign of market indecision.
For beginner traders, classic trading literature suggests several strategies for using the doji candlestick:
Trend Trading Strategy
This strategy assumes that after the indecision signaled by the doji candlestick, the price is likely to resume its trend. Here is a step-by-step guide to trading the doji pattern:
- Identify the trend direction and wait for the doji to appear on the chart.
- Enter the trade when the next candlestick closes in the direction of the trend.
- Place a stop-loss below the doji for a bullish trend or above the doji for a bearish trend.
- Exit the trade upon reaching a significant support or resistance level.
Reversal Trading Strategy
This strategy assumes that the trend is ending and the price is likely to reverse at a key level. Here is an approach to trading the doji pattern in a reversal scenario:
- Identify the bullish or bearish trend and wait for the price to approach a significant support or resistance level.
- Look for a doji candlestick, signaling market indecision about breaking through that level.
- Enter the trade when the next candlestick closes, confirming the potential reversal.
- Apply the same stop-loss and take-profit logic from the previous strategy.
Breakout Trading Strategy
In this case, traders might assume that a trend will emerge following the period of uncertainty signaled by the candle. A breakout strategy using the doji pattern will share many similarities with inside bar trading strategies.
However, experience shows that classic candlestick trading rules often fall short of delivering consistent results. To improve your chances of success, try incorporating modern footprint analysis. The ATAS platform can help with this, you can download it for free here.
Example 1. Doji as a Sign of Trend Continuation
You can see a footprint chart for Euro futures, capturing activity during the fall of 2024:
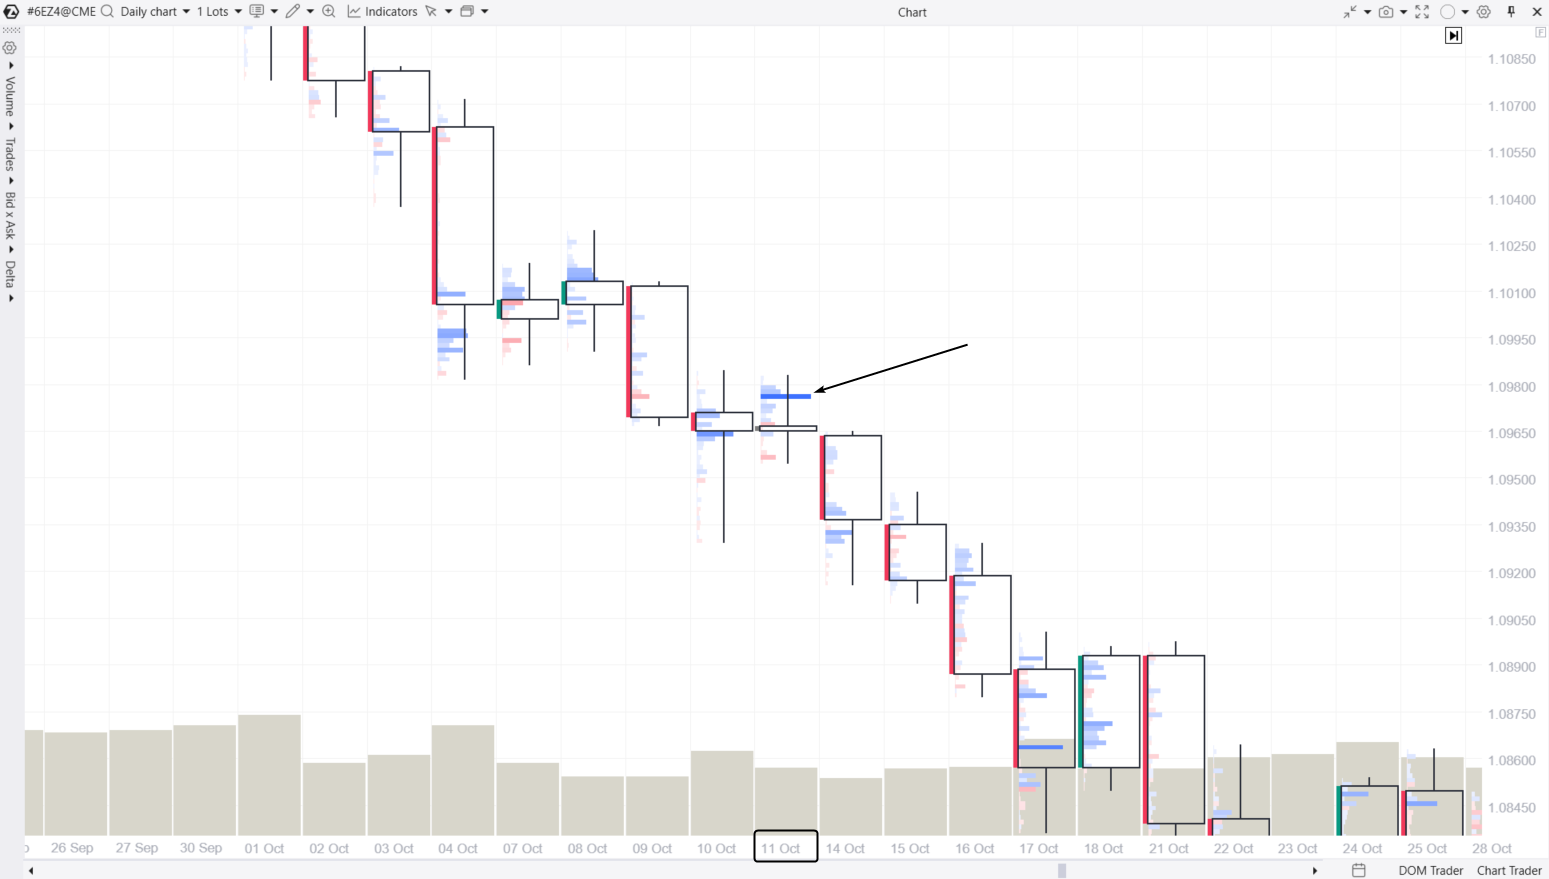
At the time, the market was in a steady downtrend, with candles forming progressively lower highs and lows. On October 11, 2024, a doji candle appeared on the chart.
According to traditional rules, this candle might be seen as a pause in the ongoing downtrend. However, footprint analysts received key confirmations for a more accurate assessment.
The key detail was a spike in buying activity, highlighted by the arrow on the upper shadow of the candle. The mid-range close suggests that if these market buys reflected new long positions, those buyers likely fell into a bull trap — a bearish indicator. With this insight, footprint traders could plan their strategies on the sell side.
Example 2. Two Reversal Doji Patterns
The chart below shows the price movement of gold futures contracts. During this period, the market was in an uptrend, as indicated by the green EMA (50). The footprint chart displays the delta profile.
While the candles from September 3 and 15 might be considered doji, there are some important nuances to note: the opening and closing prices are quite far apart. However, let’s analyze these candles to better understand how to trade reversals using doji patterns.
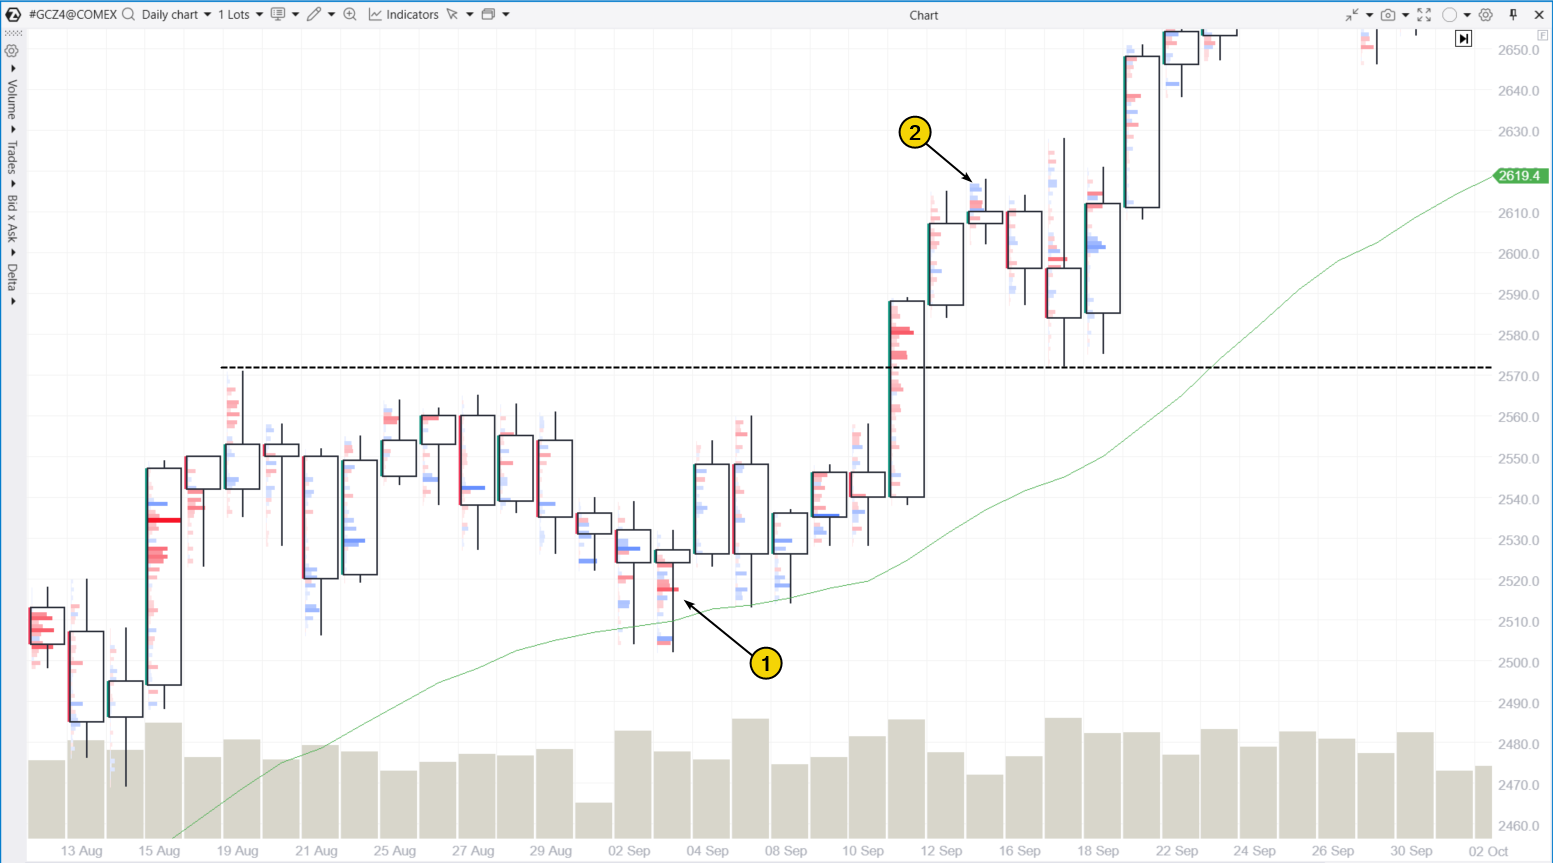
The September 3rd candle formed after a few days of price decline but showed bullish signs because:
- The closing price was near the high (a “Dragonfly Doji“).
- Bearish efforts (marked with a 1) were visible in the bright red clusters but failed to push the price lower.
As a result, traders could conclude that the price closed near the opening level because the market was not ready for lower prices, despite the bearish attempt. This made the subsequent rise less surprising to them.
The September 15th doji tells a similar story, but in reverse: the bulls’ efforts (marked with 2 and visible in the bright blue clusters) failed to make progress. Instead, this likely resulted from:
- Emotional buying when the price broke above the previous candle’s high;
- Stop-loss orders from sellers being triggered above the previous candle’s high.
These are bearish signals that footprint traders could use to plan short trades, possibly for the next day.
Example 3. Doji Candle in the Cryptocurrency Market
Although the cryptocurrency market operates 24/7, trading activity tends to slow down on the weekend. As a result, doji candles are a common sight during this time. For example, the candle from Saturday, October 19, 2024 (marked as 1) on the Bitcoin Futures chart (data from the Bitcoin Futures exchange).
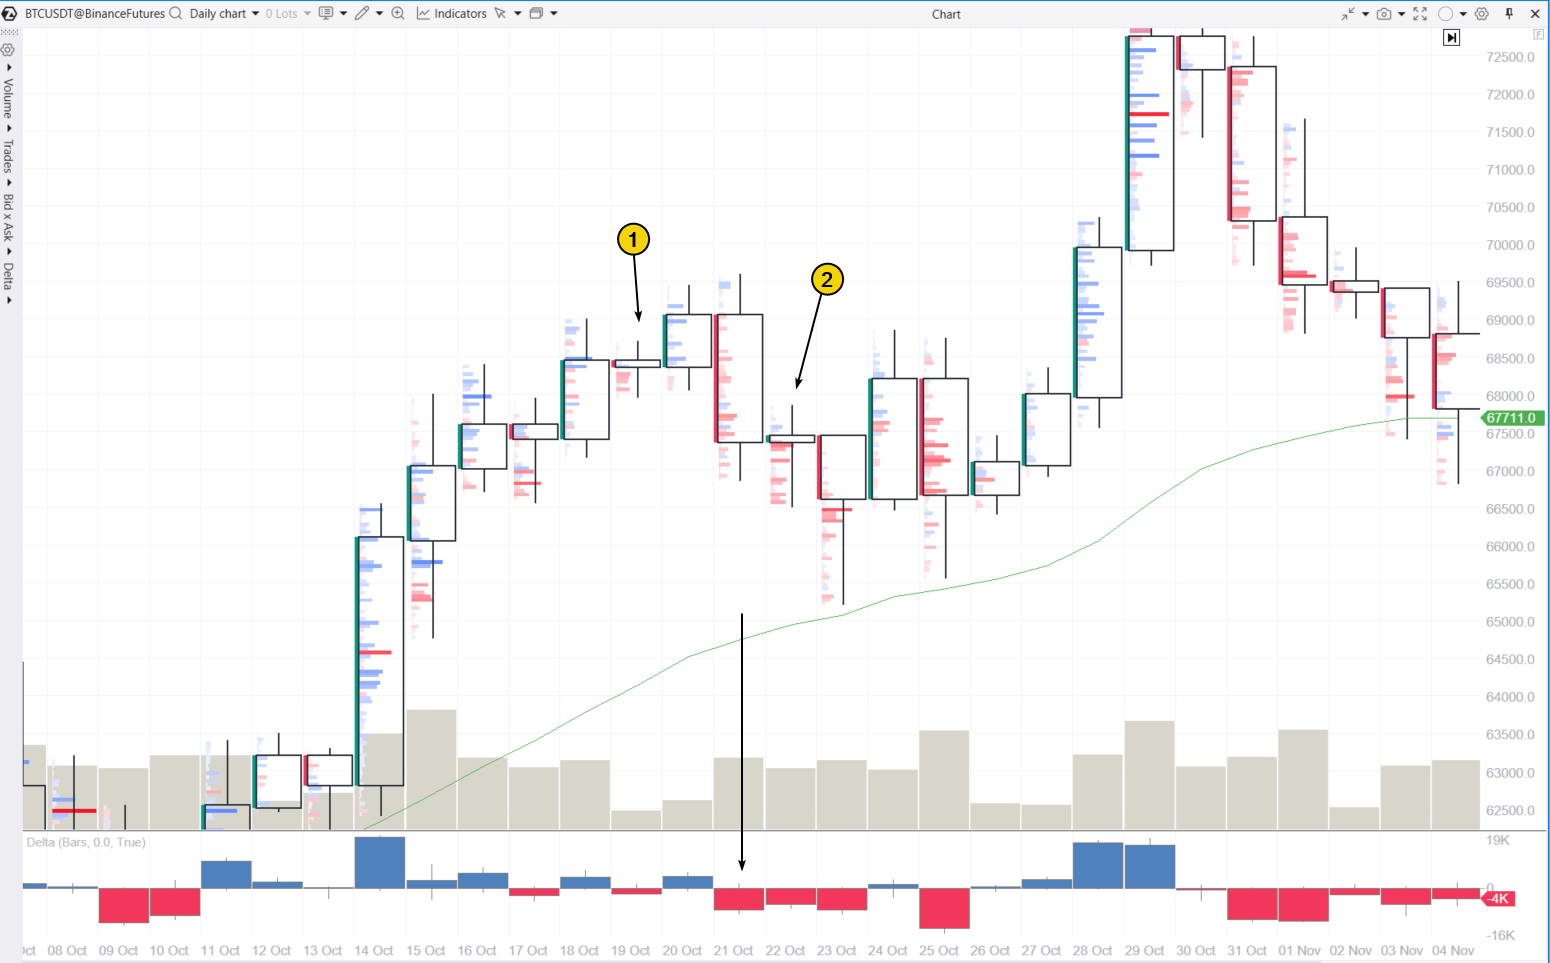
Another candle, which can also be classified as a doji, appeared on Tuesday (marked as 2). What trading insights could it have offered?
To answer this question, it is important to analyze the broader context, which was primarily bullish: Bitcoin’s price had been on an upward trend from October 11 to October 20. However, selling pressure intensified on October 21, as reflected by a noticeable spike in negative Delta (indicated by the arrow).
The doji that appeared on October 22 reflects a clear state of market indecision:
- bears seemed unwilling to push prices lower following the rally from October 11 to 20;
- bulls, meanwhile, hesitated to challenge new highs after the bearish candle on October 21.
As a result, the market entered a period of “price swings”: on October 23 and 25, the price dropped, while on October 24 and 26, it rebounded, creating a range between 65,500 and 68,500. Recognizing this state of market hesitation (balance), traders could have prioritized intraday reversal strategies, using volume indicators or footprint chart patterns for confirmation.
Example 4. Doji on Non-Standard Charts
The doji pattern was originally designed for daily candlestick charts.
Using the doji pattern for intraday trading has its nuances due to the uneven distribution of trader activity throughout the day. Therefore, doji candles tend to appear more frequently during the less active Asian session, and less often during the more aggressive U.S. session.
One interesting way to use the doji pattern intraday is on volume charts. On these charts, new candles are created once a specific number of contracts are traded, which means the volume histogram bars are roughly the same height.
Example. The screenshot below shows a Volume (1) footprint chart for S&P 500 futures.
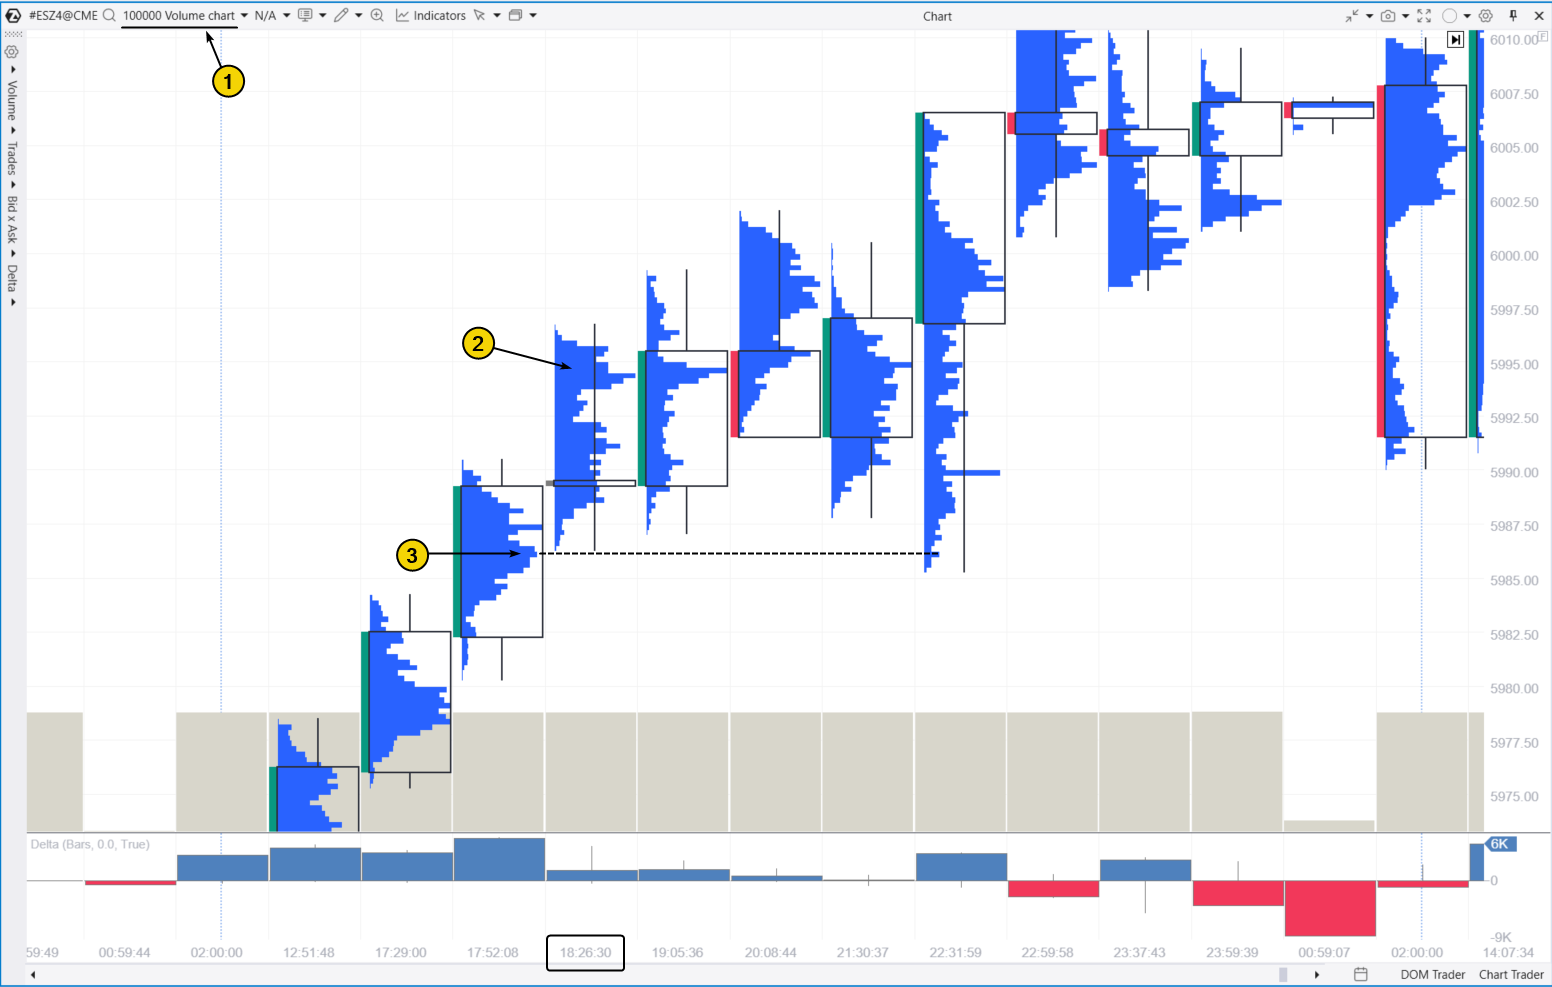
At 18:26, a doji candle appeared on the chart with a bearish implication, as the close is below the peak (2) on the volume profile, which is clearly visible thanks to the cluster chart settings.
This sign of indecision could suggest a weakening of the upward trend seen earlier in the day, pointing to a potential price pullback to the support level.
The cluster chart provides a clearer view for identifying this support level. As seen on the chart, the support corresponds to level (3), which aligns with the peak on the profile of the candle just before the doji.
FAQ
Is the doji a bullish or bearish pattern?
Neither. The doji pattern typically appears in markets that are indecisive, where traders cannot agree on the direction of price movement. However, some sources use these terms:
- A bullish doji candle – the closing is slightly higher than the opening;
- A bearish doji candle – the closing is slightly lower than the opening.
But in both cases, these terms do not provide any indication of the future direction of price movement.
What is a doji star candle?
A doji star is another name for the doji pattern, referring to its visual similarity to a cross or plus sign.
Is a doji a reliable pattern?
Yes and no. Yes — because it often indicates market indecision with a high degree of accuracy. No — because relying on a single doji candle to predict the next price movement is rarely effective.
Thomas Bulkowski, a renowned expert on candlestick patterns, found through his research that the price movement following different types of doji candles is random.
How to Trade Profitably Using Candlestick Patterns
Trying to trade on financial markets using the doji pattern alone often leads to the realization that additional, more insightful tools are needed for making well-informed trading decisions. These tools may include:
- ATAS indicators for volume analysis;
- cluster charts (footprint) with customizable settings;
- non-standard chart types.
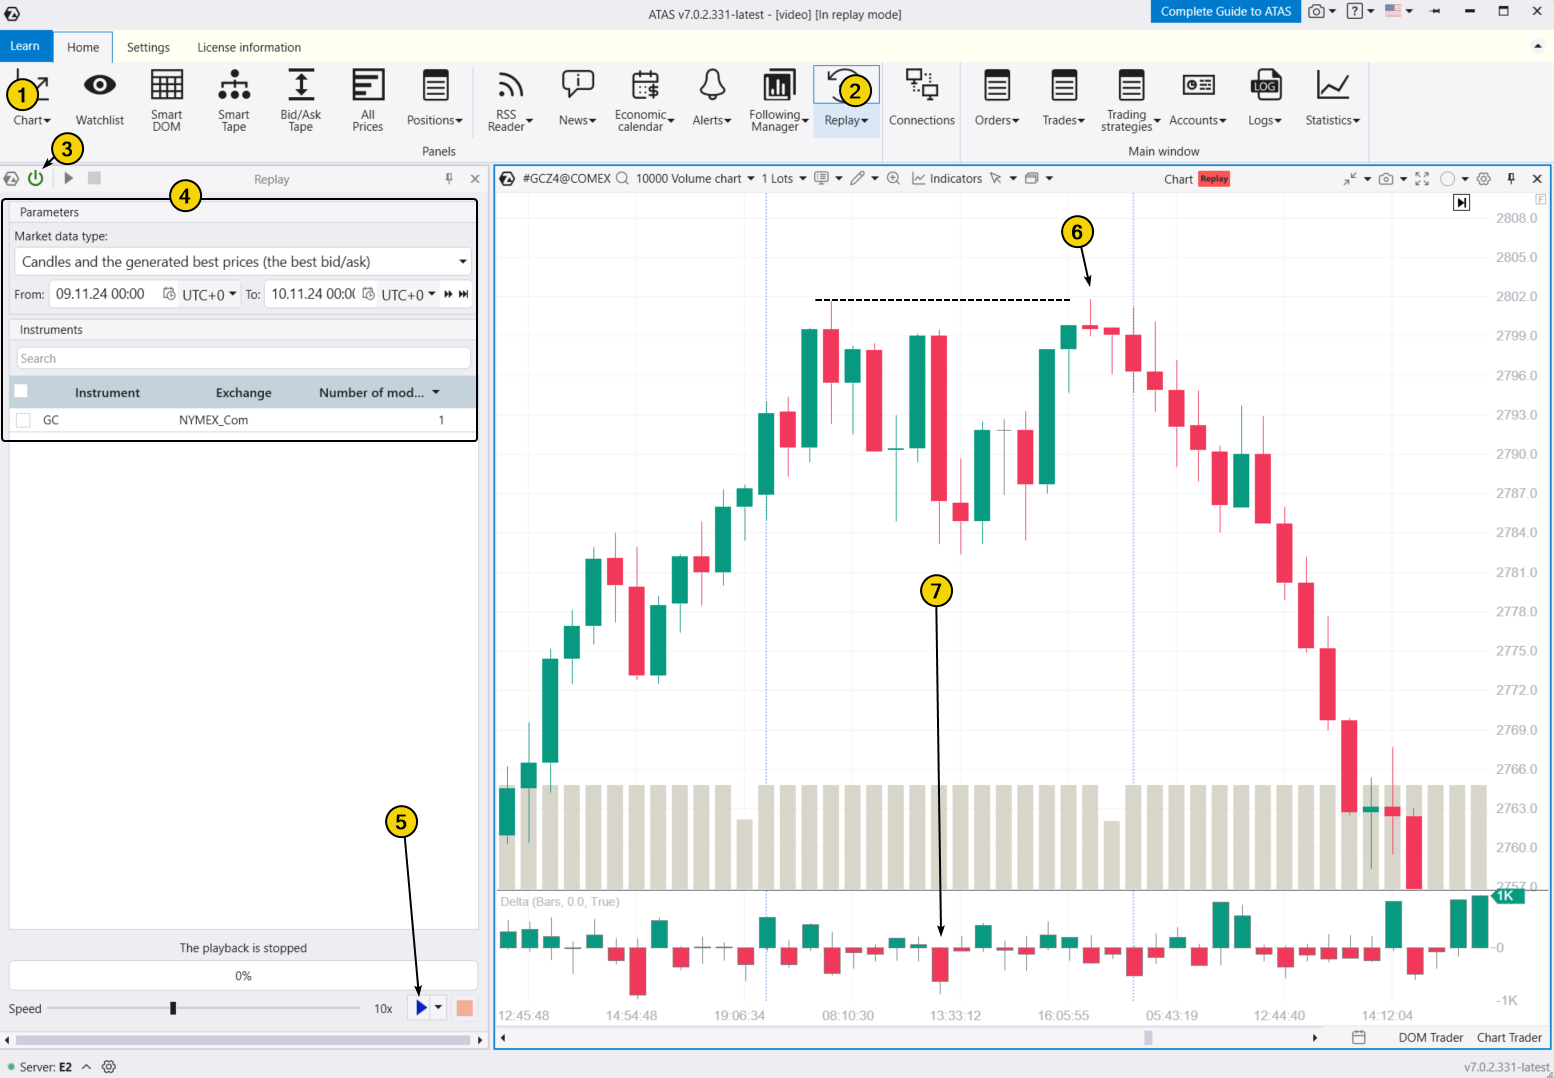
Discover the practical advantages of modern market analysis and forecasting tools that can elevate your work with traditional candlestick charts by trying the ATAS Market Replay simulator. This module of the ATAS platform uses historical data to recreate real-time trading conditions.
Traders can hone their skills in a live market environment without any financial risk, practicing the use of footprint charts to improve trading efficiency — whether with doji patterns or other strategies.
When practicing trading patterns in the Market Replay simulator, you can:
- adjust the playback speed, and pause;
- analyze footprint charts;
- use over 200 indicators;
- use Chart Trader and other features to trade on the Replay built-in demo account, and then analyze your performance;
- use exit strategies.
To try the simulator, download the ATAS platform for free, install, and launch it, and then:
- Open a chart of a financial instrument.
- Click on the Market Replay button in the main ATAS menu.
- Activate the Replay mode (the icon should turn green).
- Adjust settings (date and data type).
- Start the playback and watch for the appearance of a doji or any other familiar candlestick pattern on the chart. Look for confirmations using footprint charts or indicators.
ATAS enables you to load tick-by-tick data from cryptocurrency, stock, and futures markets, providing a comprehensive basis for analyzing price and volume interactions, helping you refine your trading strategy.
Example. The chart above shows a doji candle (6) forming near a resistance level (indicated by the dashed line). It is likely that buyers were hesitant to continue the upward movement following a surge in selling activity (7) earlier in the day.
Conclusion
The doji is one of the most popular candlestick patterns, but trading it comes with risks since it highlights the inherent uncertainty of financial markets, which are never entirely predictable by nature.
Advantages of the doji pattern
- The doji is arguably one of the easiest patterns to spot on a chart. It consists of just one candle and stands out with its unique appearance. Typically resembling a cross, a doji forms when the opening and closing prices are the same or nearly identical.
Disadvantages of the doji pattern
- Signal uncertainty. The doji can be misleading, as it can be interpreted as a signal for both trend continuation and reversal.
- False signals. Some believe that the doji pattern’s effectiveness often resembles randomness, which makes it less reliable.
- Need for additional analysis. To interpret the doji pattern correctly, it is important to consider the overall market context and use additional indicators.
To make more informed trading decisions, enhance your standard candlestick analysis with professional volume analysis tools, such as cluster charts, the Delta indicator, market profile, and other tools available on the ATAS platform.
Download ATAS. Once you install the platform, you will automatically get the free START plan, which includes cryptocurrency trading and basic features. You can use this plan for as long as you like before deciding to upgrade to a more advanced plan for additional ATAS tools. You can also activate the Free Trial at any time, giving you 14 days of full access to all the platform’s features. This trial allows you to explore the benefits of higher-tier plans and make a well-informed purchasing decision.
Do not miss the next article on our blog. Subscribe to our YouTube channel, follow us on Facebook, Instagram, Telegram or X, where we publish the latest ATAS news. Share life hacks and seek advice from other traders in the Telegram group @ATAS_Discussions or on Discord.
Information in this article cannot be perceived as a call for investing or buying/selling of any asset on the exchange. All situations, discussed in the article, are provided with the purpose of getting acquainted with the functionality and advantages of the ATAS platform.


