Voss Predictive Filter treats price fluctuations as cyclic. According to its logic, the indicator signals identify buying and selling points. How profitable are they? You will learn about it from this article.
Read in the article:
Indicator history
A Peek Into the Future article by John Ehlers was published in the August 2019 issue of the Technical Analysis of Stocks & Commodities magazine, in which the author offered an interesting indicator – Voss Predictive Filter (the screenshot below is taken from the original article).
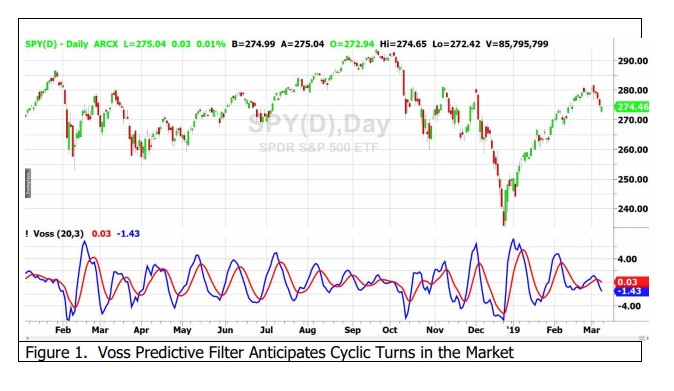
The indicator operation is based on a universal negative delay filter for the prediction of signals, which was developed by Henning U. Voss.
You can find the indicator calculation formula and detailed description of what the parameters mean in the original PDF article (A Peek Into The Future) on the John Ehlers web-site and also in the ATAS Knowledge Base.
So, let’s have a look at this indicator and see whether it has prospects for application.
Voss Predictive Filter indicator signals
The Voss Predictive Filter sends trading signals with the help of crossings as well as other indicators, which consist of 2 lines, do:
- Bullish crossing. If the blue line crosses the red line upward, it is a buying signal.
- Bearish crossing. If the blue line crosses the red line downward, it is a selling signal.
Example
Let’s consider 7 Voss Predictive Filter indicator signals in the Brent oil futures chart.
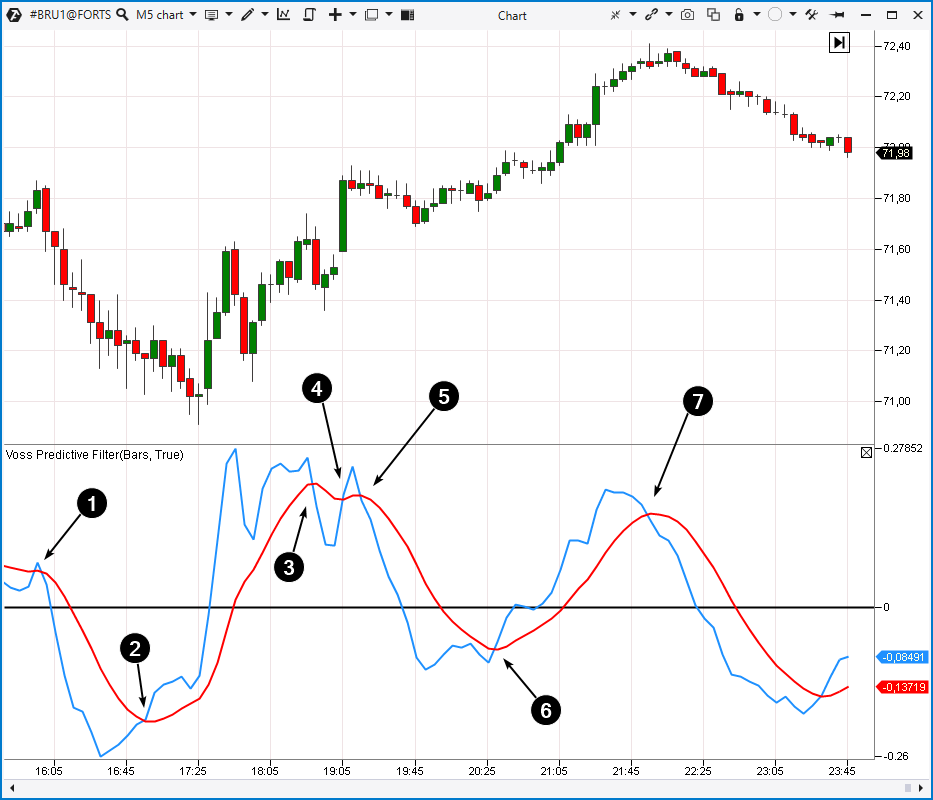
- In fact, number 1 points at two signals. The buying signal turned out to be false, but then the indicator quickly ‘corrected itself’ and sent the selling signal. While the buying signal brought some loss, the profit from the subsequent selling signal compensated the loss. The result is a profit.
- Then goes the buying signal. We can see here that the Voss Predictive Filter really tries to predict the market behaviour by sending a signal before a reversal takes place. If you had entered into a long using this signal, you, most probably, would have been a little nervous. However, the result is a profit.
- The result is a loss.
- The result is a small loss.
- The result is a small loss.
- The result is a profit.
- The result is a profit.
In total, the profit outweighs the losses, that is why the indicator seems to be perspective.
Let’s conduct more accurate testing.
Is it possible to make money trading by the Voss Predictive Filter indicator signals?
In order to answer this question accurately, we developed a statistics collection algorithm, which can be connected to the ATAS platform through API as a custom indicator.
We wrote how to do it in the following articles:
- How to write algorithms for ATAS.
- How to test a strategy (using the Super Trend indicator) automatically.
The algorithm goes through all candles in the chart using the ‘i’ variable. For example, let’s take a daily SPY chart:
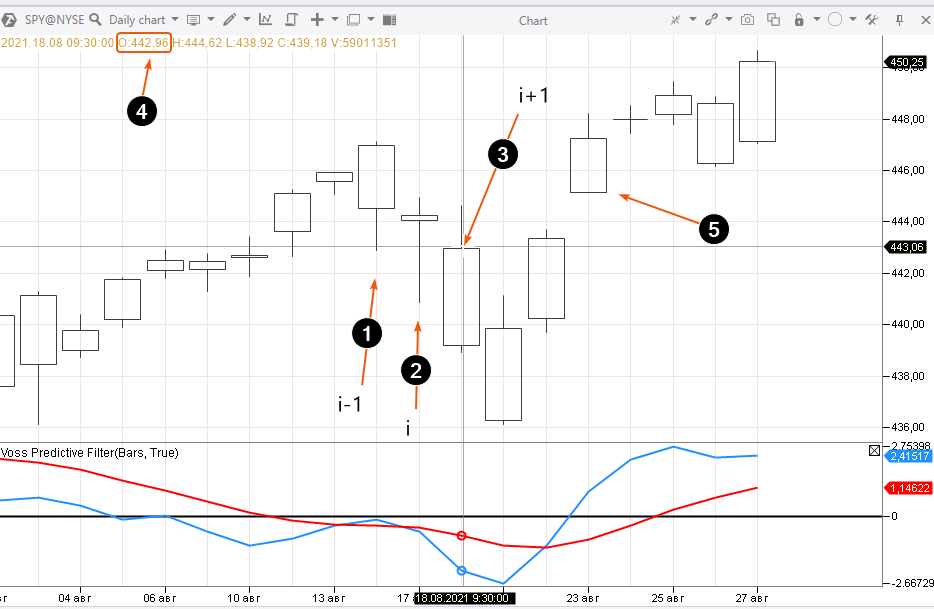
- The blue line was above the red one on August 16, 2021.
- The blue line moved below the red one at the ‘i’ candle closing – it was a selling signal.
- A short position was opened at the next day’s Open price.
- The short opening price was USD 442.96.
- The short closing (and long opening) price was USD 445.16. This was the candle Open price on August 23, since there was a bullish crossing on 2 previous candles.
We can go through all candles in any ATAS chart with the help of the algorithm in no time and calculate the results of trading by a strategy.
Experiment 1. Let’s have a look at how the Voss Predictive Filter works in the ES chart (the type is Tick = 5000 covering = 100 days).
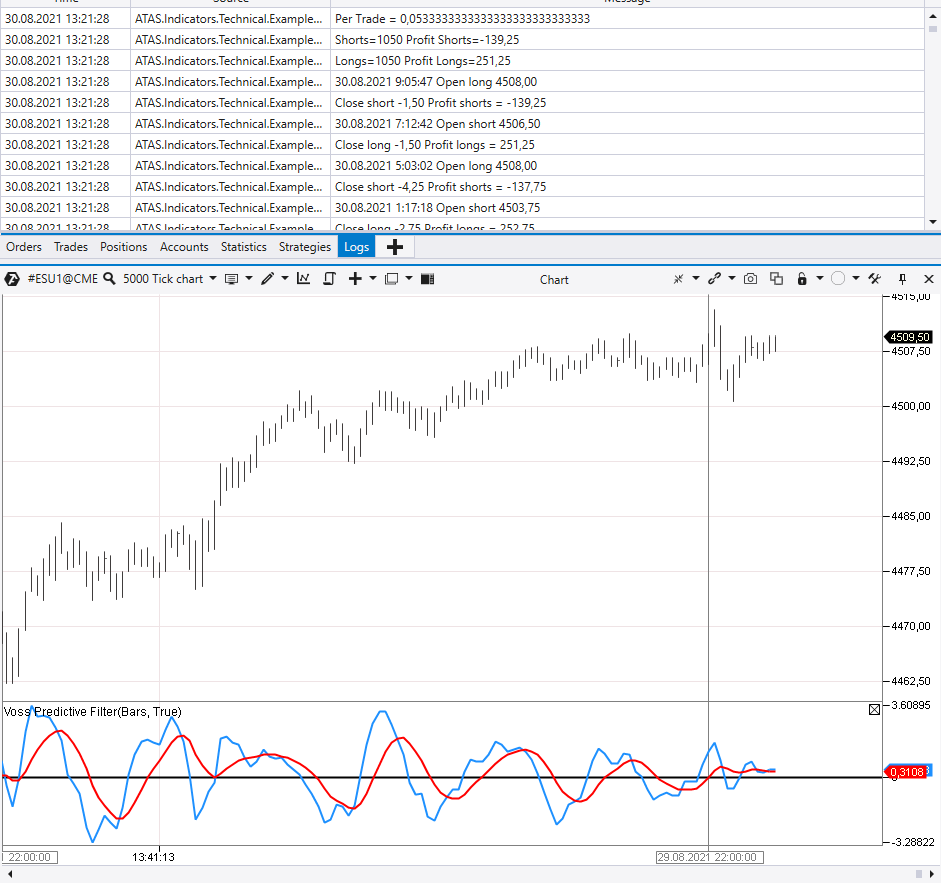
The algorithm calculated that 1,050 long and the same number of short trades were executed during 100 days by the Voss Predictive Filter indicator line crossing signals. The algorithm writes the total result: 251.25 – 139.25 = USD 112 (when trading a minimum volume). However, since USD 1 in the price chart is 4 ticks and a ES tick is USD 12.50, the yield in money terms is 112 * 4 * 12.50 = USD 5,600.
And if we calculate commissions at USD 5.5 per round, the yield will be 5.5 * (1,050 + 1,050) = USD 11,550.
It turns out that, despite some positive mathematical expectation, the profit is unreachable, because the commission size exceeds the estimated yield more than 2 times.
One may note that trading by VPF signals produces a positive result if we take longs only. Namely, → yield = 251.25 * 4 * 12.50 = USD 12,562 and commissions = 5.5 * 1,050 = USD 5,775. Profit = 12,562 – 5,775 = USD 6,787. How good is this result?
The quotation pointed to USD 4,122 at the beginning of the period under consideration and to USD 4,509 at the end of it. The difference was USD 387. If you just buy 1 contract and hold it, the profit = 387 * 4 * 12.50 = USD 19,350, from which you need to subtract USD 5.5 of the commission.
It turns out that simple holding is better than active trading by the VPF indicator. Even if you disregard the commission.
What will the results be, if we switch from a stock index to, for example, raw material futures?
Experiment 2. Let’s add the algorithm to the Range US chart (4/10/16), which shows dynamics of trading gold futures for 113 days (from March 25, 2021, until August 29, 2021).
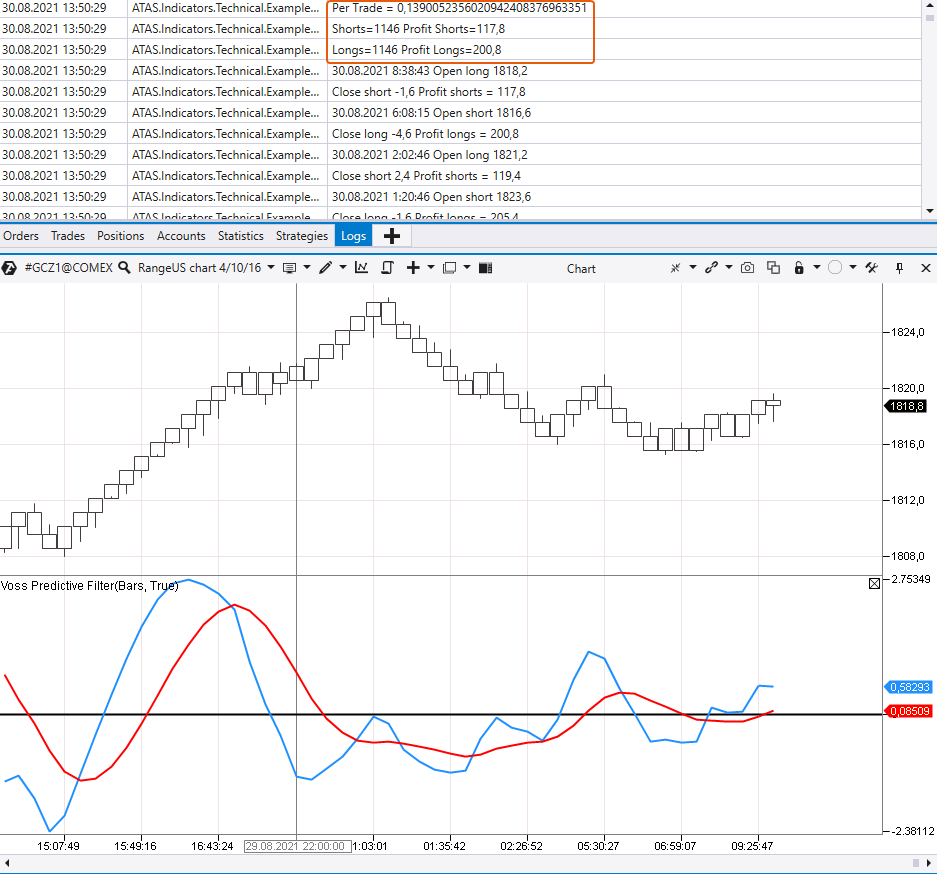
The algorithm calculated that 1,146 long and the same number of short trades were executed during the period under consideration by the Voss Predictive Filter indicator line crossing signals. The total profit was USD 318.6 when trading 1 contract.
It’s interesting that the profit was made both in buying and selling trades. However, let’s calculate the result in more detail.
It is indicated in the GC contract specifications that 1 tick equals USD 0.10 (which means that USD 1 equals 10 ticks) and the tick value is USD 10. Hence, the profit regardless of the commission = 318.56 * 10 * 10 = USD 31,800.
If we take into account the commission of USD 5.5 per trade, it will be (1,146+1,146) * 5.5 = USD 12,606.
It fills us with enthusiasm, however, in fact, the results are not quite trustworthy. If we take a closer look, the opening price in the Range US chart is always equal to the previous bar’s closing price. However, it doesn’t work this way, it’s too ideal. This is connected with the Range US chart plotting technique. A discrepancy emerges, since the algorithm calculates efficiency by opening prices. That is why we rely mostly on the results produced by a classical time-frame.
Experiment conclusions. In general, the Voss Predictive Filter indicator requires conducting a lot of experiments with various settings in order to find some positive mathematical expectation in the end. However, it will be hardly possible to convert it into an advantage for making profit.
Advantages and disadvantages of the Voss Predictive Filter indicator
The Voss Predictive Filter indicator has the same advantages and disadvantages as many other technical indicators have.
Advantages:
- simple signals;
- it is not redrawn;
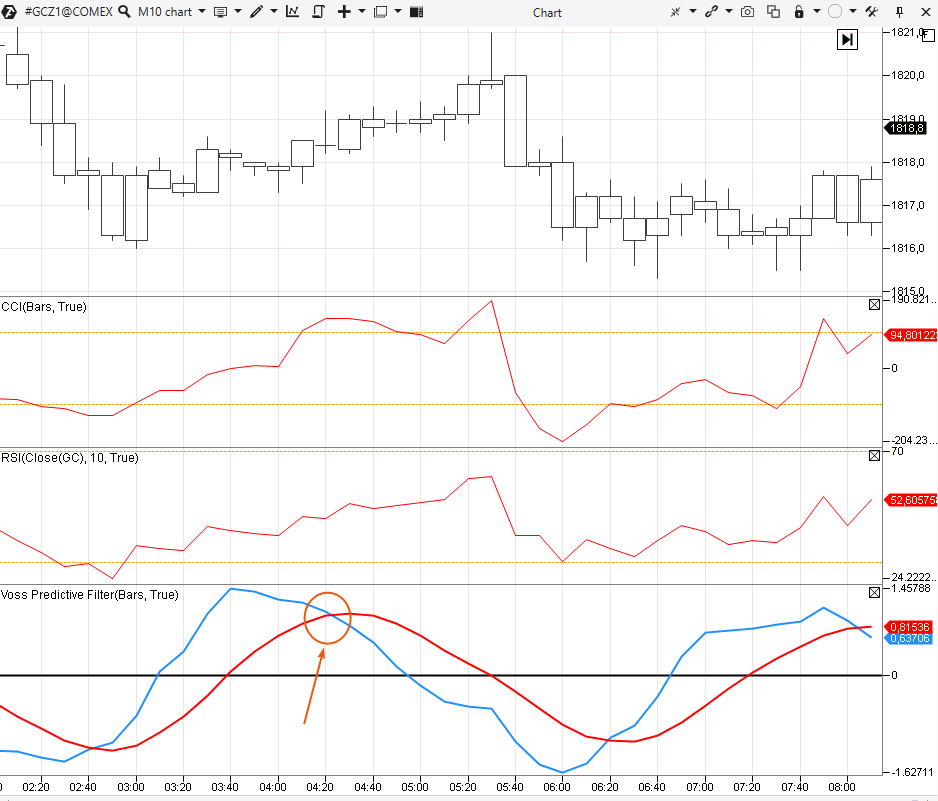
- in some cases, it gives signals earlier than other indicators do, as it is shown in the chart below. VPF has already given an instruction to sell, while CCI and RSI haven’t formed selling signals yet.
Disadvantages:
- a big number of false signals;
- a simple mechanical trading by the indicator signals doesn’t allow you to count on a significant profit.
Comparing the Voss Predictive Filter with cluster chart signals
It makes sense to trade by VPF only when you are sure that the indicator brings more good than bad. The above empirical numbers show that VPF doesn’t provide substantial grounds for relying on highly efficient trading.
In order to execute more profitable trades we recommend you to develop your cluster chart reading skills.
The ATAS platform allows you to work with 25 variants of clusters. Let’s consider an example of how cluster reading can help you to trade in the gold futures market and what the Voss Predictive Filter indicator shows in such a case. The screenshot below shows a 10-minute gold futures chart (the data are from the COMEX, which is a part of the CME Group).
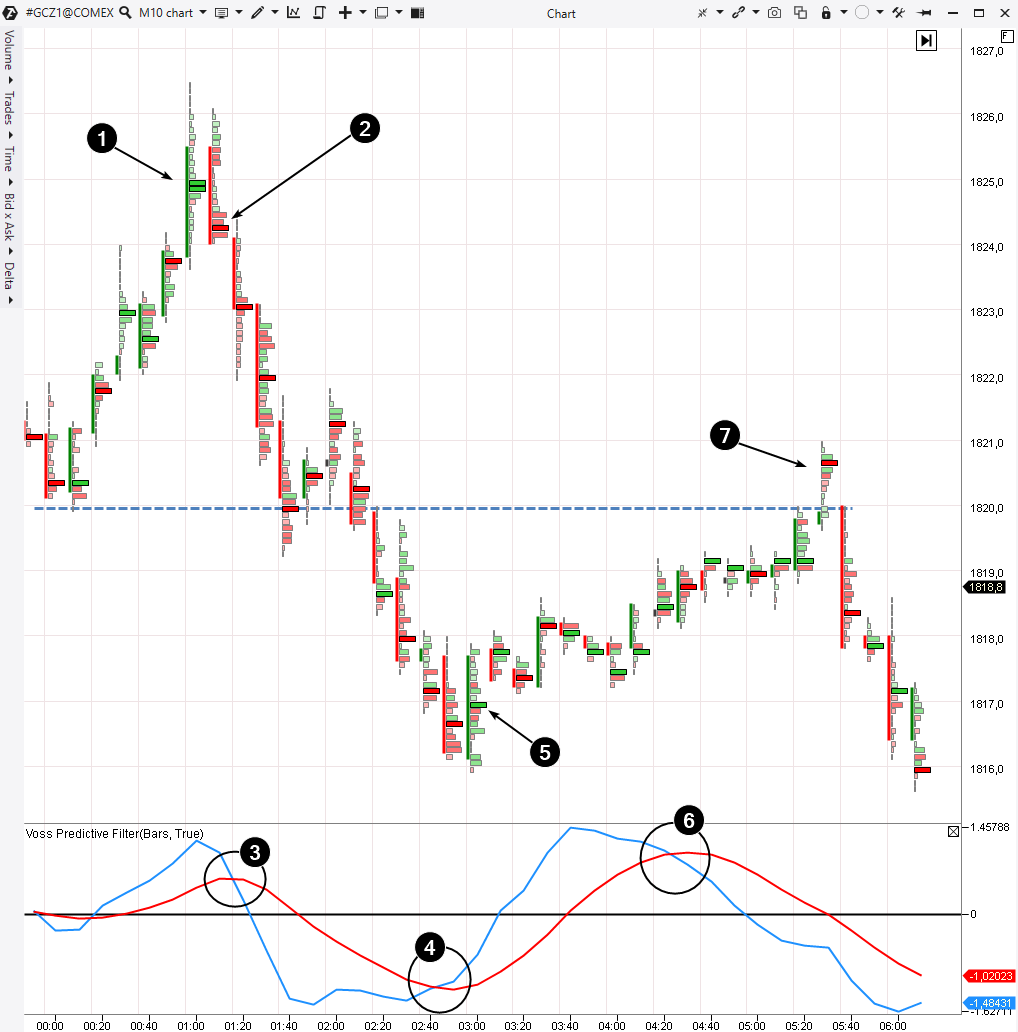
In the morning hours of the trading session, clusters show that sellers became very active (number 2) after a bright splash of buys at the 1825 level (number 1). This change of trading activity assumes that the market is at an important peak, that is why opening a short position under the circumstances is risky but quite justified. We shall note that the VPF indicator sends a selling signal only on the next bar.
A buying signal comes from the Voss Predictive Filter indicator at 02:40 and, this time, the indicator sends a very precise signal at the market low (4), while clusters confirm availability of a buyer only on the next bar (5).
The price increases during two and a half hours until it reaches the 1820 level, which served earlier as the support. The VPF indicator showed the selling signal (6) long ago, but clusters provide a more well-reasoned information. Note the activity splash on the effort to overcome the 1820 level. A weak closing and activity splash (number 7) assume that we will see a reversal from the 1820 resistance level, which takes place in reality.
If we had taken a risk and opened a short position after a weak closing of the bar at 05:30, we would soon have received confirmation of our conclusion correctness in the form of the seller availability clusters on the next down bar. Whereas, a short position, opened by the VPF signal (6), could have made us nervous and doubtful.
Comparing the Voss Predictive Filter with the Speed of Tape indicator
The ATAS platform allows you to use both classical indicators (including VPF) and advanced indicators for trading by volumes. One of them is Speed of Tape. This indicator has several modes and shows how often trades are executed in the market.
Let’s compare Voss Predictive Filter and Speed of Tape. Let’s take the EUR futures market as the ‘indicator battlefield’ (chart Volume = 300).
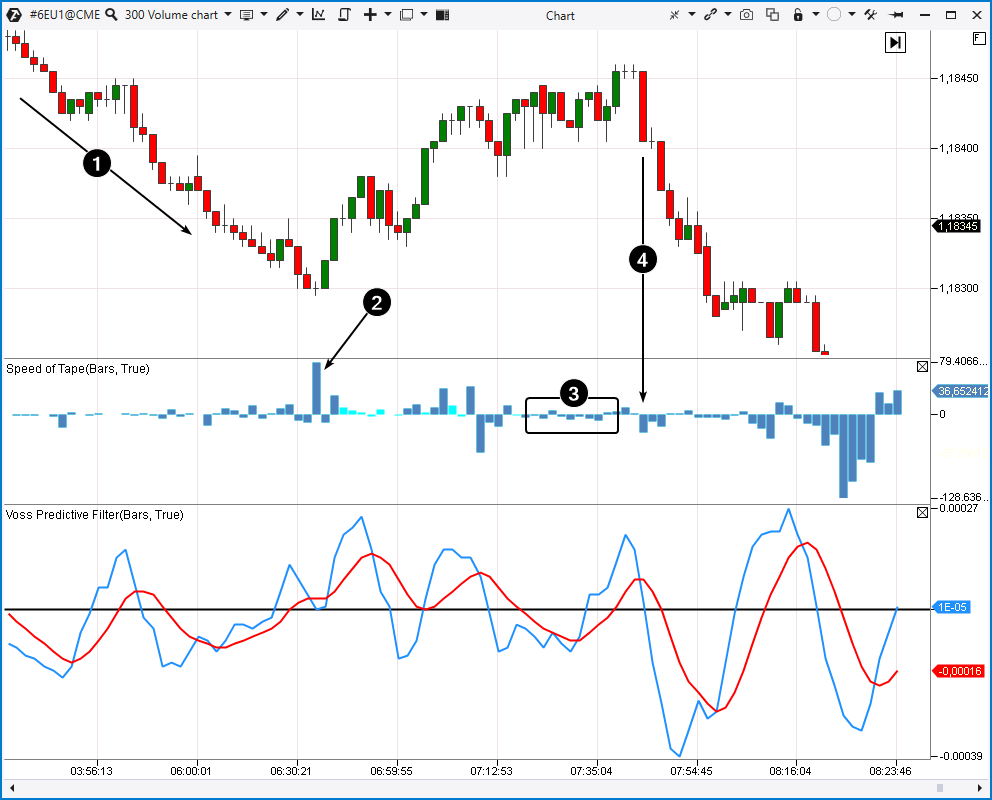
The decrease, marked with number 1, points to the fact that the market is in the local downtrend state. Look at how the Speed of Tape histogram (mode = Delta) helps us to understand the real picture of what takes place:
- Number 2 testifies to the emergence of a buyer who became active near the relatively round level of 1,18300. The bounce probability is very high under the circumstances.
- Number 3 shows that the bounce, most probably, has exhausted, because the price doesn’t grow any more and the buys and sells are balanced. A selling signal will provide grounds for opening a short position on the expectation of the downtrend renewal.
- Number 4 shows the seller’s activation. The downtrend renewed and accelerated after breaking 1,18300.
Note that, while the Speed of Tape indicator helps us to understand the market situation and shows entry points rather precisely, the VPF indicator as if ‘confuses’ and sends chaotic signals.
That is why we believe that Speed of Tape is the winner in this brief ‘indicator battle’.
Conclusions
Voss Predictive Filter is a relatively new indicator, which tries to send a trading signal before other indicators form it. To do it, the indicator considers price fluctuations as a cycle and applies a negative delay mathematical filter.
Statistics collection experiments show that the Voss Predictive Filter indicator can provide a small mathematical advantage in the long run only by a narrow margin, which, however, will be ‘eaten up’ by commissions and slippages with a high level of probability.
If you feel comfortable trading with VPF, you can add it to your chart in the ATAS platform. However, we recommend you to use the functions of modern cluster analysis and volume analysis indicators in order to increase efficiency of your operations. They help you to understand what really takes place in the market.
Download the ATAS platform free of charge and compare how VPF, Speed of Tape and cluster charts work in the markets you have selected.
Information in this article cannot be perceived as a call for investing or buying/selling of any asset on the exchange. All situations, discussed in the article, are provided with the purpose of getting acquainted with the functionality and advantages of the ATAS platform.