
Change of Character (ChoCh) in the Smart Money Concept (SMC) strategy is a pattern that forms when the market shifts its structure or movement, signaling a potential trend reversal.
In this article, we will cover not only the basics of ChoCh but also how advanced volume analysis tools, such as footprint charts, can provide deeper insights into the processes behind this pattern’s formation.
Read more:
Disclaimer: ATAS is not affiliated with Michael Huddleston (Inner Circle Trader, ICT) and does not promote or advertise his trading strategies. This article explores the widely used Change of Character (ChoCh) pattern and showcases ATAS platform tools that can help traders better understand the Smart Money Concept.
Defining ChoCh in Trading
The ChoCh pattern is closely tied to market structure, a key concept in the Smart Money Concept strategy, which we covered in detail in our article: Market Structure and Market Structure Shift.
For ChoCh to occur, there must be an existing trend:
- Bullish ChoCh forms within a downtrend when the market structure shifts, creating a sequence of higher highs (HH) and higher lows (HL);
- Bearish ChoCh appears in an uptrend when the structure changes, showing lower highs (LH) and lower lows (LL).
Example. The Reversal chart below shows how a bearish trend (1-2-3-4-5-6-7) shifted to bullish after ChoCh formed.
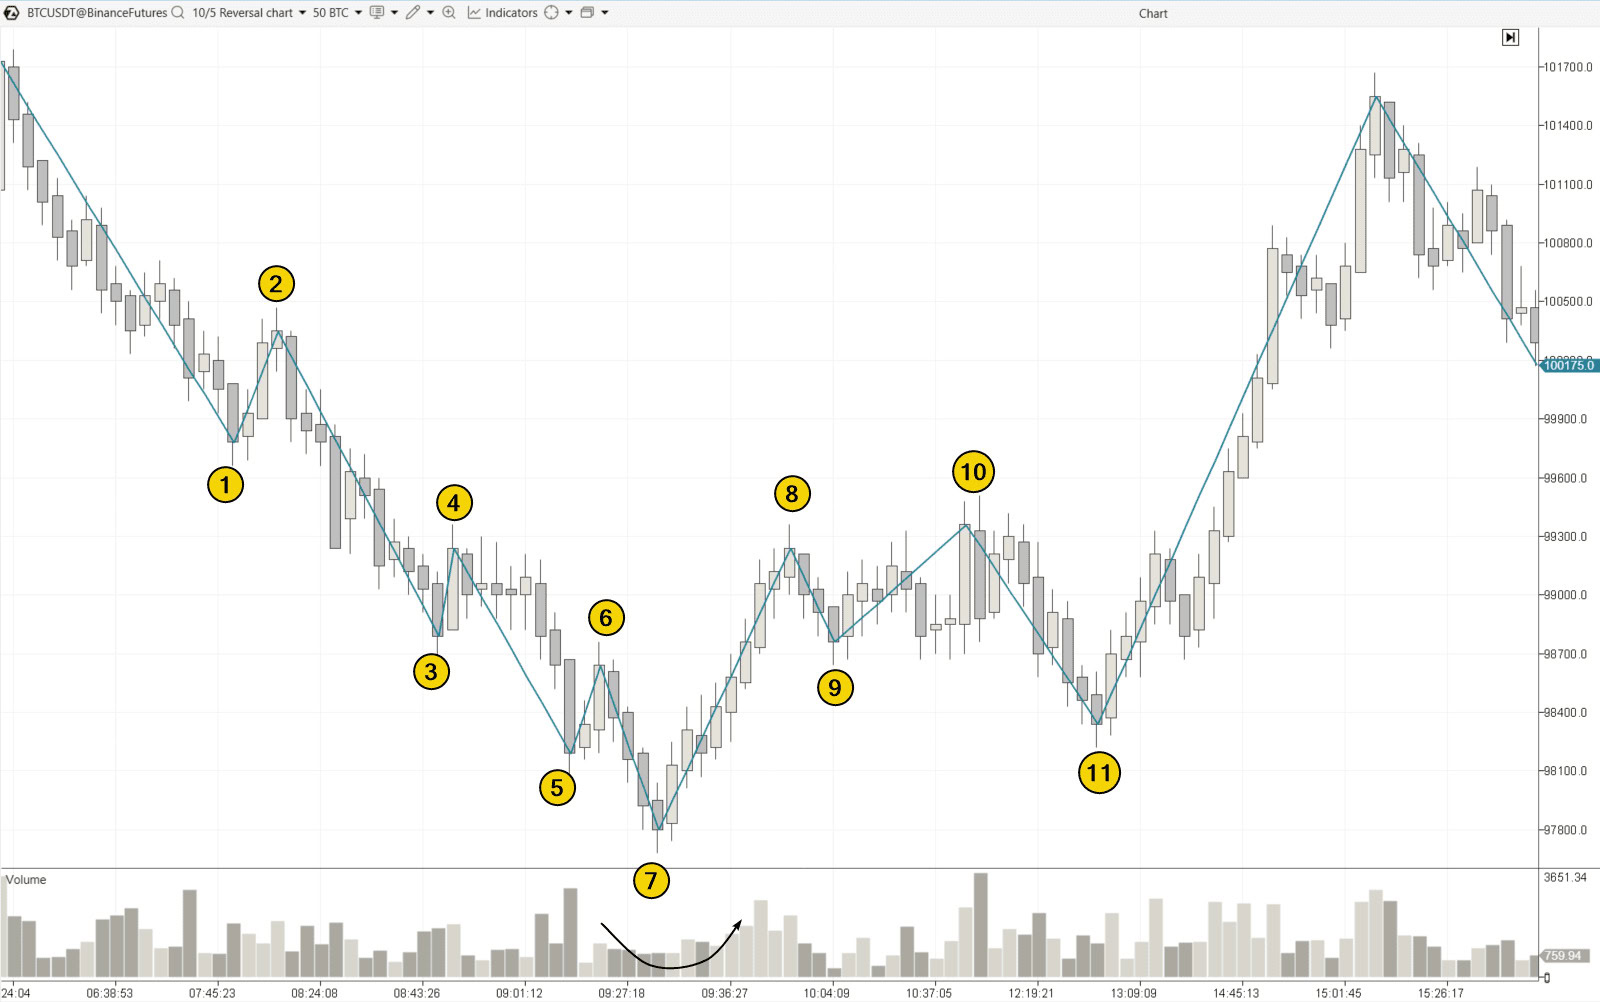
In this case, ChoCh formed when the price broke above the high at (6) while moving toward the peak at (8). The bears’ failure to push the price below the low at (7) added further confirmation that the downtrend lost its momentum.
How to Identify ChoCh
In a downtrend (Lower Highs and Lower Lows):
- A breakout through the last Lower High (LH);
- The price’s inability to surpass the last Higher High.
Analyzing the vertical volume histogram can provide additional insights. If trading volume decreases during a price decline and increases during a price rise (as shown by the arrow on the chart above), it is a strong indication that the ChoCh forming is valid.
For an uptrend (Higher Highs and Higher Lows):
- A breakdown through the last Higher Low (HL);
- The price’s inability to surpass the last Higher High.
To spot the ChoCh pattern in trading, you might find the ZigZag indicator, Fractal indicator, and line chart helpful, as they provide a clearer, simplified view of price movements.
Learn more about ChoCh in this video on our YouTube channel:
How to Interpret ChoCh in Trading
Initially, ChoCh in trading is seen as an early signal of a trend reversal.
Example of a bearish ChoCh. On the NQ futures chart, the price drops to point 9 (below the low at 7) while the peak at 8 (lower than the high at 6) suggests the formation of a bearish ChoCh, signaling a potential shift from the bullish trend (clearly visible from the extremes between points 1 and 6):
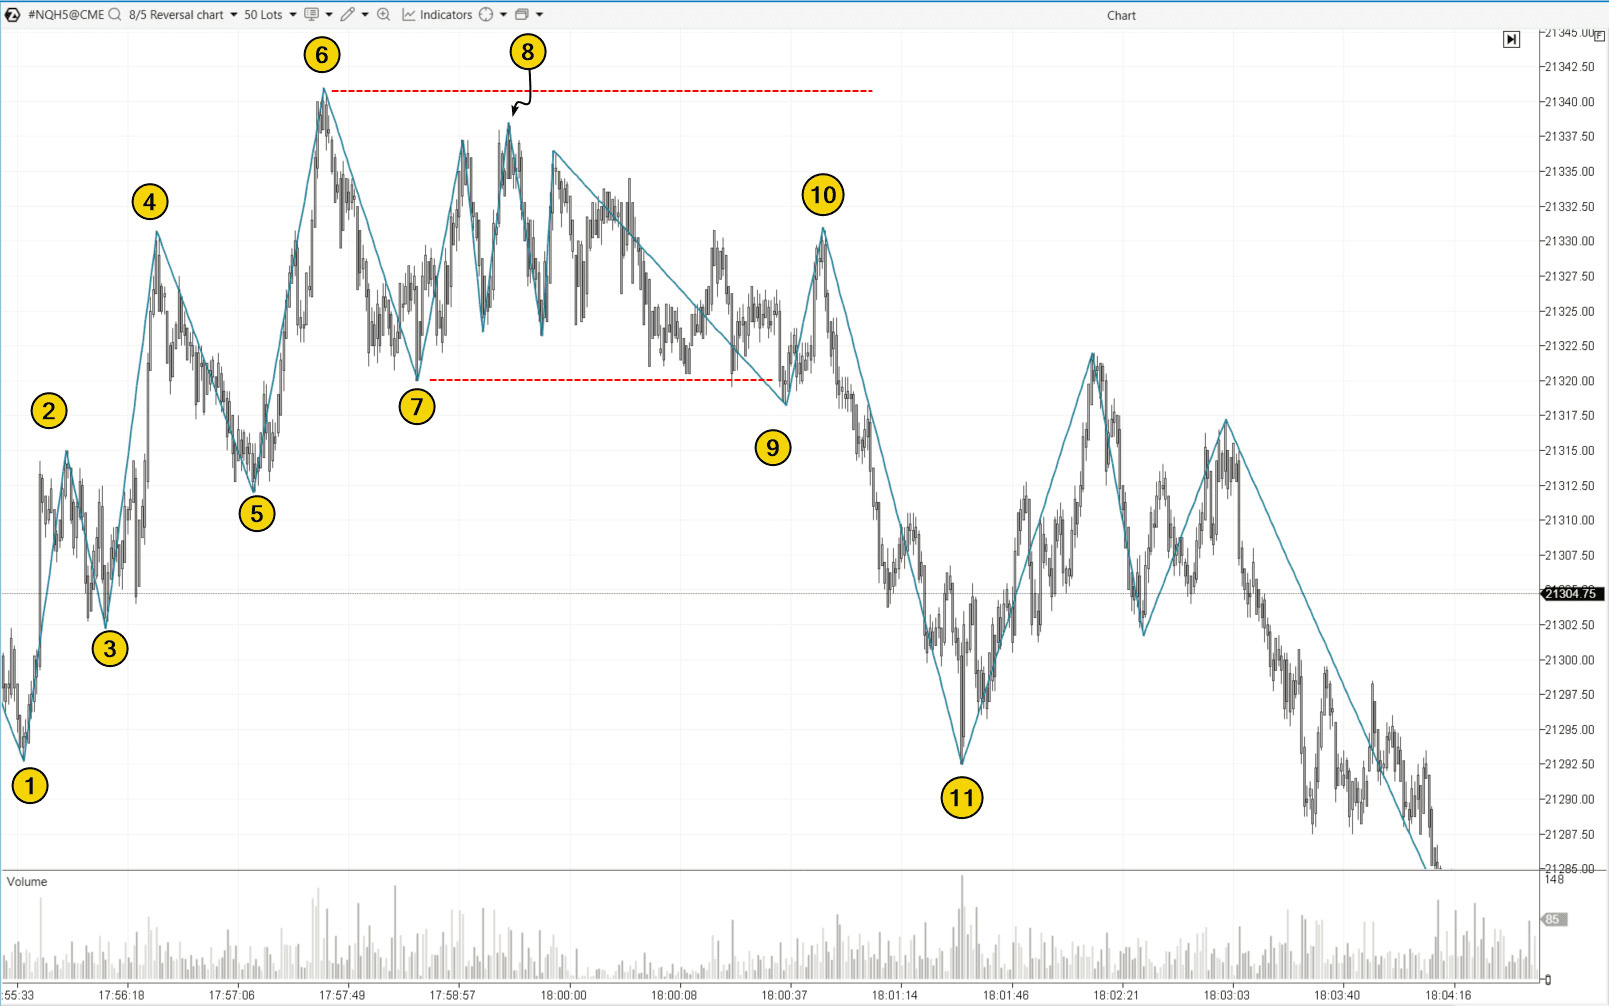
The next peak (10) ended up being lower than the previous one. And the drop from 10 to 11 shows signs of a structure break (BOS).
Alternative Interpretation of ChoCh
As you probably know, the concept of mirror levels is widely recognized in technical analysis (where support or resistance, once broken, changes roles).
The same applies to ChoCh. When you spot signs of a ChoCh forming in the market structure, it might not indicate a trend reversal but rather a continuation of the trend with renewed momentum.
Example: On the oil futures chart (CL, CME data), you can see the price action from mid-January 2025.
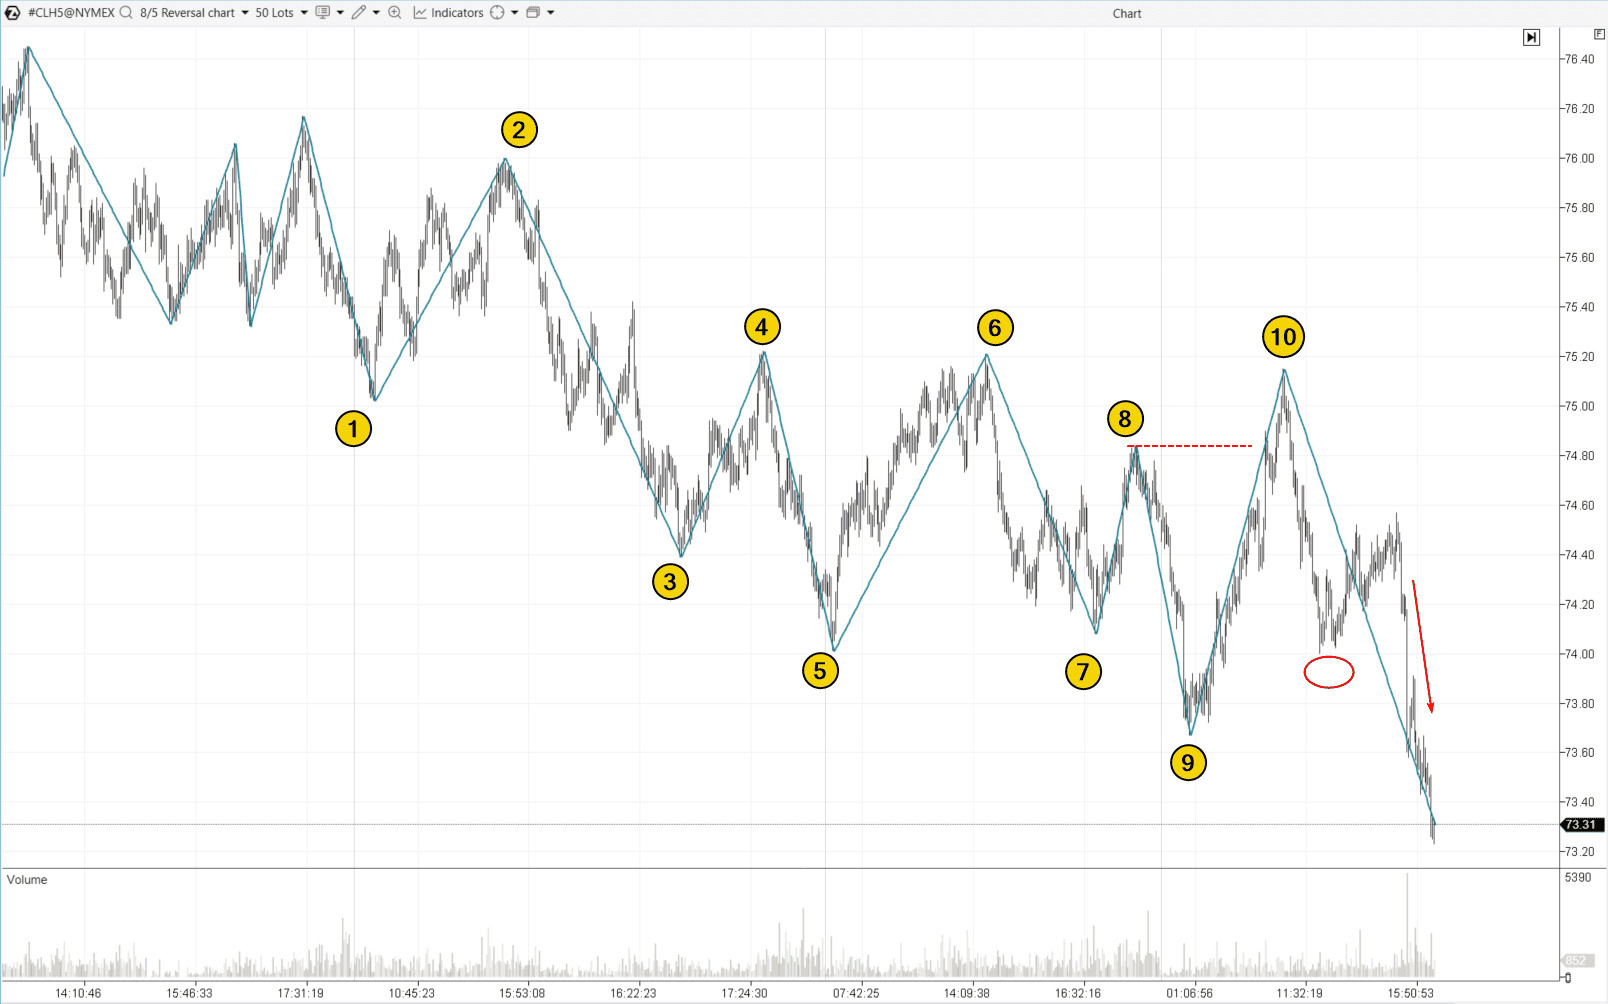
The chart tells the following story:
- based on the extremes from 1 to 9, the trader could reasonably assume that the market was in a bearish trend (with the structure of LH and LL);
- the price rise to point (10), which is above peak (8), could be seen as a ChoCh and a sign that the market is shifting from bearish to bullish;
- the intermediate low (marked with a red circle) seemed like it would be the first HL (higher low) in the new uptrend …
However, the situation played out differently. A sharp bearish impulse (shown with the arrow) broke the low at (9). As a result, the peak at (10) became a bull trap – emergency long position liquidations helped push the price below the $74 level and further down to $72.60 (not shown on the chart).
This example shows that ChoCh is not a guarantee of a trend reversal; it is just an indicator that may or may not work (and could potentially lead into a trap). That is why it is essential to carefully analyze the context and use additional tools for more reliable information.
How to Trade ChoCh
Change of Character (ChoCh), a signal for a possible trend reversal, can be used both for entering trades and taking profits or exiting positions.
Let’s assume the trader has an open position in the direction of the trend. In this case, ChoCh will likely close the position automatically if the trader uses trailing stops that follow local extremes.
How to trade using the ChoCh pattern? Here is one strategy for opening a position (e.g., a short trade):
Step 1: Identify the trend. Let’s assume the price is forming an uptrend (the market structure looks like: HH-HL-HH-HL).
Step 2: Identify ChoCh. The price then drops below the previous HL, with signs that the market is approaching the expected liquidity zone.
Step 3: Look for the Fair Value Gap (FVG) on the downward candles. The FVG pattern may form:
- shortly after ChoCh;
- after some time, as more extremes are formed;
- with or without signs of a Market Structure Shift (MSS).
Step 4: Price returns to test the FVG. Inner Circle Trader, the strategy’s author, explains that this is when the price range of the FVG gets balanced. This test creates an opportunity to enter a short position with a target near the opposite liquidity zone (with a protective stop-loss outside the FVG area).
The same applies to long positions.
It is important to consider the market context and use advanced volume analysis tools. This will help confirm that the market is indeed moving in the expected direction, reduce risks, and increase confidence in the decisions made.
Applying ChoCh in Forex Trading
The chart below shows the market situation for euro futures: on the left, a line chart (Reversal type), and on the right, a footprint chart that provides a detailed view of the long entry setup.
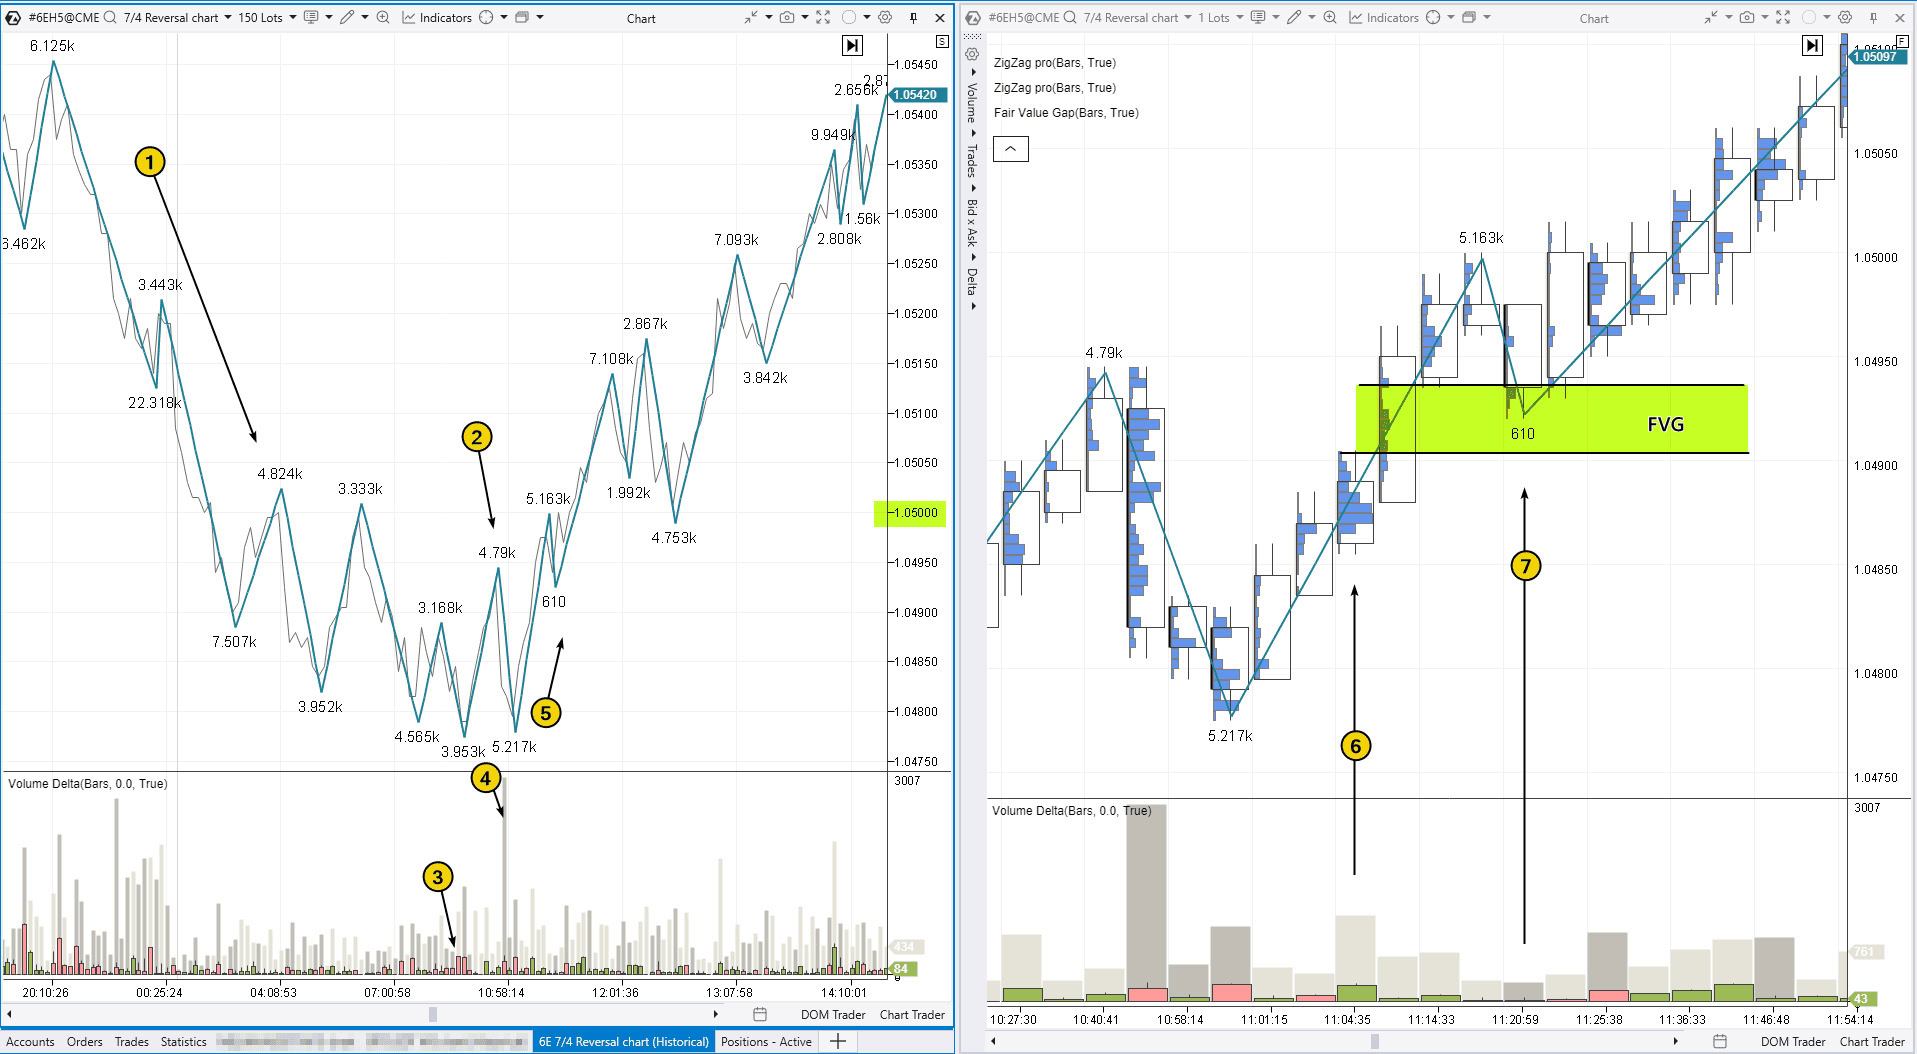
The market development on the chart unfolded as follows:
(1) Bearish market structure. The sequence LH and LL continued until the price dropped below the 1.0500 psychological level.
(2) Formation of ChoCh. The first higher high suggests a potential trend reversal and a shift in market sentiment toward bullish.
(3) A spike in negative Delta values confirmed that this ChoCh was likely a genuine signal of a trend change.
(4) Additional confirmation came from a volume spike during the downward move, which failed to push the price lower. If this spike reflected Smart Money selling pressure, why did the price reverse upward (5)? This bullish signal suggested switching to a lower time frame or a footprint chart to find a more precise long entry point.
(6) The price increased after a volume cluster—a bullish behavior. At the same time, an FVG pattern (marked in green) formed. A test of the FVG (7) provided an opportunity to enter a long position.
Example of ChoCh in Cryptocurrency Trading
Below is an example of two ChoCh patterns in the cryptocurrency market. The chart illustrates the price action of DYDX futures, based on data from Binance.
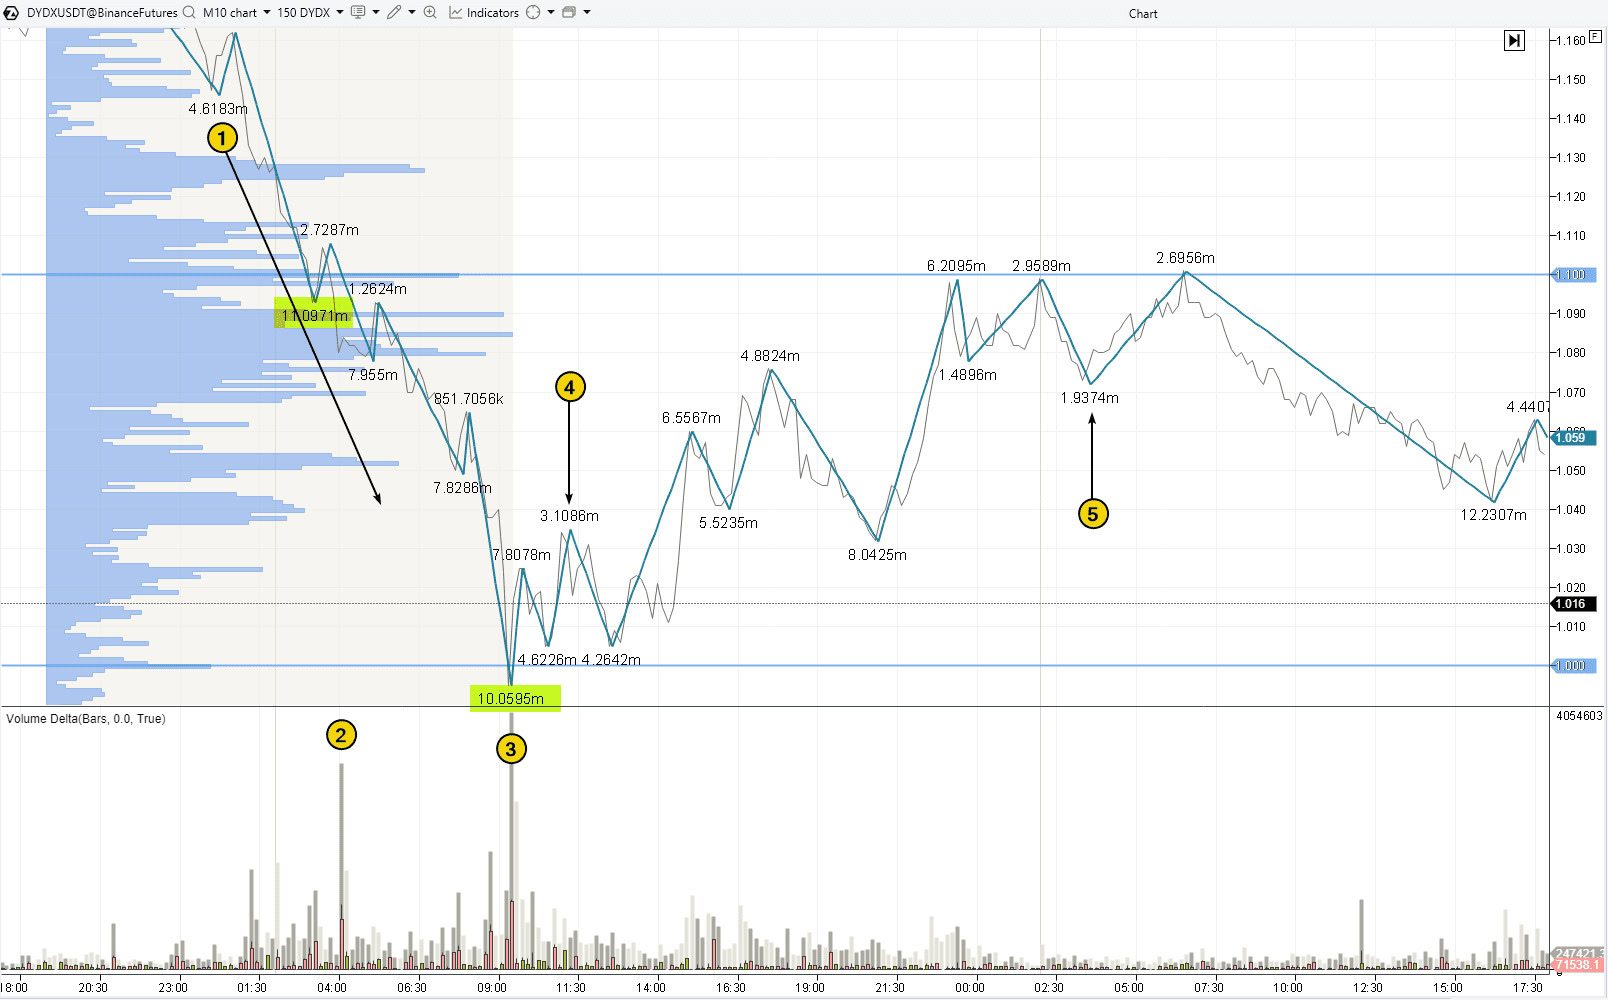
(1) Bearish structure with LHs and LLs. Notice the volume spike (2) as the price crossed the 1.100 level, which led to a total trading volume of 11 million during this downward move.
(3) Another surge in volume, this time at the psychological level of 1.000. The fact that the price quickly rebounded above this level suggests strong buying activity, while the high volume indicates that the downward wave may be coming to an end, with a peak in selling activity.
(4) A bullish ChoCh is a signal to close short positions (if any) and look for a long entry.
As the chart shows, after the bullish ChoCh, the price moved back up to the 1.100 level, where a bearish ChoCh (5) had already formed.
Can ChoCh Reflect Market Sentiment in Cryptocurrencies?
On its own, ChoCh is not a direct indicator of crowd sentiment or fundamental factors like news, institutional buying, or changes in liquidity. The Delta indicator, however, can provide more specific insights:
- a positive Delta signals a shift to bullish sentiment;
- a negative Delta indicates bearish sentiment.
Delta values should not be extreme:
✓ A very high positive Delta may suggest a FOMO (Fear of Missing Out) effect in trading, which is a bearish sign.
✓ A very low (negative) Delta can indicate panic selling, which, on the contrary, is a bullish signal.
Nevertheless, the Change of Character (ChoCh) pattern can serve as an indirect signal of a shift in sentiment, as it occurs when the structure of a trending market breaks down.
Example of ChoCh on the Stock Market
The screenshot below illustrates a setup for entering a long position after the formation of the ChoCh pattern. This example uses a futures contract on the S&P 500 index: on the left is the market structure chart, and on the right is the search for a low-risk entry point using the footprint chart.
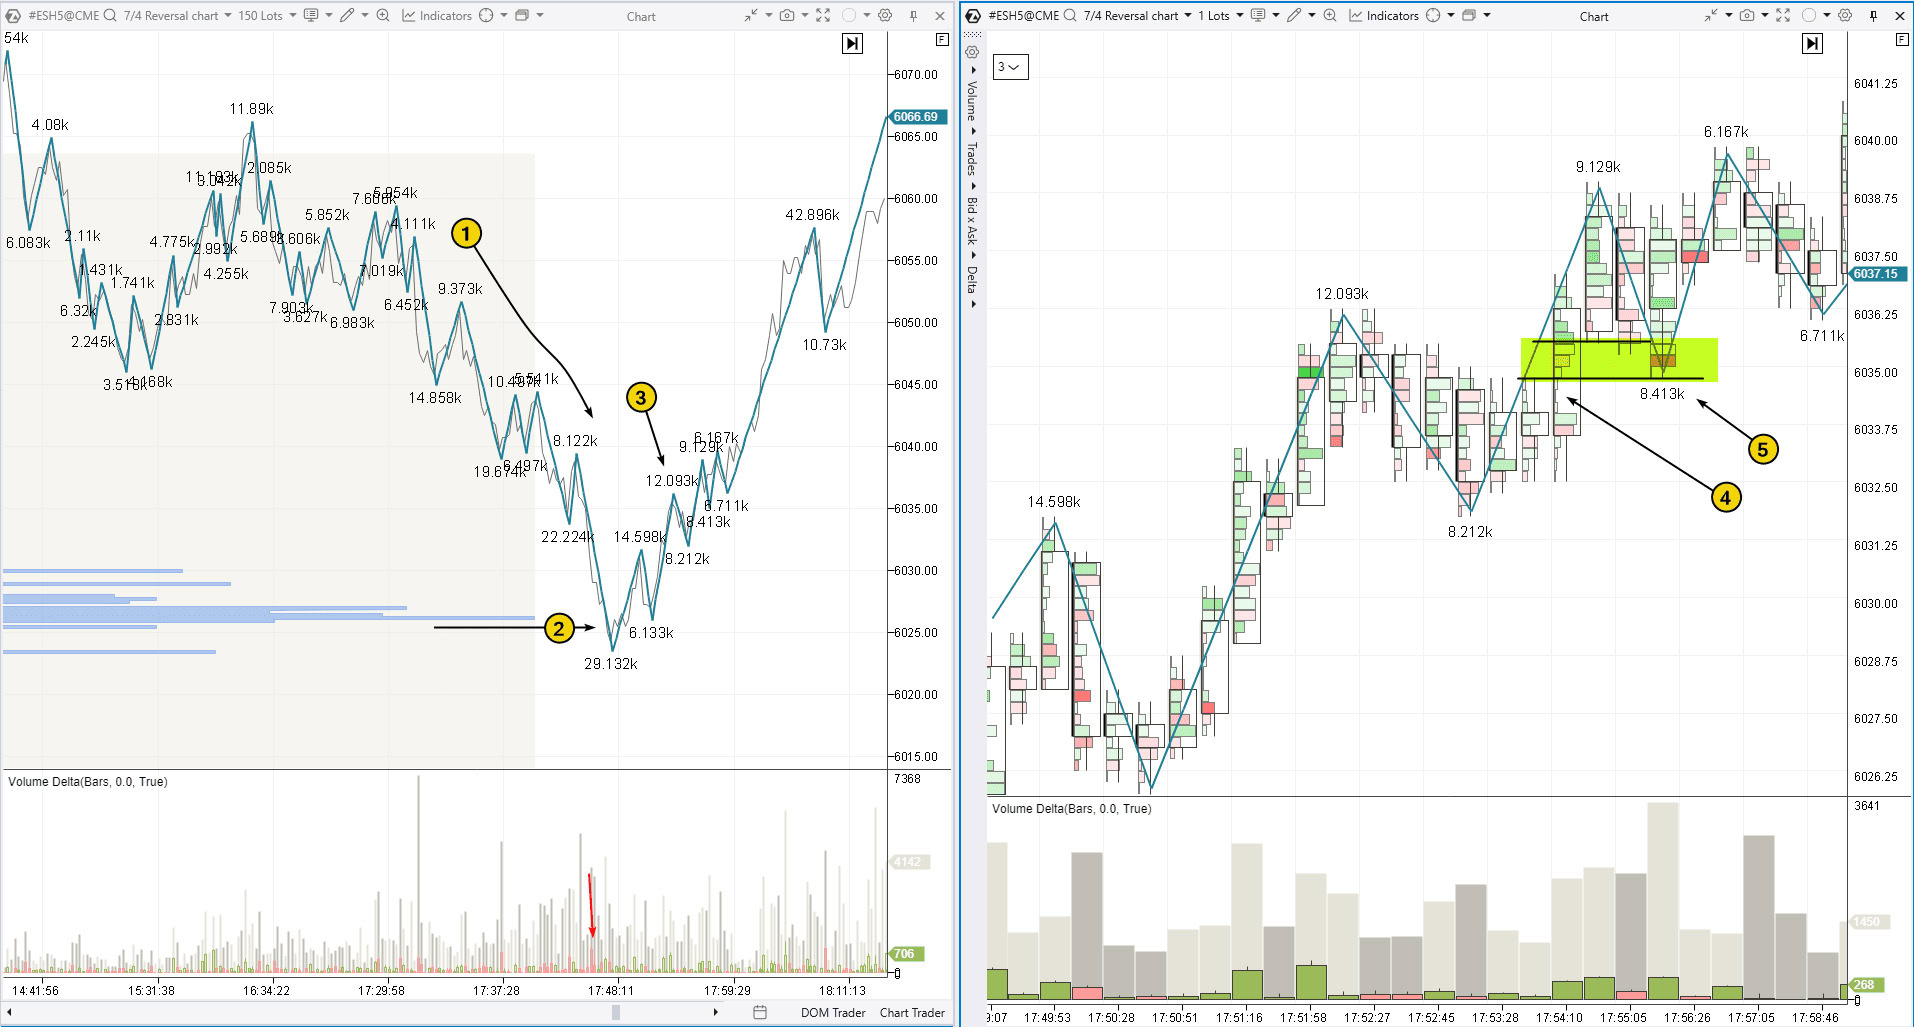
(1) Downtrend with the formation of a sequence of LH and LL.
It is important to note that the trend concluded at levels where high trading volumes had previously been recorded (as indicated by the market profile). These levels (2) can be seen as a liquidity zone – if traders had opened long positions earlier, they may now close them as the price returns, fearing that PnL (floating profits) might turn into losses. This provides a “resource” for Smart Money, looking to form a long position.
As the price recovers after visiting the high-volume levels, the ChoCh pattern (3) forms on the chart, giving the trader a reason to switch to a lower time frame and/or footprint chart to analyze the situation in more detail and find an accurate low-risk entry point.
The footprint highlights the formation of an FVG zone (marked in green), with the narrow profile (4) confirming that buyers had the upper hand, as the price moved up easily without pausing at any level. As a result, opening a long position during the FVG test (5) was a well-supported decision. The target was the liquidity zone above, for example, just beyond a key intraday high.
Risks Associated with Trading the ChoCh Pattern
Misinterpretation of the market structure. ChoCh can occur as part of normal market fluctuations, not necessarily indicating a genuine trend reversal. This can be made worse by subjective judgment, especially if the trader lacks enough experience to properly identify the market structure and liquidity zones.
False signals. Not all swing high/low breakouts indicate a trend reversal. Even if the ChoCh pattern looks convincing, there is no guarantee the trend will reverse. Even the most reliable patterns can result in losses, therefore, using stop-loss orders is essential.
Timing issues. The nature of market fluctuations that lead to the formation of ChoCh means that the trader may not have a clear understanding of when to place the order. Examining ChoCh examples across different charts shows that the optimal entry may come almost immediately, while in other cases, it may take time (and there is no certainty it will happen). This can lead to undesirable outcomes, such as entering a trade too early or missing an opportunity.
Psychological pressure and emotions. The expectation of a trend reversal can lead to the fear of missing out (FOMO) or the desire to average down a losing position. If the trader is focused on buying, they may be inclined to see a bullish ChoCh even when it appears quite ambiguous.
Download ATAS – a platform that helps analyze the market with advanced volume indicators. It can be a crucial step in moving from a phase of losses and poor decisions (including mistakes made while trading the ChoCh pattern) to a more consistent growth of your capital.
Distinguishing Features of ChoCh and Other ICT Patterns
Traders new to the Smart Money Concept strategy often find the terminology difficult to understand. To help clarify the differences between ChoCh and other ICT patterns, here are brief explanations of the key concepts.
Differences Between ChoCh and Break of Structure (BOS)
Both patterns appear during a trend reversal, but their interpretations are opposite:
- ChoCh → a reversal pattern indicating a potential trend change.
- BOS → a trend continuation pattern, suggesting that the current trend may continue.
Differences Between ChoCh and Market Shift (MSS)
ChoCh is a local signal of a trend reversal, which may be temporary or indicate the beginning of a new direction.
In contrast, a Market Structure Shift (MSS) appears on the chart as a more significant impulse, confirming the actual change in trend.
How to Trade Using ChoCh Signals
Trading with the Change of Character (ChoCh) pattern requires attention to detail, discipline, and a solid understanding of market structure. To effectively incorporate this pattern into your strategy, it is crucial to identify trend shifts in the right market context, considering liquidity and trading volumes.
The ATAS platform provides all the necessary tools to gain a competitive edge and master trading with Smart Money Concept patterns:
- Historical data and market visualization. ATAS enables traders to load detailed tick history and study the price behavior during structural shifts. This helps visualize how ChoCh patterns form, how they interact with liquidity zones, and how trading volumes evolve during these transitions.
- Advanced indicators for confirmation. ATAS offers tools such as footprint charts, cumulative delta, vertical and horizontal volume analysis, which help filter out false ChoCh signals and identify more precise entry points.
- Market Replay training. Practicing in a market simulator is one of the most effective ways to refine trading skills. With ATAS, you can replay historical data in real time, test ChoCh in different market conditions, and analyze mistakes without risking real capital.
To try the simulator, download the ATAS platform for free, install, and launch it, and then:
- Open a chart of a financial instrument.
- Click on the Market Replay button in the main ATAS menu.
- Activate the Replay mode (the icon should turn green).
- Adjust settings (date and data type).
- Start the replay and practice analyzing market structure.
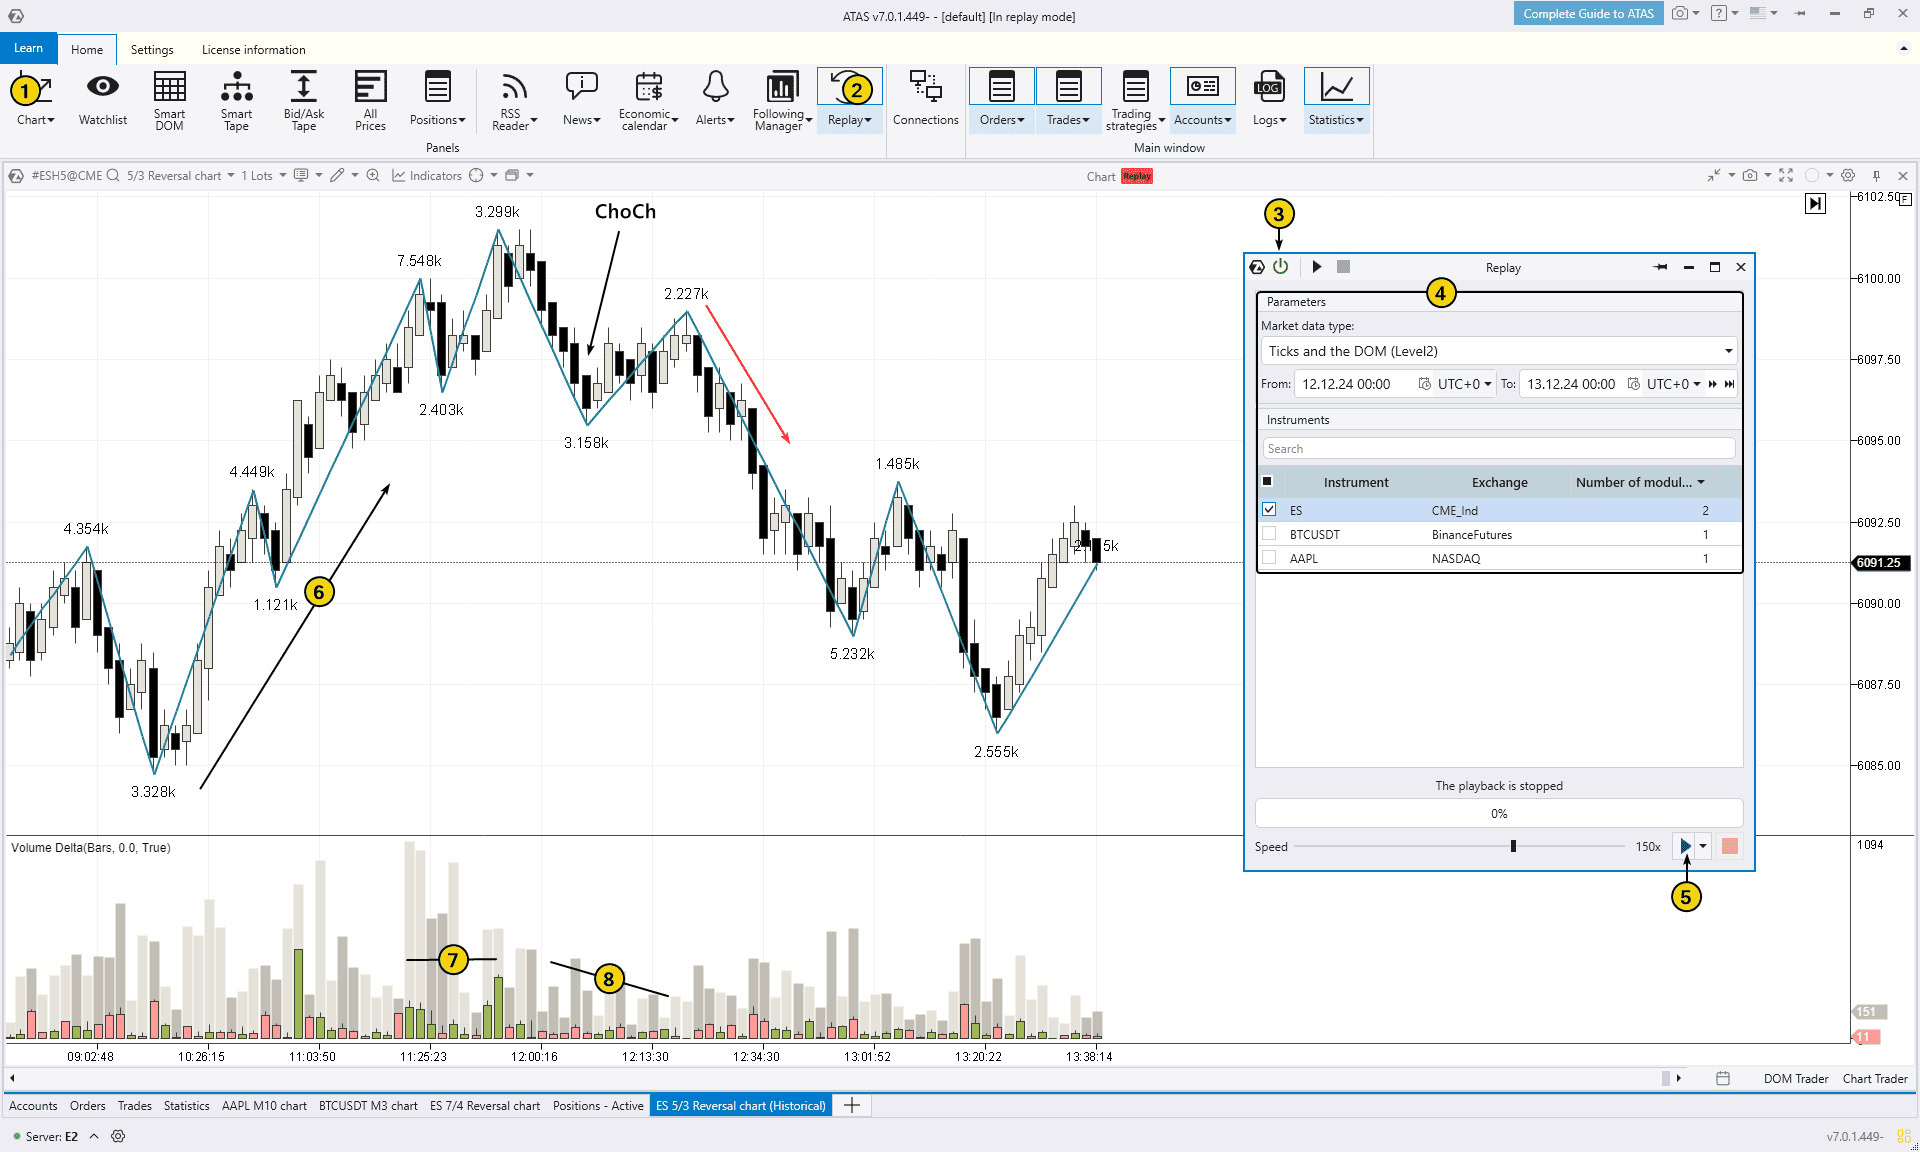
The chart above illustrates another example of the ChoCh pattern:
(6) The price was rising, forming a bullish market structure. However, at a certain point, a trader could identify a ChoCh.
Was this a reliable signal? Most likely, yes. Analyzing volume activity reveals increased trading (7), with market buyers taking the initiative. If this was driven by Smart Money, why did the price then decline, forming a ChoCh?
How should one trade in this situation? A short entry may be considered by switching to the footprint chart or lower time frames once the price begins to decline (indicated by the red arrow). An FVG setup with confirmation from the market profile is a reasonable entry point (as a narrow profile often aligns with fair value gaps).
FAQs on the ChoCh Pattern
Is ChoCh applicable to all trading markets?
Yes, the Change of Character (ChoCh) pattern can be applied across all financial markets, including forex, stocks, futures, and cryptocurrencies. Since it is based on the market structure and liquidity analysis, it is a versatile tool. However, trading based on the ChoCh pattern can yield varying results, depending on both the asset’s volatility and the trader’s individual approach.
How reliable is ChoCh as a trading signal?
No pattern, including ChoCh, guarantees a trend reversal with absolute certainty. However, ChoCh can be a valuable tool for identifying potential trend shifts, particularly when combined with liquidity analysis, volume studies, and other Smart Money Concept components, such as Fair Value Gaps (FVG). False signals are possible, especially on lower time frames, therefore, it is advisable to use additional confirmation methods.
Can beginners use ChoCh effectively?
Beginners should approach ChoCh with caution, as accurately interpreting this pattern requires experience. However, with a systematic approach and consistent practice, traders can develop the skills needed to use it effectively.
For those new to trading, it is recommended to:
- Practice with historical data (Market Replay).
- Analyze volume and liquidity to confirm signals.
- Explore the Wyckoff Method, as Michael Huddleston’s (Inner Circle Trader, ICT) approach may be a modern adaptation of Richard Wyckoff’s trading principles, developed over a century ago.
What is the ICT trading method?
ICT (Inner Circle Trader) is the alias of Michael Huddleston, an American trader who runs a popular YouTube channel focused on trading education. He developed the Smart Money Concept (SMC) strategy, which centers around analyzing the market structure and the behavior of large market participants. This method highlights key elements such as liquidity zones, Fair Value Gaps (FVG), Order Blocks, and the idea that price movements follow algorithmic patterns.
Conclusion
Trading with the Change of Character (ChoCh) pattern is an integral part of the Smart Money Concept (SMC) strategy, helping traders identify potential trend reversals. A solid understanding of key elements like liquidity zones, market structure, and Fair Value Gaps (FVG) enables traders to create a well-informed strategy and pinpoint high-probability entry points.
Advantages:
✔ Early detection of market shifts. ChoCh enables traders to spot potential trend reversals before they become obvious to the wider market.
✔ Flexibility. The ChoCh pattern can be applied on both higher and lower time frames, making it adaptable to different trading styles.
✔ Compatibility with volume analysis. Market profiles, footprint charts, Delta indicator, and other tools can offer additional confirmation for trade decisions.
Disadvantages:
✘ Takes time and practice to master. Without proper experience, it can be difficult for traders to accurately identify the market structure and its breaks.
✘ Sensitive to false signals. Sometimes, ChoCh can signal only a short-term correction, which can confuse traders and lead them into traps.
The ATAS platform provides traders with powerful tools to improve their ability to trade using the ChoCh pattern. Features like Market Replay, footprint, and cumulative Delta help you analyze the market more effectively and gain a competitive edge, making your trading more accurate and profitable.
Download ATAS. Once you install the platform, you will automatically get the free START plan, which includes cryptocurrency trading and basic features. You can use this plan for as long as you like before deciding to upgrade to a more advanced plan for additional ATAS tools. You can also activate the Free Trial at any time, giving you 14 days of full access to all the platform’s features. This trial allows you to explore the benefits of higher-tier plans and make a well-informed purchasing decision.
Do not miss the next article on our blog. Subscribe to our YouTube channel, follow us on Facebook, Instagram, Telegram or X, where we publish the latest ATAS news. Share life hacks and seek advice from other traders in the Telegram group @ATAS_Discussions or on Discord.
Information in this article cannot be perceived as a call for investing or buying/selling of any asset on the exchange. All situations, discussed in the article, are provided with the purpose of getting acquainted with the functionality and advantages of the ATAS platform.


