
A channel in trading is a technical analysis tool commonly and effectively used by traders. The definition of a channel in technical analysis involves the construction of support and resistance lines that define the price movement zone.
This article is intended for beginners. Below, you will find a comprehensive guide to understanding and using trading channels together with other tools of the ATAS platform. To give you a complete understanding of channel trading, we will cover basic information, pros and cons, as well as detailed strategies for using channels.
Read more:
What Are Trading Channels?
In simple terms, price (trend, trading) channels are combinations of at least two lines: one support line and one resistance line. These lines form the basis of any trading channel, playing a crucial role in understanding market psychology and price movements.
- The support line. It indicates price levels where a downtrend may pause due to an accumulation of demand. This is where the price typically stops falling and may even bounce back up.
- The resistance line. The mirror image. This line indicates price levels where an uptrend is likely to pause or even reverse due to an accumulation of supply.
Why Do Trading Channels Work?
Let’s illustrate this with a simple example using apples. Their price is influenced by the following factors:
- Seasonality. In August, apples become cheaper due to the new harvest, while they become more expensive in winter.
- Inflation. Year after year, the price of apples increases.
As a result, the following picture emerges:
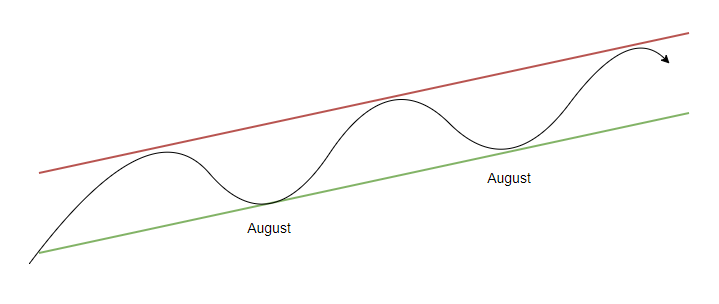
Of course, this is exaggerated. The price of financial assets such as Bitcoin, oil futures, and so on is influenced by a vast number of long-term and short-term factors. They are automatically reflected in price behavior, which makes it possible to create trading channels on a chart.
Channels show changes in supply and demand under the influence of various fundamental factors.
The idea of trading channels is to help assess trends and identify areas where price may find support and resistance.
Types of Trading Channels
- Ascending (bullish) channels are created based on higher highs and higher lows;
- Descending (bearish) channels are created based on lower highs and lower lows;
- Horizontal (flat) channels are applicable in markets where there are no clear trends.
Additionally, channels can be divided into:
- Long-term channels. They are often used by investors aiming to profit from major market trends. Long-term channels can span weeks, months, or even years.
- Short-term channels. They are typically used by day traders or those seeking to profit from small market movements within a shorter time frame. Short-term channels can last from minutes to days.
Example. The daily chart of TSLA stock below shows a long-term descending price channel that has not been broken yet. Inside it, there is a short-term channel indicating a period of price increase. By changing the timeframe, you can find even more smaller channels within the larger ones.
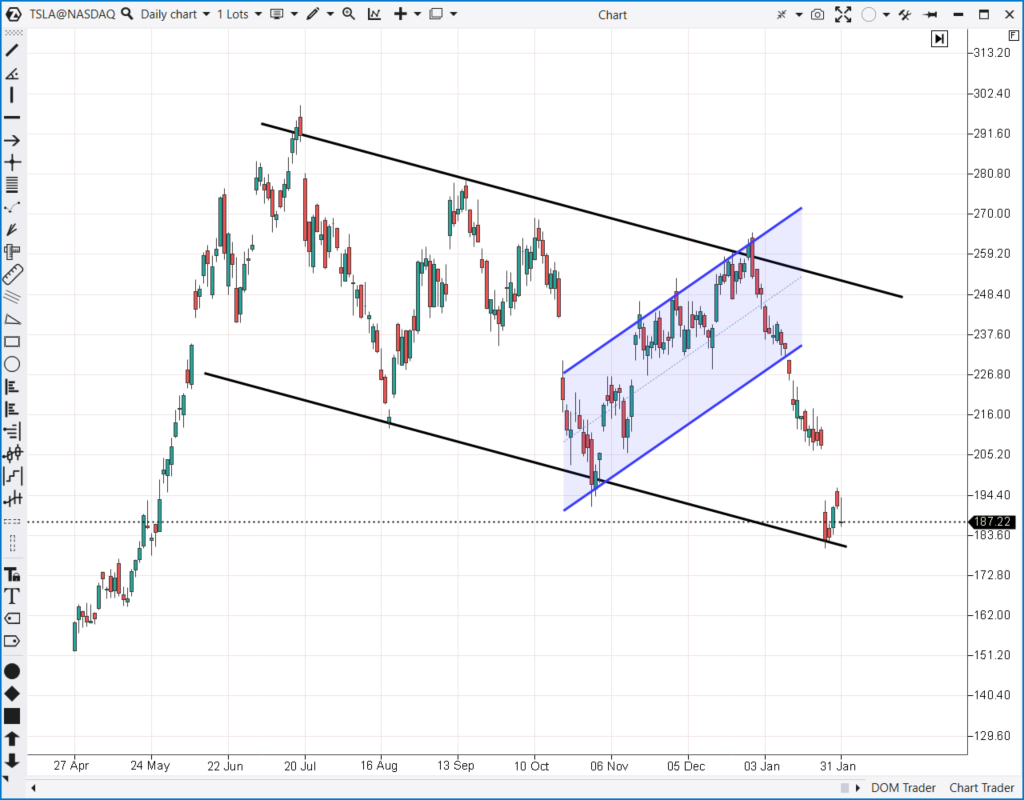
It is worth noting that when creating channels, the lines are always parallel. However, if the lines converge, you are probably looking at one of the patterns of technical analysis (such as a triangle or wedge).
Creating Trading Channels With ATAS
ATAS provides specific drawing tools for creating trend channels.
Example. A chart of E-mini S&P-500 futures.
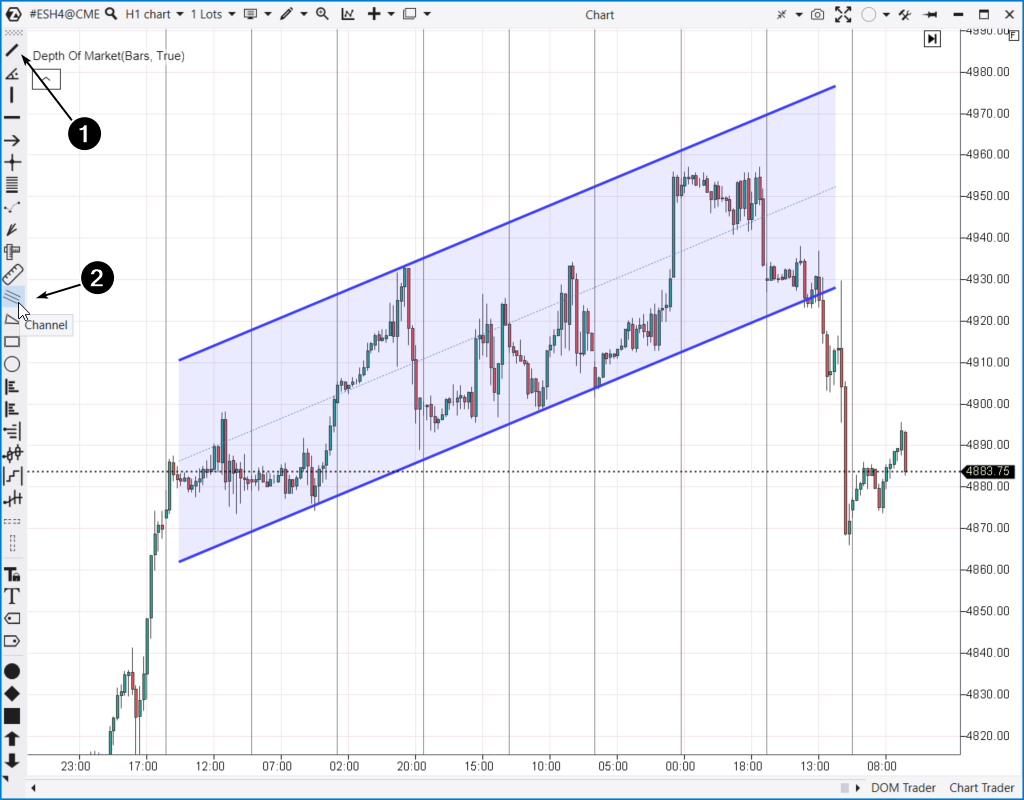
Numbers indicate:
- A simple trend line. You can draw one line and then copy it (Ctrl+C) and paste it (Ctrl+V). This way, you will obtain a second parallel line for creating the channel.
- The main tool for drawing channels. For convenience, the channel is created with a colored background and a median line. When changing the angle of the first line, the angle of the second one will automatically adjust.
The peculiarity of creating channels lies in the absence of a single, specific step-by-step instruction. For instance, VSA creator Tom Williams advised using the following methodology:
- To create a bullish channel, find two rising lows and draw a support line through them.
- Draw a parallel resistance line through the intermediate high between the identified lows.
- The trading channel is ready!
The key rule in creating a trend channel is that the price should consistently and distinctly rebound from the channel boundaries, confirming its validity.
However, in practice, it is important to consider exceptions:
- the more times the price rebounds from the channel boundary, the more noticeable the channel becomes to other market participants → it increases the chances of a breakout scenario;
- the price ‘has the right’ to experience a false breakout of the channel boundary. Given the volatility of popular markets, traders should allow for some flexibility in price movement when creating a trading channel. The price should be able to make a false move and go beyond the channel boundaries. A false breakout followed by a return can also confirm the validity of the channel.
- the effectiveness of a channel line may not only be indicated by price bouncing off it but also by price balancing around this line (note point C on the chart below).
Example. To illustrate, let’s analyze a price channel on a 15-minute chart of the DAX stock index futures.
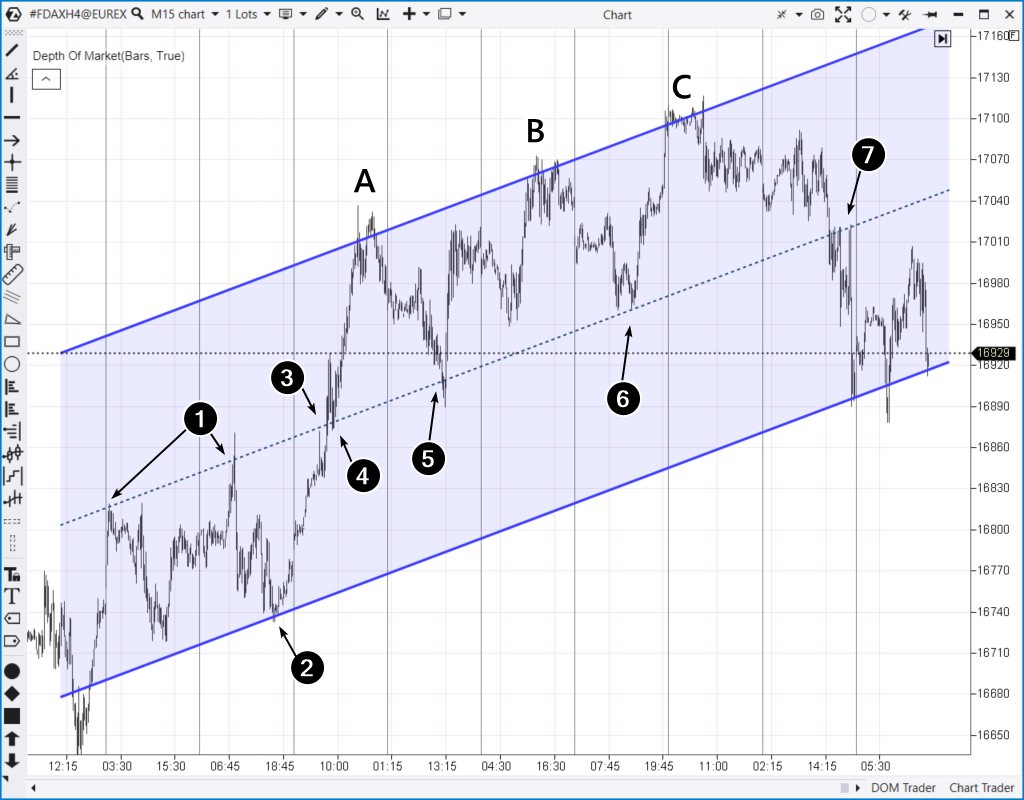
Number 1: The price formed rising highs, which could have been used to establish a resistance line. However, the second of these highs, in the shape of a spike, introduces uncertainty. Due to its formation during heightened volatility, drawing a line through the highest point is impractical.
Number 2: Formation of a low that can be used to create a support line parallel to the previously established resistance line.
Next, the price rises to the support line (3), retraces, breaks through it and tests the breakout (4). Such a formation is quite common during channel expansions. Then, the price rises to point A – you can approximately determine it by drawing a parallel line above the breakout at a distance equal to the height of the channel 1-2-3.
After forming point A, the price retraces to the median line of the channel – previously acting as resistance (1, 3), now serving as support (5).
After this, there is another reversal pattern from the resistance line into the channel (B) and a test of the median line (6).
At point C, the price reverses again from the resistance line into the channel. Moreover, it goes below the median line. The chart indicates that the price has now taken on resistance properties (7). Subsequently, the price drops to the channel’s lower boundary, which predictably supports the market.
Pros and Cons of Trend Channels
Price channels are a significant aid in a trader’s and analyst’s work, but they do not guarantee profit.
Pros
- you can more precisely identify support and resistance levels;
- you can develop your own hypothesis about future market behavior;
- you can build trading strategies;
- it assists in risk management.
Cons
- subjectivity;
- the price may test channel lines with ‘undershoot’ and ‘overshoot’, misleading market participants;
- limited profit potential in narrow ranges.
FAQ
Is it necessary to recreate channels? How regularly?
In general, yes. It largely depends on personal preferences and the characteristics of the market you are trading in. Sooner or later, channels get broken, and old ones lose their value – that is when you need to create new ones. Sentiments change, so it is better to monitor how recent price actions confirm the relevance of the created channel. If necessary (for example, when a new test occurs), you can make slight adjustments to the angle or width of the channel.
How reliable are trend channels?
Trading channels offer a structured way to analyze price movements; however, they are not infallible. Market conditions can change, leading to false breakouts or shifts that the channel may not account for. It is necessary to supplement channel analysis with other trading strategies and constant market monitoring.
Is it possible to trade only using channels?
In theory, yes. For instance, buying near support, setting a stop below support, and taking profit near resistance. However, in practice, it is more sensible to seek confirmations (such as through analysis of vertical volume on lower timeframes), consider trends on higher timeframes, psychological levels, and fundamental factors, and use other techniques – in other words, adopt a comprehensive approach. Combining various tools available in ATAS will enhance your chances of success.
How to Interpret Trading Channels
There are numerous ways to use trend channels to assess market sentiments and their changes. The interaction between price and channel lines can signal the strengthening of existing trends, their weakening, or reversals.
Weakening trend pattern. For example, the price gradually declined within the boundaries of a descending channel, consistently reaching its lower boundary. However, you then notice that the price is capable of dropping to the lower boundary (highlighted by a circle in the chart below).
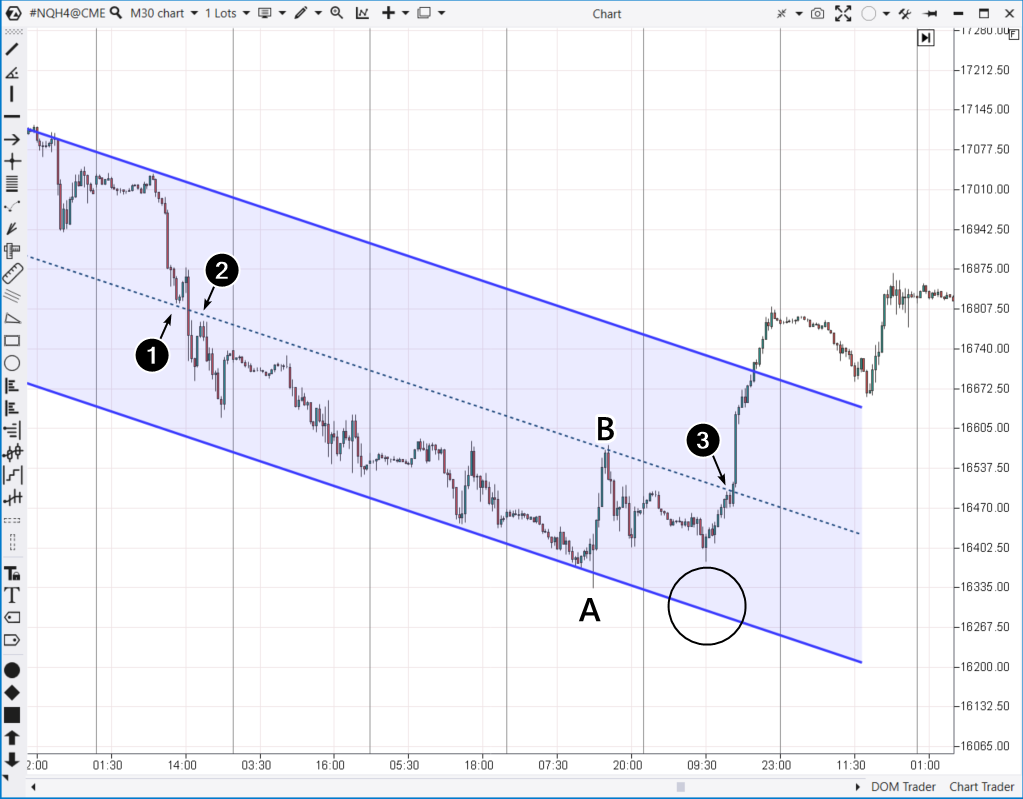
A sharp rise А→В also helps to understand that the downward trend is ready to conclude, and the price may move upwards, forming a bullish breakout of the median line.
Tests of the median line. They are indicated by numbers 1 and 2 in the chart above. Point B is also a test of the channel’s median. Number 3 indicates an attempt at testing – it proved unsuccessful: demand prevailed, so the price made a bullish breakout of the median. Tests of the median line will help you more accurately create the channel and outline its expansion contours.
Capturing liquidity as the basis for channel creation. If you study charts thoroughly enough, you will likely notice that at the initial stage of forming a bullish channel, sharp declines occur more frequently than average, and conversely, there is a tendency for sharp rises at the beginning of a bearish channel.
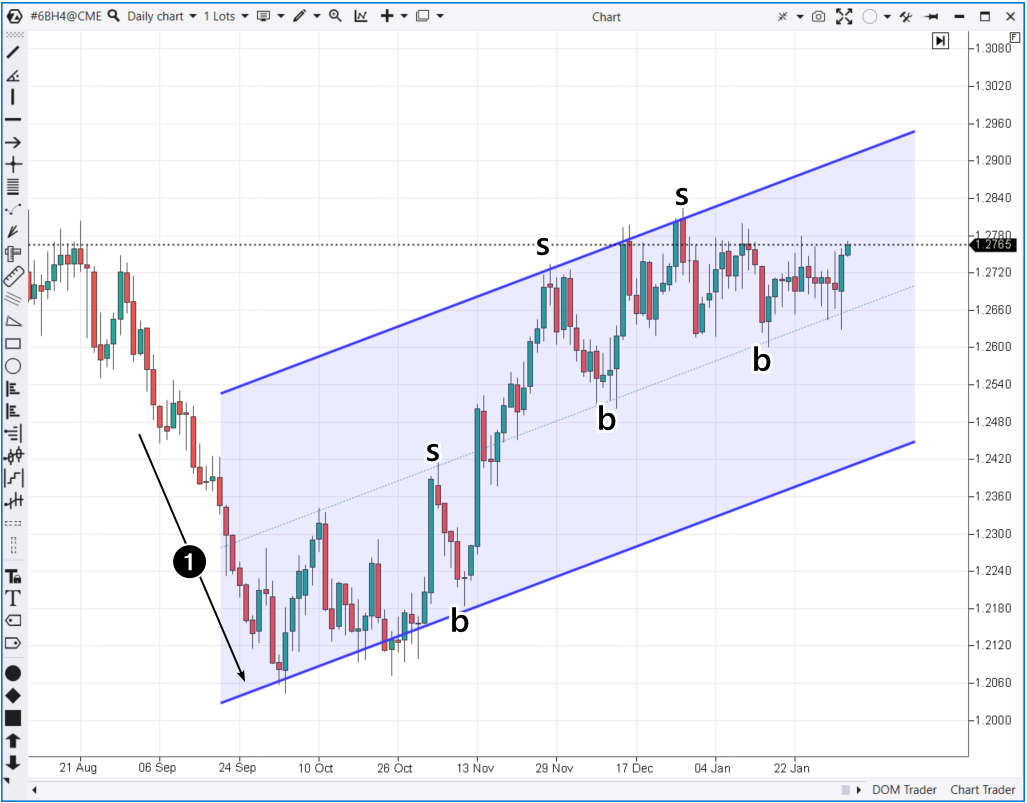
Example. On the daily chart of pound futures, number 1 indicates a sharp decline followed by the establishment of a stable uptrend. Major market players could have capitalized on panic sentiments to absorb sells from retail traders (capturing their liquidity), thereby preparing for a period of price growth.
Trading Strategies Using Price Channels
Regardless of which strategy you choose from the list below, it is important to adapt it to your trading style and acceptable risk. You should develop a clear trading plan and ensure its effectiveness through historical testing.
Strategy 1. Basic channel strategy
This strategy involves buying at support levels and selling at resistance levels, capitalizing on the price’s tendency to rebound from these levels. In other words, trading is conducted with the expectation of price returning inside the channel. The median line can also be used in this approach.
For instance, look at the chart above, points of entry into short positions are indicated by the letter s, and points of entry into long positions are indicated by the letter b.
When trading with channels:
- place stop-loss orders at a distance beyond the channel line;
- set take-profit levels to ensure that the trade has significant profit potential relative to the risk;
- use other indicators and techniques to select more precise levels for setting stops and take-profits.
Strategy 2. Breakout trading
A breakout occurs when the price breaks out one of the channel lines, i.e., moves beyond its boundaries. Traders can open new positions in the direction of the breakout, anticipating the emergence of a new trend.
The chart below illustrates an ascending channel; however, the failure of the price to reach the upper boundary may suggest exhaustion of demand. If an attempt at a bearish breakout occurs, it might have a great chance of success.
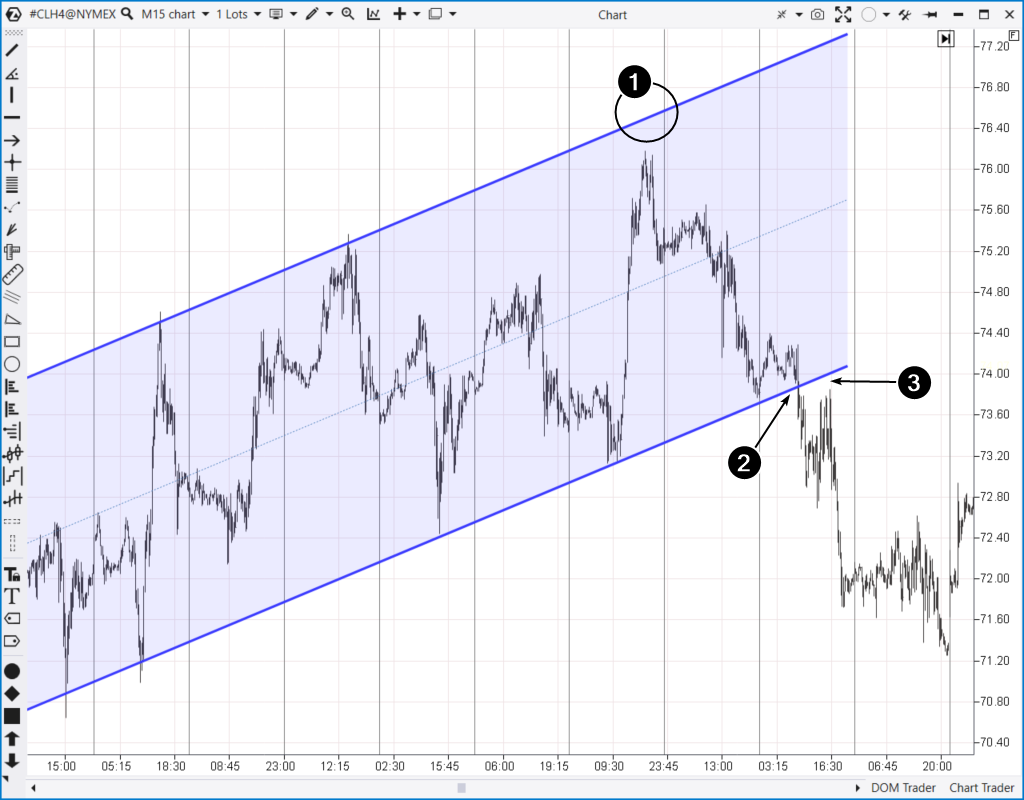
Following a weak bounce off the support line, there is a bearish breakout of the ascending channel (2).
Strategy 3. Breakout test
This strategy is closely related to the previous one but represents a more conservative approach.
The chart above illustrates a test of the bearish breakout (3), where the price approached the breakout level. The price may not reach the line of the broken channel; it may test it almost tick-by-tick or make a slight penetration.
Strategy 4. Parallel Channel Trading
This strategy involves an expanding channel. Suppose you have an ascending/descending/horizontal channel that, upon breakout, you can expand by the same width in the direction of the breakout.
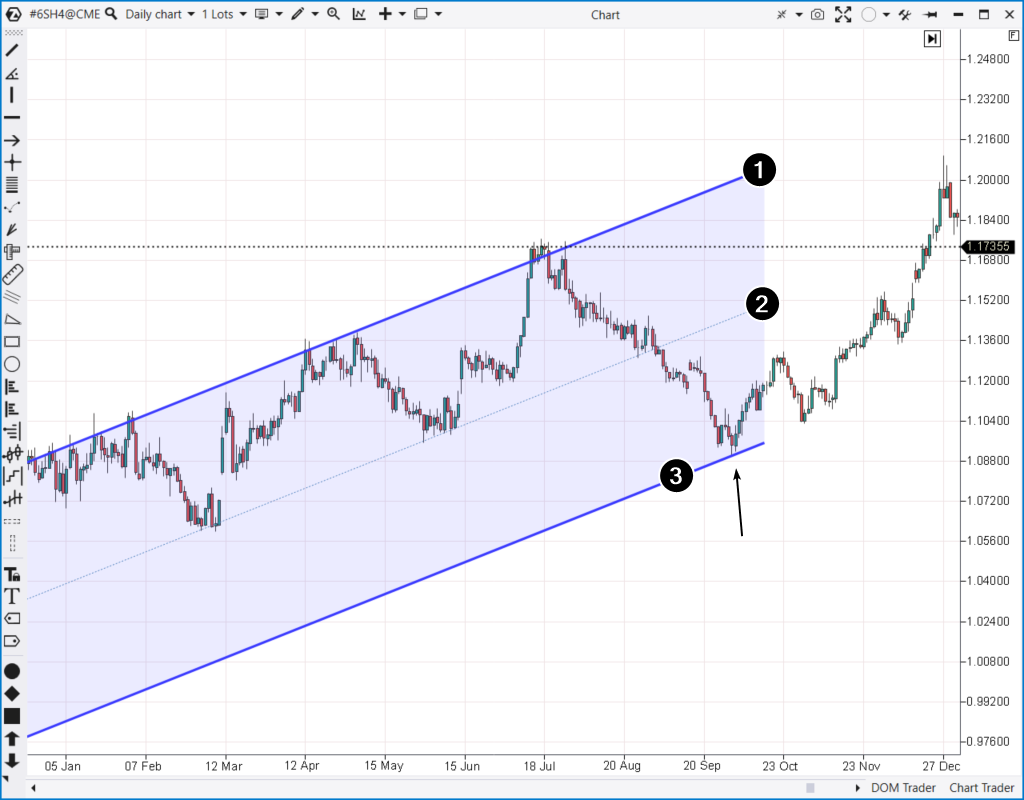
The chart of the franc futures above illustrates an ascending price channel (1-2). After the breakout of the support line (2), you can draw a parallel line (3) to look for a long entry point, anticipating a resumption of the uptrend at a ‘second pace’.
For further details on this strategy, read the article: Parallel Channels in Trading
How to Use ATAS for Trading Channels
The ATAS platform is a premium-class software. By installing the platform, you will be able not only to create channels using drawing tools but, more importantly, to use advanced volume analysis indicators to confirm signals when trading price channels.
Suppose you are trading intraday on the bitcoin futures market and tracking the price approaching the upper boundary (resistance level) of the channel – shown by line A on the 1-minute chart below.
Should you sell?
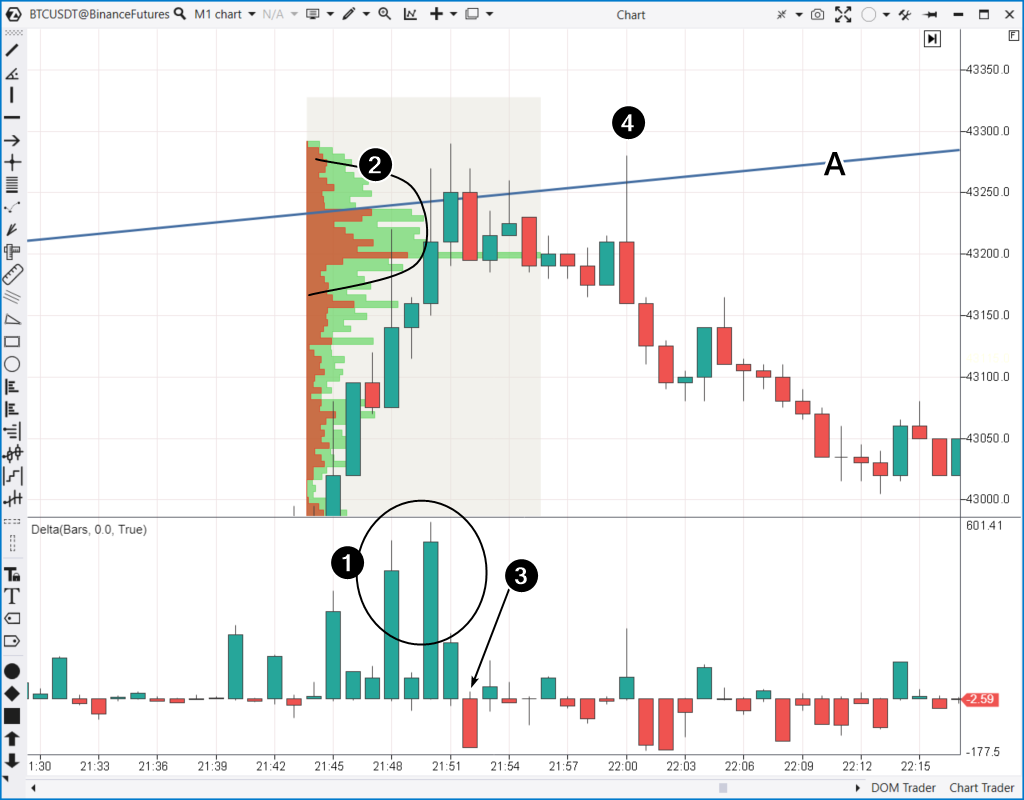
Here are some arguments that can help you decide in favor of selling:
Number 1. A spike in excessive buying on the delta indicator + long upper shadows on candles = sign of buying climax (FOMO-like end of the uptrend).
Number 2. A convex profile around the line is a sign of a range that is an intermediate stage between opposite trends.
Number 3. Signs of seller activity.
Number 4. An upthrust is a trigger for the beginning of a downtrend.
This is just one example of how ATAS can be useful for trading channels. In addition to this, you can also use:
- Market Replay — a market simulator that enables you to replay historical data and practice creating trading channels on a chart as if trading were happening in real time.
- Indicators. ATAS offers tick-level granularity, enabling market analysis with maximum accuracy. This is suitable for thorough analysis of price during channel line tests. Among the most useful indicators are: Cluster Search, Big Trades, Speed of Tape.
- Working with the Tape and the DOM. This is another way to confirm trades when trading channels. Useful ATAS tools for working with Level II and Order Flow include Smart DOM, DOM levels, Smart Tape, DOM Trader.
- Cluster charts or footprints. By accessing information inside candlesticks, you can make more informed decisions compared to traders who only see 1-minute candlesticks. Additionally, you can experiment with different timeframes.
- Educational resources. The blog, YouTube channel, and Knowledge Base provide specific instructions on setting up and working with charts, applying indicators, developing strategies, and other valuable information for channel trading. Additionally, ATAS platform users can rely on responsive customer support.
How to Start Trading Using Trend Channels
Use the following step-by-step guide as a basis for developing your unique trading plan:
-
- Identify support and resistance levels. Visually assess price dynamics. Study where the market has previously demonstrated a tendency to reverse or consolidate.
- Create a price channel. Connect levels with trend lines to form the channel. Ensure that the lines are parallel and confirmed by multiple touches of the price. Pay attention to the median line, which will help create the channel more accurately.
- Formulate your expectation of the price action. For example, ‘When the price declines to level XXX, I will look for a long entry point’.
- Get confirmation. Switch to a lower timeframe to apply volume analysis, Delta indicator, or other tools to confirm the realism of your expectations.
- Act when you have enough arguments. Use a stop-loss to protect your capital from unfavorable scenarios.
Conclusions
Trading channels are a fundamental tool of technical analysis. They visually display price trends within specific support and resistance boundaries.
If you understand and effectively use trading channels, they can significantly enhance your trading strategies, whether you are a day trader reacting to short-term movements or a long-term investor analyzing broader market trends.
To start trading using price channels, you need to develop and test a strategy based on competitive advantage, continuously learn, and adapt to market changes. ATAS can help you with this.
Download ATAS. It is free. During the trial period, you will get full access to the platform’s tools to experiment with price channel analysis. Moreover, you can continue using the program for free even after the 14-day trial period is over, whether it is for cryptocurrency trading or volume analysis.
Do not miss the next article on our blog. Subscribe to our YouTube channel and follow us on Facebook, Instagram, Telegram, or X, where we publish the latest ATAS news.
Information in this article cannot be perceived as a call for investing or buying/selling of any asset on the exchange. All situations, discussed in the article, are provided with the purpose of getting acquainted with the functionality and advantages of the ATAS platform.


