
Richard Wyckoff is a legendary figure in the stock market, renowned for his contributions to understanding market behavior by analyzing price and volume interactions. Toward the end of his life, he developed a unique trading method, and its key principles are still relevant and in demand today.
Learn more:
This article includes Wyckoff’s diagrams and examples with charts.
Who Is Richard Wyckoff?
Richard Wyckoff (Richard Demille Wyckoff, November 2, 1873 – March 7, 1934) developed a unique market analysis theory based on his observations of various market participants throughout his remarkable career:
- 1888 – Richard began his journey on Wall Street as a newspaper boy.
- 1891 – He began climbing the career ladder at a brokerage firm, first as a cashier handling retail traders’ orders, then moving on to manage a network of branches. By 1897, he was trading on his own account.
- 1900 – He co-founded the brokerage firm Harrison & Wyckoff, where he closely observed the trading activities of major speculators and trained high-profile clients, including J. P. Morgan.
- 1907 – Wyckoff founded the analytical journal “Magazine of Wall Street.”
- 1909 – He published his first book, “Studies in Tape Reading.”
- 1911 – Through his articles on technical analysis, Wyckoff introduced key concepts like “support and resistance,” “accumulation and distribution,” “rallies and reactions,” and “overbought and oversold.”
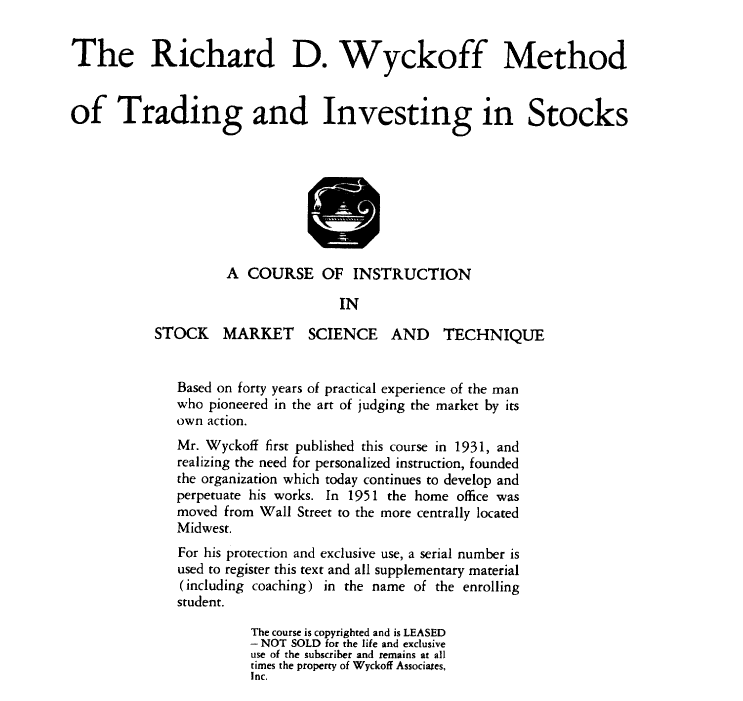
By 1930, Richard’s health was declining, prompting him to share his wealth of experience. This resulted in the founding of the Stock Market Institute and his course on investing and stock speculation, widely known as the Wyckoff Method.
His original training course was further developed by his followers, notably Robert Evans, who expanded Wyckoff’s methodology to make it more accessible for traders.
The Wyckoff Method: Core Principles
The chart contains everything you need
Wyckoff believed that all information necessary for making trading decisions is already reflected in price movements and volume data presented on a chart (which, in his time, were created by hand). The advantages of this approach are:
- the chart consolidates all transactions into a single, comprehensive report;
- the chart is a reliable and factual source of market data;
- it enables real-time analysis (to the extent possible in the early 20th century).
The composite operator
Wyckoff believed that various groups of large players often acted similarly, without any collusion. He introduced the concept of the Composite Operator, an imaginary market participant representing those who can influence the market through significant trades.
Three Core Principles of the Wyckoff Method
Wyckoff’s chart analysis of price and volume is based on three foundational principles:
- The law of supply and demand. Price movement is driven by the balance (or imbalance) between buyers and sellers.
- The law of cause and effect. Price increases are a result of prior accumulation by the Composite Operator, while distribution serves as the trigger for subsequent price declines.
- The law of effort versus result. This principle evaluates the relationship between trading volume (effort) and price movement (result) to assess the success or failure of market participants, offering valuable insights into market sentiment.
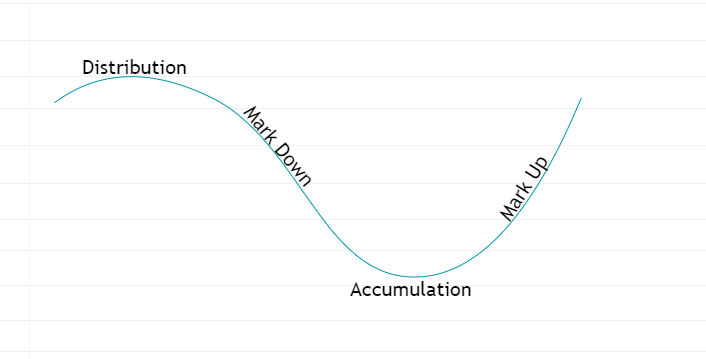
Four Phases of the Market Cycle in the Wyckoff Theory
Drawing from his observations, Wyckoff outlined four main phases in the market cycle:
- Accumulation,
- Markup,
- Distribution,
- Markdown.
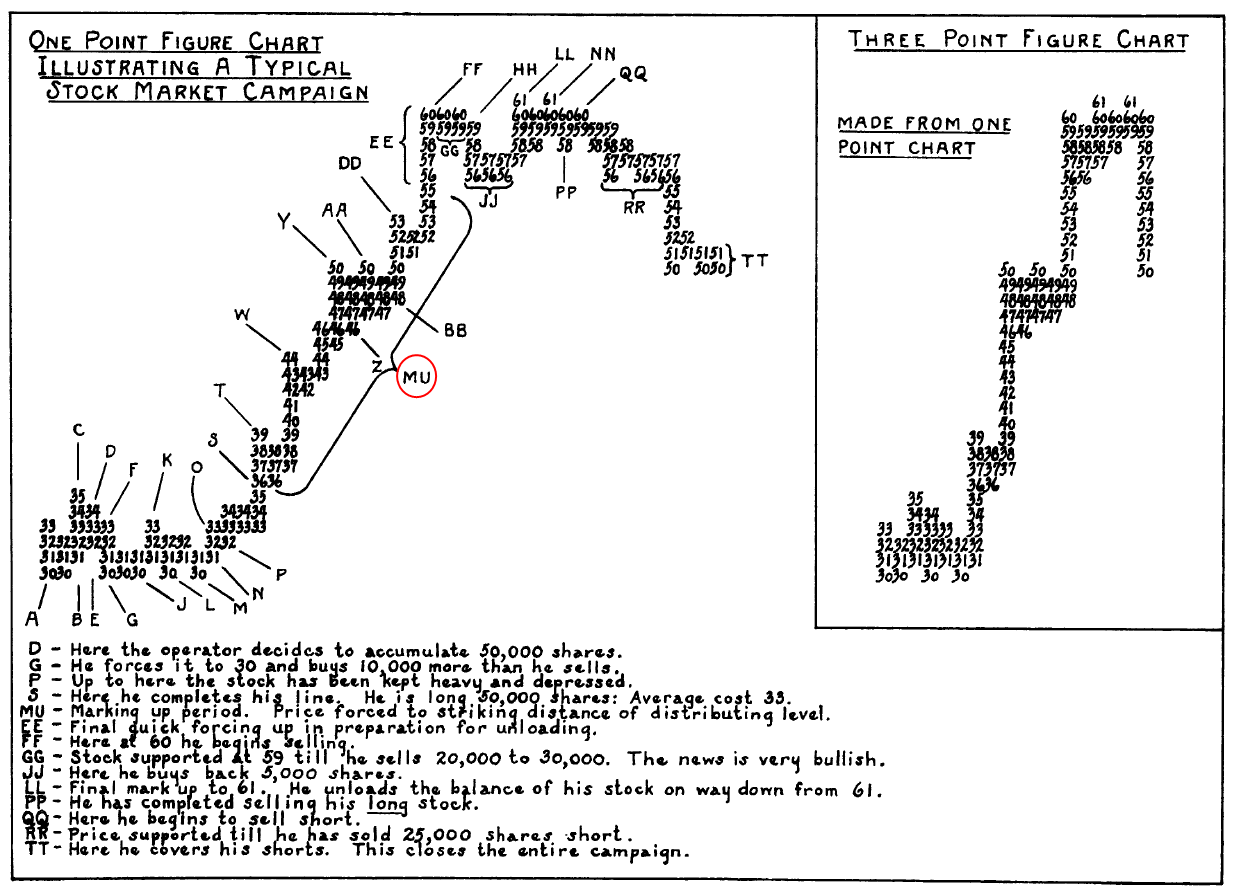
Wyckoff frequently used point-and-figure charts to anticipate trends. For example, by measuring the length of the accumulation phase, he could project a target price for the upcoming markup phase. Generally, the longer the accumulation, the higher the price target for the markup stage.
Accumulation
Wyckoff believed that large market players accumulate assets discreetly, often leveraging negative market sentiment and unfavorable news to mask their intentions.
His followers later created a model to illustrate the typical behavior of prices and volume during accumulation phases on a chart (each accumulation is unique, even though it has the common characteristics of a classic Wyckoff accumulation pattern shown below):
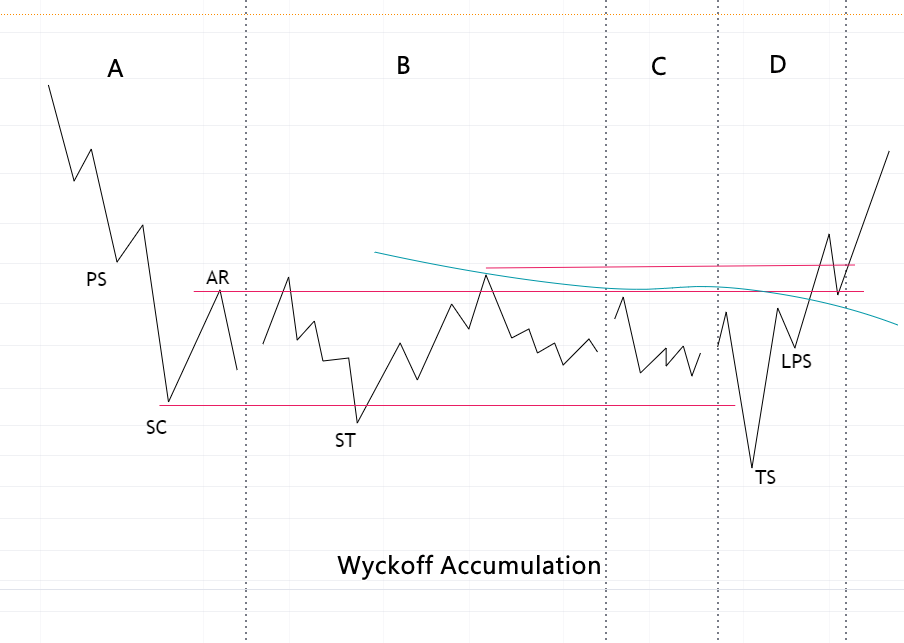
Wyckoff followers divide the accumulation phase into five stages:
Phase A of Accumulation
This phase begins at the end of a price decline, with prevailing negative sentiment and prices reaching critical lows amid high volume.
- PS – Preliminary Support. Selling volumes are extremely high, though the price is not yet ready to turn upward.
- SC – Selling Climax. Here, after a long downtrend, wide bearish candles and a surge in trading volume appear. Such selling may indicate that retail traders are in a panic, rushing to get rid of their assets entirely.
- AR – Automatic Rally. Following the panic-driven sell-off, there is a sharp price rise — a sign that significant buyers (the Composite Operator) are starting to show interest, accumulating assets at lower prices.
Phase B of Accumulation
This phase occurs when the price enters a range, moving between support and resistance levels (indicated by the red lines in the diagram above).
- ST – Secondary Test. In this phase, the price tests the support level. Sometimes, these tests create false bearish breakouts (bear traps), which intensifies the pressure on sellers. They feel compelled to get rid of their assets, believing that the price decline is about to resume (even though that does not actually happen).
Phase C of Accumulation
In this accumulation phase, the market might seem to have quieted down, with lower trading volumes. However, this does not mean that the Composite Operator has lost interest — more likely, they are patiently waiting for the right moment to make the next move.
Phase D of Accumulation
During this phase, the price often (though not always) makes a false downward move.
- TS – Terminal Shakeout (TS). This is a strategic move to “shake out” assets from retail traders who wrongly believe the range will break upwards. These traders are forced to close their long positions due to stop-loss triggers right before the start of an uptrend. Following this, prices begin to climb on increasing volume (a strong indicator of rising demand).
- LPS – Last Point of Support. Here, the price declines slightly on low volumes, indicating minimal selling pressure. This makes it a favorable entry point for a long position, as the Composite Operator has accumulated assets and there is limited supply to counter the upcoming upward trend.
At this point, the so-called “Jump Over the Creek” takes place, where the “creek” represents an indistinct line of resistance near the upper boundary of the accumulation stage (indicated by the curved line in the diagram above).
Wyckoff Accumulation Example
Let’s examine Apple’s (AAPL) stock chart from spring 2024 as an example of the Wyckoff accumulation phase. This period was challenging for AAPL investors, marked by regulatory pressure on the App Store, declining sales in China, and a lack of visible AI advancements in Apple’s products.
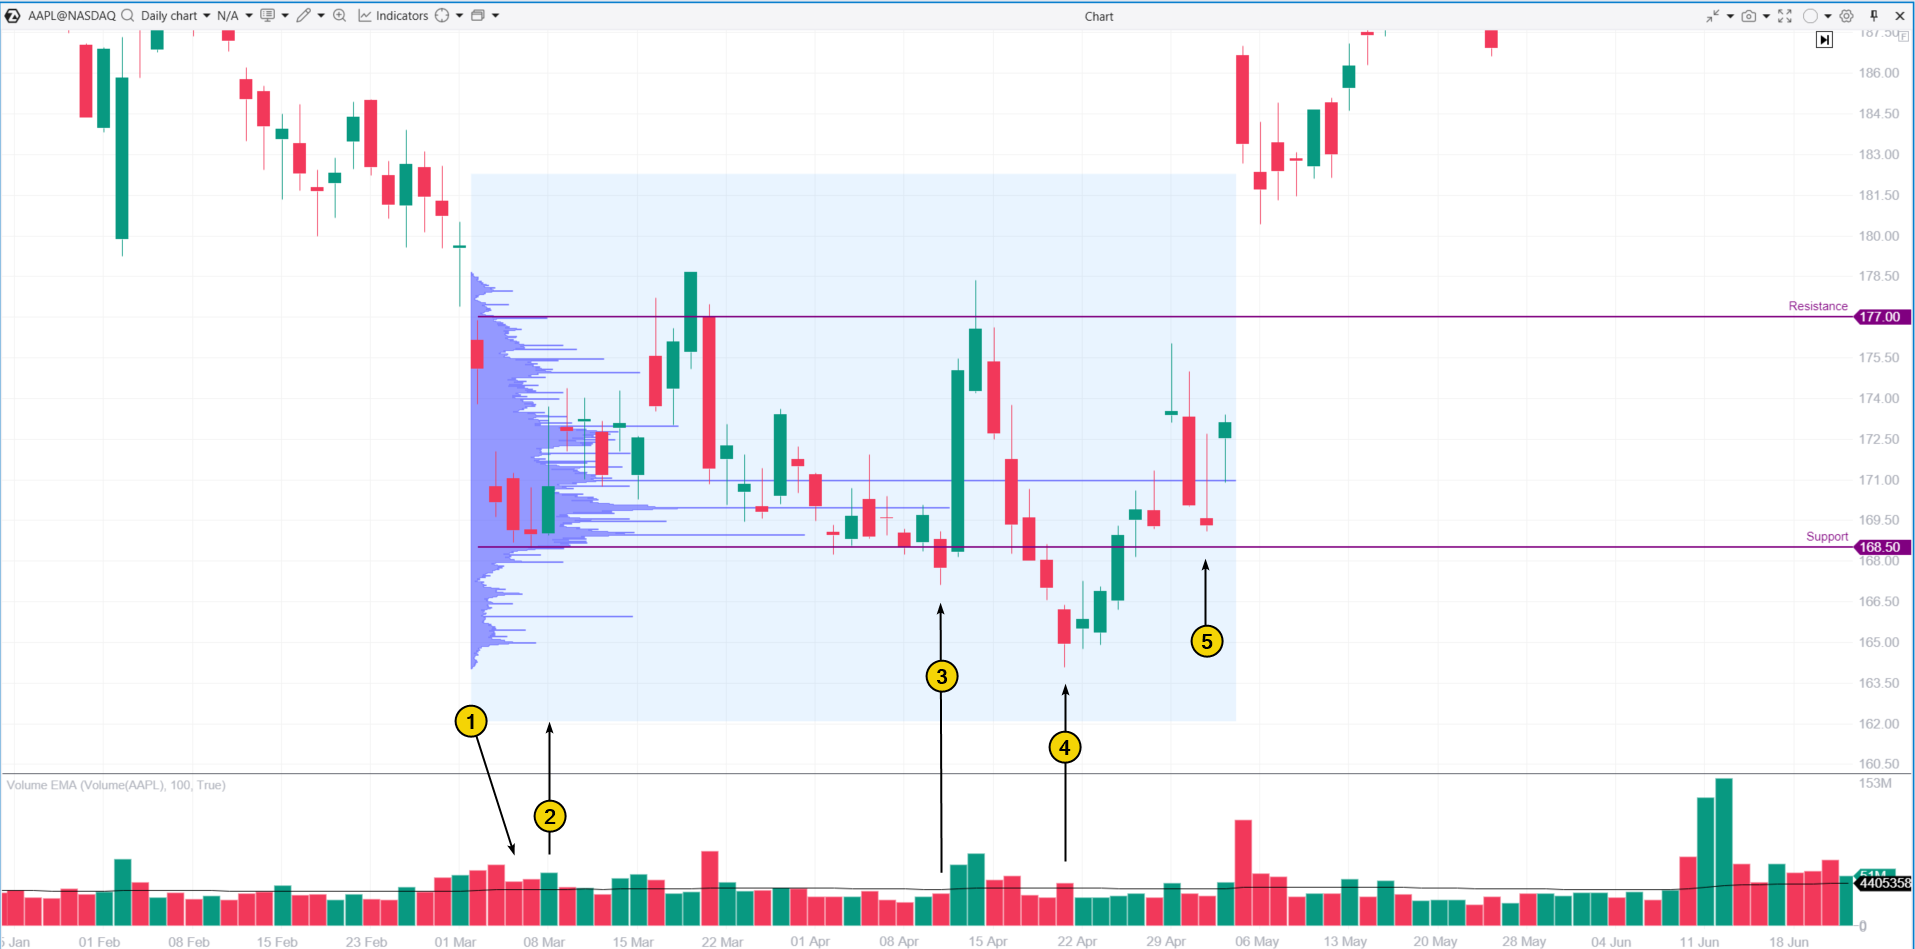
(1) The price broke below $180 support, dropping with large bearish gaps and above-average volume. To identify panic selling (Selling Climax, SC) there, ideally, volume should have spiked to 2-3 times the average level. However, with a high-profile stock like AAPL, exceptions could occur.
(2) An Automatic Rally (AR) followed, with the price rising back to the level where aggressive selling had initially begun — signaling that the Composite Operator might have been accumulating shares.
On March 21, a wide bearish candle appeared with high volume. However, rather than continuing aggressively, the price was gradually declining between March 22 and April 10 with below-average volumes — a pattern typical of Phases B and C.
(3) Secondary Test, or Spring. Both terms describe a false breakout below a prior low. Following this, there was a sharp rally on April 11-12, but resistance remained intact. The Composite Operator seemed interested in accumulating more shares at that stage.
(4) Terminal Shakeout. On April 19, the market opened with a bearish gap. Seeing a new low and the stock’s struggle to rise above $177, the average investor faced intense pressure to sell, as the stock no longer appeared to lead the market. This encouraged them to sell the stock, which no longer seemed like a strong performer.
Once the Terminal Shakeout “encouraged” even more retail investors to sell, the stock began a rally, signaling the accumulation phase was nearing its final stages.
(5) Last Point of Support. The price pulled back roughly 50% from the rally between April 19 and April 29, then broke out of the accumulation phase with a strong bullish gap.
The added Market Profile indicator suggests the Composite Operator was interested in accumulating AAPL stock around $170, highlighted by significant bars on the profile histogram at this level.
Uptrend (Markup)
Once assets have been accumulated and the supply of shares available for purchase dwindles, the uptrend or markup (MU) phase begins.
Key characteristics of the markup phase:
- Resistance breakouts. They often occur with bullish gaps and increased volume, confirming demand.
- Tests. Price declines, if any, come with low trading volumes, as the Composite Operator assesses the available supply on the market. If there is limited selling pressure, it may signal readiness for further growth.
- Market psychology. Optimism and expectations of continued gains increase, drawing more buyers as the asset becomes more and more scarce.
Example of a Price Markup Phase Using the Wyckoff Method
To illustrate the price markup phase according to the Wyckoff method, let’s look at another chart of Apple (AAPL) stock from mid-2023:
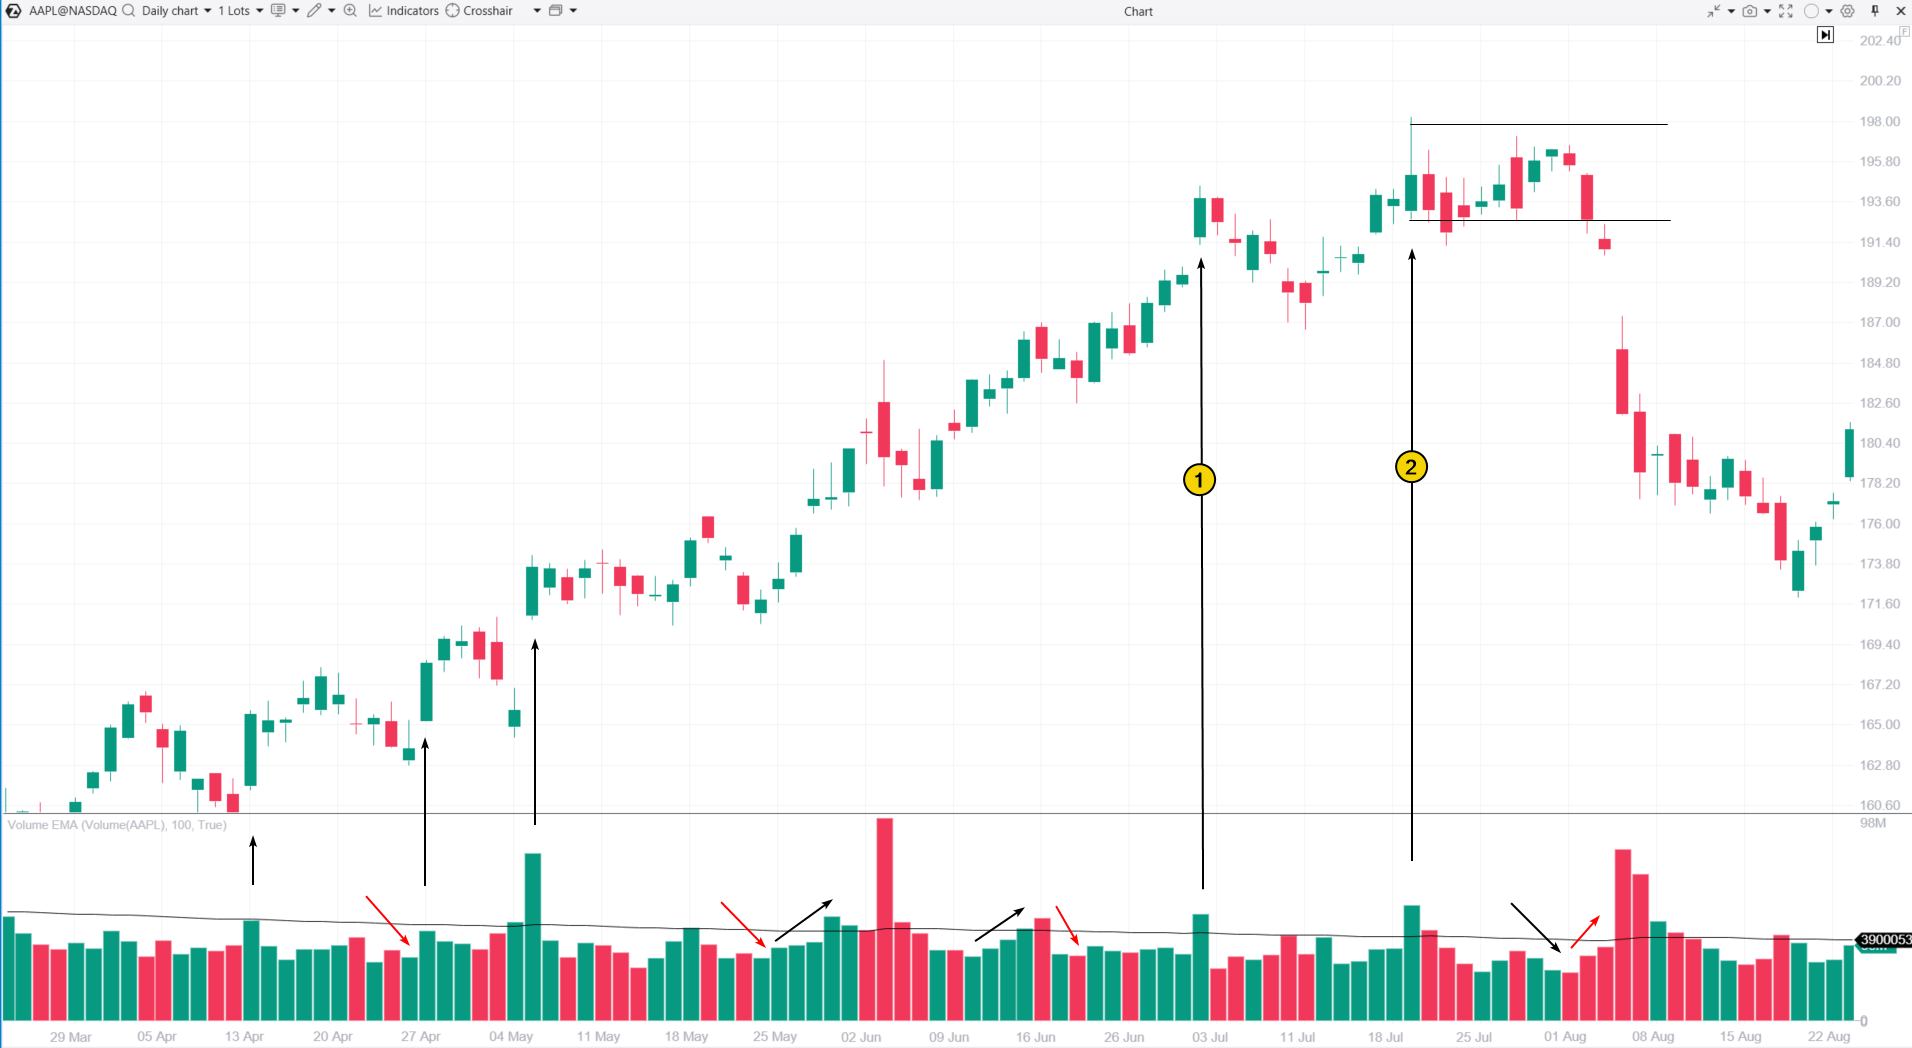
On the left side of the chart:
- Rallies. Black arrows mark price increases with rising volume.
- Reactions (or Corrections). Red arrows point to price pullbacks where trading volume declines. This drop in volume during price dips within the markup phase typically signals that fewer sellers are willing to part with their shares.
On the right side of the chart, certain signals may raise caution for a Wyckoff method analyst assessing price and volume dynamics:
- A strong bullish candle with a gap up on high volume initially looks promising, but the subsequent pullback is too deep — a sign that buying momentum is not strong enough to hold the price at recent highs.
- Another rally attempt follows but fails to make substantial progress.
In early August, the relationship between price and volume changed noticeably (as prices increased, volume decreased, and as prices fell, volume spiked). This pattern signals a bearish market and suggests that the Composite Operator likely distributed shares around the $190 level, which had been bought at lower prices. Capitalizing on a wave of retail buyers drawn in by the news of Apple Inc. reaching a $3 trillion market cap, the operator sold shares at a profit.
Now, let’s take a closer look at the Wyckoff distribution phase.
Distribution
The distribution phase is the reverse of the accumulation phase.
In this stage, the Composite Operator capitalizes on a wave of demand fueled by positive news to sell some or all of their shares to retail buyers.
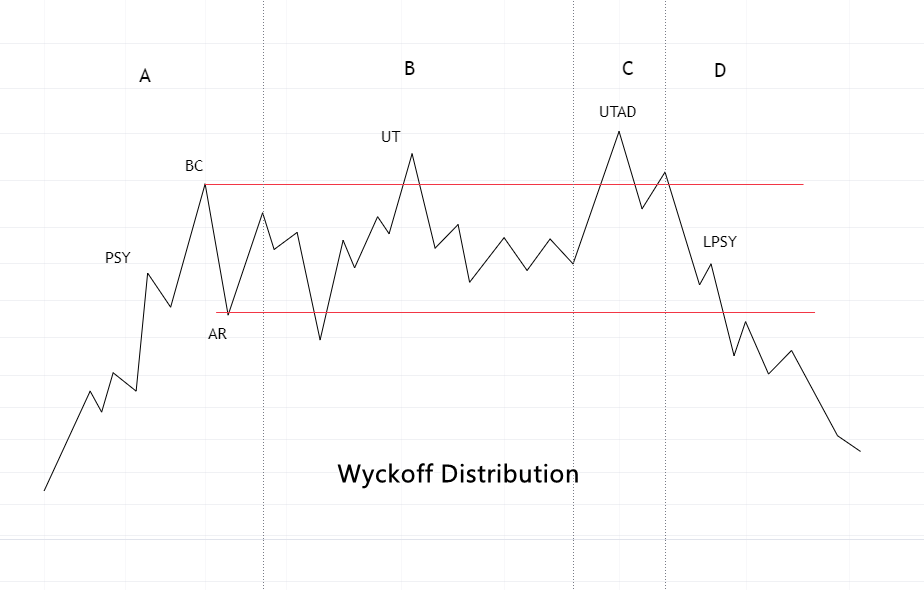
In Phase A, the news is overwhelmingly optimistic, driving the stock price up with bullish gaps and often breaking key psychological levels. This attracts a broad range of buyers, leading to a buying climax (BC).
Signs that the Composite Operator is beginning to sell typically include:
- A price decline following Preliminary Supply (PSY). For example, refer to candle #1 on the AAPL chart above.
- An Automatic Reaction (AR) after the buying climax.
In Phase B, the market typically settles down. If the price breaks through local support and resistance levels (marked in red on the distribution chart), it often does not continue the trend.
- The Upthrust (UT) occurs when there is a false breakout above the climax high, luring even more retail traders into a bull trap.
During Phase C, there is a final false breakout above resistance, referred to as the Upthrust After Distribution. This mirrors the Terminal Shakeout — a deceptive move that signals the end of the accumulation phase.
Following that, Phase D begins, where the price starts to decline on increasing volume, and short-lived rallies create the LPSY (Last Point of Supply) pattern.
For more insights into Upthrusts and Shakeouts, be sure to check out our article, “Upthrusts and Shakeouts.” Now, let’s examine an example of Wyckoff distribution.
Wyckoff Distribution Example
The example below illustrates that the Wyckoff distribution pattern is applicable not only to stocks but also to cryptocurrencies. The chart shows a significant price peak for Bitcoin that was formed in the fall of 2021.
This was a time when the ETF for Bitcoin futures was approved, and analysts were predicting that the BTC/USD price would soar to $100,000. Bitcoin received praise from influential figures like the heads of Apple and JP Morgan, as well as George Soros and other prominent authorities. Additionally, El Salvador became the first country in the world to officially adopt Bitcoin as legal tender.
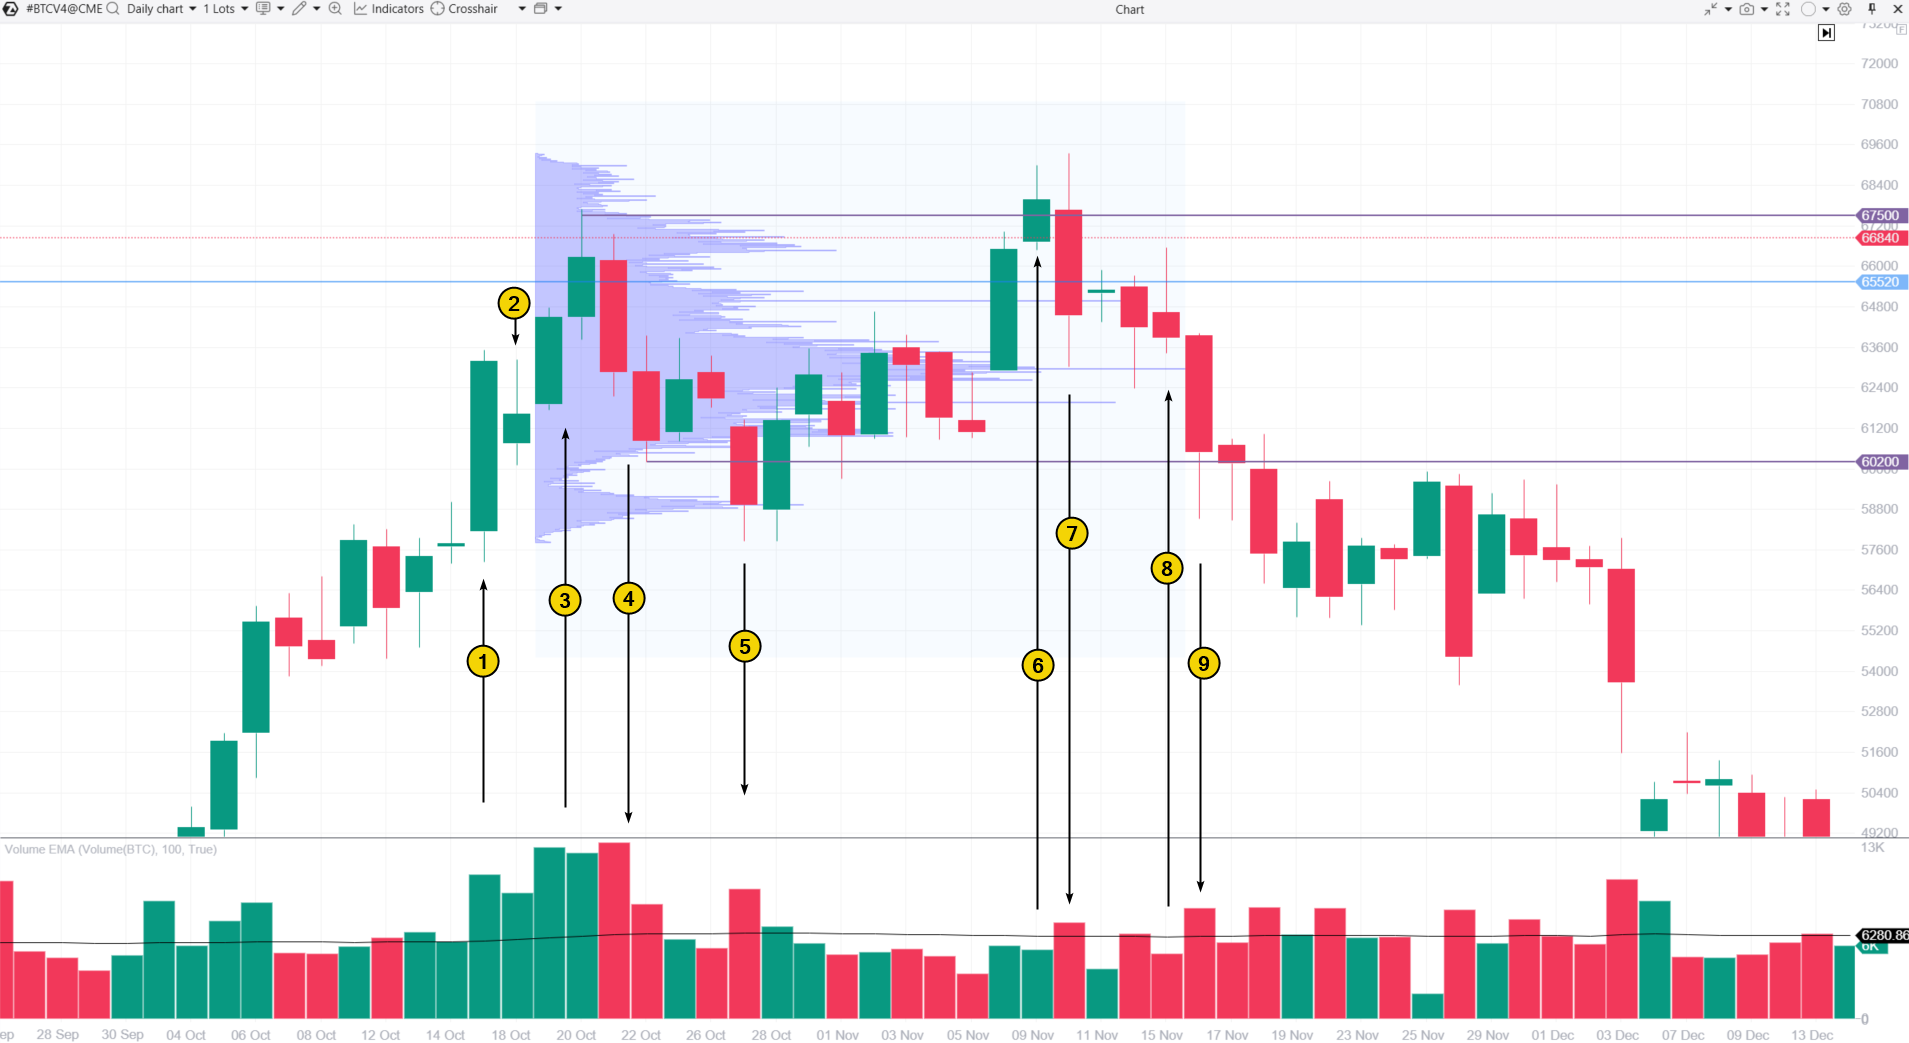
A significant influx of optimistic buyers allowed the Composite Operator to “unload” their assets:
(1) The rapid price increase attracts FOMO buyers.
(2) Although the trading volume is high, the candle closes well below the peak, indicating Preliminary Supply (PSY).
(3) In the next two candles, we see a buying climax, with volumes twice the average, and the price surpassing the psychologically important previous high (marked by the blue line).
(4) An automatic reaction signals the strength of sellers on the other side of the hype-driven demand.
(5) A false breakout of local support occurs, as the price is not ready to drop further; the Composite Operator needs more time to distribute the Bitcoins (or derivatives) previously purchased at lower prices.
(6) Аn upthrust.
(7) We observe a price decline, notably on increasing volumes.
(8) Last Point of Supply. The price rises during the day, but demand is low.
(9) Selling pressure leads to the markdown phase, which pushes Bitcoin’s price below $20k.
The profile indicates that a large volume of trades happened around the $63k level. This was the average price at which the Composite Operator distributed the asset among eager buyers.
Downtrend (Markdown)
The markdown phase marks a shift from initial excitement to discouragement, then despair, and finally, panic.
Typically (though with possible exceptions):
- price increases are accompanied by decreasing volume;
- price decreases are accompanied by increasing volume;
- attempts to break through support levels succeed, turning those levels into new resistance;
- attempts to break through resistance fail,
- a descending trading channel forms on the chart.
Example of the Markdown Phase
The 4-hour chart below illustrates what the Wyckoff method refers to as the markdown phase, shown here on oil futures.
In early April 2024, concerns intensified, and major news outlets reported the following:
- Israel launched a missile strike on a diplomatic building, raising concerns that the escalating conflict could disrupt global oil supply chains.
- Ukraine conducted drone attacks on Russian oil refineries.
- OPEC+ continued enforcing production cuts.
Meanwhile, a distribution range formed on the chart between $85 and $87.60.
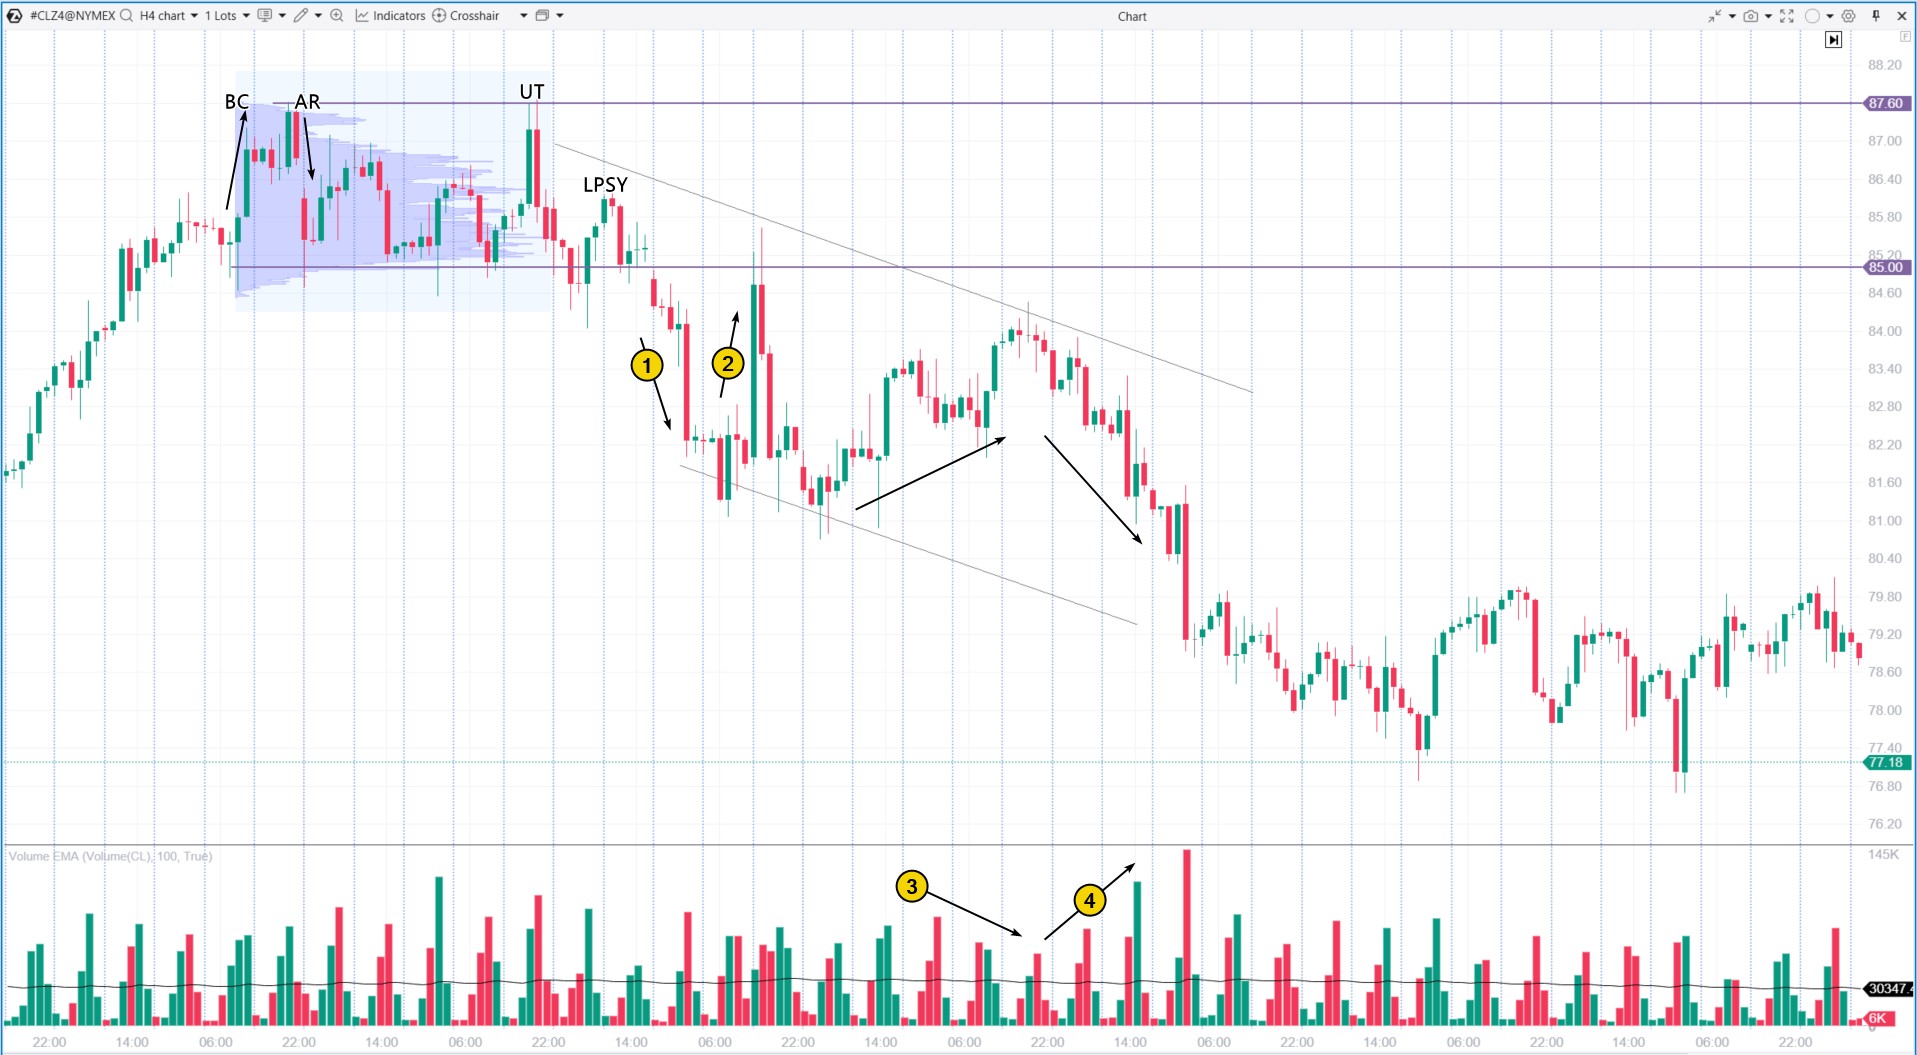
The markdown phase began with the development of a downward channel:
(1) Accelerated decline with increasing volume.
(2) Failed rally attempt. The price tests high-volume levels set during the distribution phase.
(3) The price rises as volume decreases — a sign of weakening demand.
(4) The price declines as volume increases — indicating strong selling pressure.
For more on assessing the balance of supply and demand through price and volume analysis, check out: VSA and Cluster Analysis: No Demand and No Supply.
How to Trade Using the Wyckoff Method
The Wyckoff method suggests:
- buying during short-term pullbacks within an uptrend stage;
- entering short positions on brief rallies during a downtrend stage.
Wyckoff highlighted the hinge as an ideal entry point.
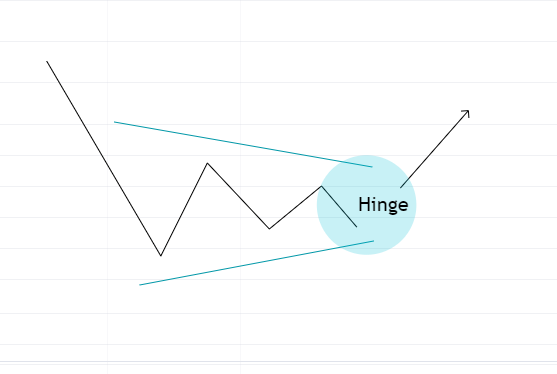
This refers to a moment when price movements narrow (often forming a contracting triangle), allowing traders to manage risk effectively and avoid “chasing” an already active momentum.
Stock Trading Strategy Using the Wyckoff Method
Wyckoff actively engaged in intraday trading while reinvesting his earnings into long-term positions.
His approach to speculation and investing includes the following guidelines.
✔ Assess the current position and future trend of the index
Start by analyzing the price and volume chart of the index to determine which of the four phases the stock market is currently in. This chart provides all the information needed for an objective assessment of the market’s state and for predicting its most likely direction.
✔ Choose stocks that align with the trend
- In an uptrend, focus on selecting stocks that are outperforming the market. Look for stocks amid a significant accumulation zone.
- In a downward trend, pick stocks that are underperforming compared to the market, ideally amid a notable distribution zone.
✔ Enter a trade considering market index reversal
To determine the right entry point, Wyckoff advised evaluating the subtle balances of supply and demand.
He always used stop-loss orders, adjusting them as market conditions changed to protect his positions. This strategy allowed him to hold onto his trades long enough to, for example, close a long position during the Automatic Reaction (AR) following the Buying Climax (BC).
FAQ
Is there a Wyckoff indicator?
In the traditional sense, there is not a specific Wyckoff indicator. The Wyckoff method is centered around analyzing price ranges, volume, and market behavior, rather than relying on a single indicator. Traders who use the Wyckoff approach focus on interpreting market actions and behavioral patterns instead of standard technical indicators.
What does the Wyckoff strategy involve?
The Wyckoff strategy involves identifying different market stages: accumulation, markup (when prices rise), distribution, and markdown (when prices fall) to make informed trading decisions. This methodology is based on recognizing the intentions of the Composite Operator by observing trading volumes and price changes, enabling traders to follow the movements of significant capital.
How accurate is the Wyckoff theory?
No method can guarantee 100% accuracy, but the Wyckoff method is widely regarded as effective for experienced traders who know how to analyze trading volumes. The success of trading with the Wyckoff method hinges on the trader’s ability to read charts accurately, maintain discipline, manage risks, and adapt to changing market conditions.
For more information on the Wyckoff methodology, consider the following resources:
- Vertical Volume Analysis using the Wyckoff Method.
- “Trades About To Happen” by David Weis, a follower of Wyckoff.
- How to Use the Weis Wave Indicator.
- “Master The Market” by Tom Williams, a Wyckoff disciple and the creator of VSA.
- “My Journey of Discovery to Wyckoff Volume Spread Analysis” by Philip Friston.
Conclusions
The Wyckoff method is widely adopted in trading because it provides a systematic approach to market analysis focused on the behavior of key participants, which is still relevant today. These principles and techniques continue to inspire traders and analysts as they seek entry and exit points in the markets, helping them gain a deeper understanding of the mechanisms that drive asset prices.
Advantages of the Wyckoff Method:
✔ In-depth analysis. The Wyckoff method provides a thorough understanding of the underlying causes behind market movements, focusing on the balances and imbalances of supply and demand influenced by major market players.
✔ Versatility. It can be applied across various markets, including stocks, futures, and cryptocurrencies.
✔ Objectivity. This method helps traders assess the market without being swayed by doubts or sensational news headlines.
✔ Educational value. It teaches traders to understand market psychology and identify the actions of significant participants.
Disadvantages of the Wyckoff Method:
✘ Complexity. The method demands substantial experience in volume analysis, which can be challenging for beginners.
✘ Susceptible to manipulation. The relationship between price and volume can sometimes be irrational.
✘ Subjectivity. Data interpretation can be subjective, leading to varying interpretations of the same market conditions.
✘ Lack of automation. It is not possible to create an automated trading system based on the Wyckoff method, as it requires human judgment and assessment.
How to Start Learning Trading Using the Wyckoff Method
If you want to dive into speculating and investing with the Wyckoff method, here are some steps to start with:
- you should thoroughly study educational materials created by Richard Wyckoff and his followers.
- gain access to a platform that enables you to open charts and analyze volumes. This will help you identify and track patterns in price and volume behavior across the four stages.
Modern volume analysis platforms make learning the Wyckoff method more effective. Here is how the professional trading and analytical platform ATAS can help you:
- the ATAS Market Replay simulator enables traders to practice using historical data. This is a more advanced approach than manually moving a paper chart to the right, candle by candle, as Wyckoff suggested for learning to read charts;
- access to tick data from stock, futures, and cryptocurrency markets;
- cluster charts that offer maximum detail on trading volumes;
- powerful volume analysis indicators, including the ATAS Big Trades indicator, ATAS Cluster Search indicator, ATAS DOM Levels indicator, and other ATAS indicators.
Download ATAS. It is free. Once you install the platform, you will automatically get the free START plan, which includes cryptocurrency trading and basic features. You can use this plan for as long as you like before deciding to upgrade to a more advanced plan for additional ATAS tools. You can also activate the Free Trial at any time, giving you 14 days of full access to all the platform’s features. This trial allows you to explore the benefits of higher-tier plans and make a well-informed purchasing decision.
Do not miss the next article on our blog. Subscribe to our YouTube channel, follow us on Facebook, Instagram, Telegram or X, where we publish the latest ATAS news. Share life hacks and seek advice from other traders in the Telegram group @ATAS_Discussions.
Information in this article cannot be perceived as a call for investing or buying/selling of any asset on the exchange. All situations, discussed in the article, are provided with the purpose of getting acquainted with the functionality and advantages of the ATAS platform.


