
Stock markets are complex and dynamic systems influenced by numerous factors. To make informed decisions about buying or selling financial assets, it is essential to analyze the stock market. This article explores the main types of analysis:
Fundamental Analysis of Stocks
Fundamental analysis is focused on examining the fundamental factors that influence the price of a financial asset. These factors include:
- economic indicators: inflation rate, unemployment, GDP;
- financial indicators of a company: profit, revenue, profitability;
- conditions of a specific industry;
- political events.
Fundamental analysis allows for the assessment of the long-term development prospects of a company or industry, as well as the identification of potential risks and opportunities.
Useful tools for conducting fundamental analysis include economic calendars, statistical resources, and stock scanners.
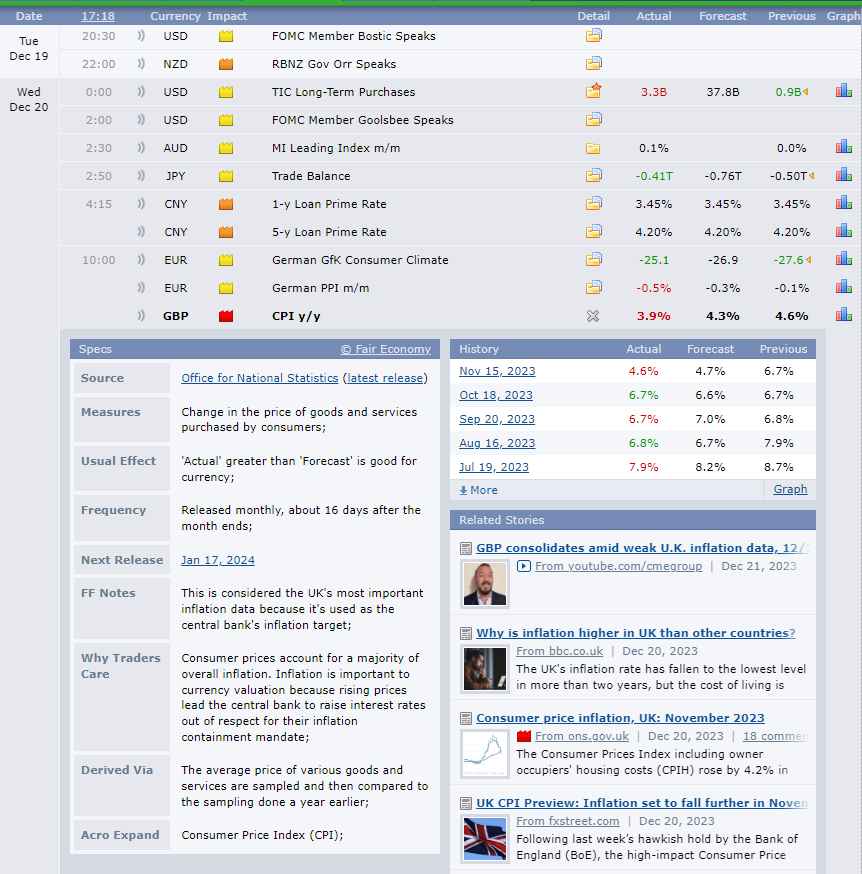
Economic calendars are instruments that provide information about the timing when important economic indicators were released, their values (current, expected, and past), and sometimes relevant comments, descriptions, and assessments of their impact importance.
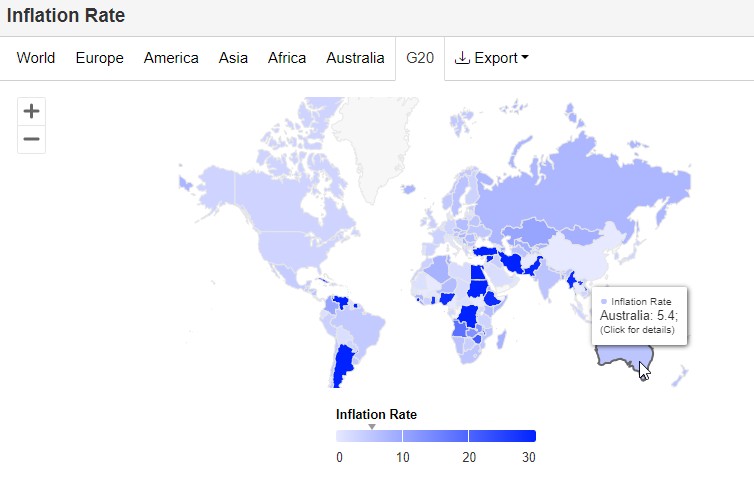
Statistical resources provide current and historical data on key economic indicators such as inflation rates, unemployment levels, GDP, interest rates, and other relevant information.
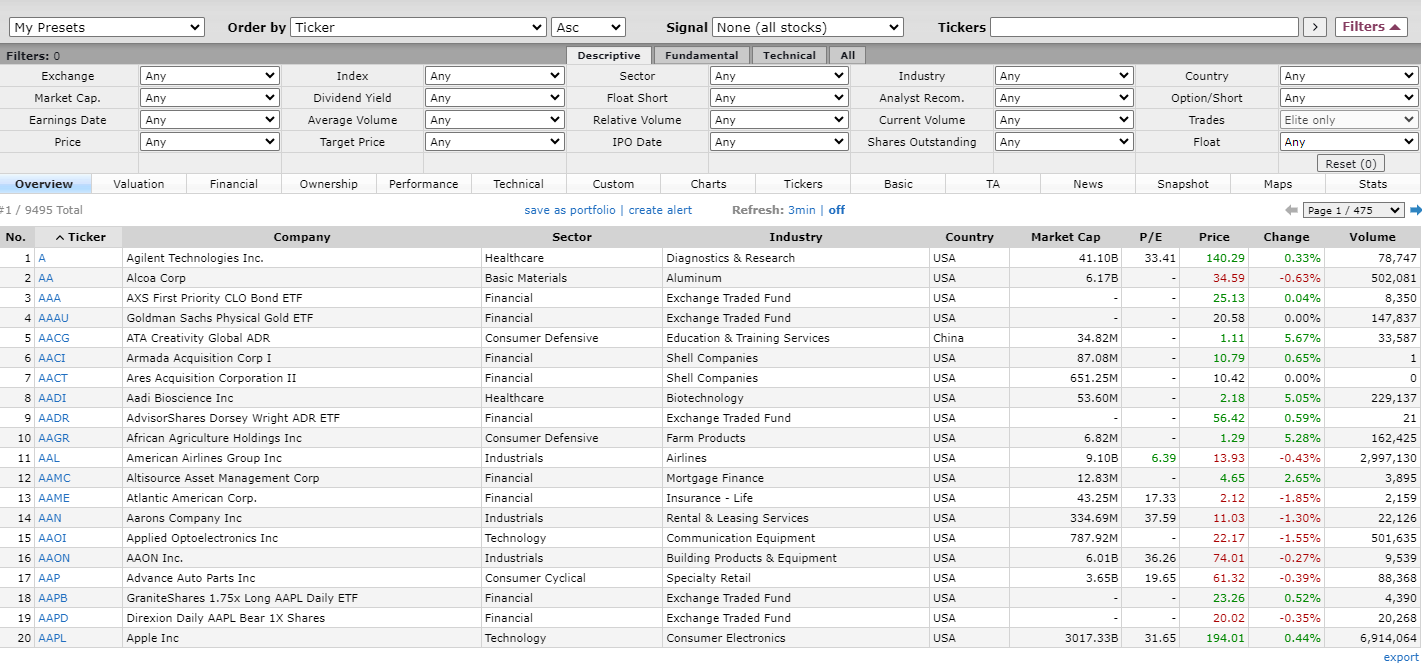
Stock scanners, or screeners, enable the identification of securities based on specific fundamental criteria.
Advantages of fundamental analysis
- providing insights into the long-term development prospects of a company or industry;
- identifying potential risks and opportunities;
- being grounded in objective data;
- applicability for long-term investment strategies.
Disadvantages of fundamental analysis
- potential complexity and time-consuming nature;
- requirement for specific knowledge and skills;
- inability to guarantee 100% accuracy in forecasts.
Technical Analysis of Stocks
Technical analysis of stocks is based on the examination of historical price and volume data. Technical analysts employ various charts, indicators, and tools to identify patterns in price movements.
The fundamental principle of technical analysis is that market prices reflect all relevant information influencing this market. Therefore, a technical analyst looks at the trading history pattern of a security or commodity rather than external factors such as economic, fundamental, or news events. It is believed that price action tends to repeat itself due to the collective patterned behavior of investors. Consequently, technical analysis focuses on identifiable price trends and patterns.
Principles of technical analysis:
- a price chart takes into account all available information;
- prices move in trends;
- history tends to repeat itself.

The 5-minute price chart of the stock index futures above illustrates approaches applied in classical technical analysis:
- RSI indicator – identifies impulses, overbought/oversold zones;
- Mirror levels principle activates when the previously broken support begins to act as resistance.
Advantages of technical analysis
- providing insights into the long-term development prospects of a company or industry;
- identifying potential risks and opportunities;
- being grounded in objective data;
- applicability for long-term investment strategies.
Disadvantages of technical analysis
- Relies on historical data that may not correspond to current market conditions;
- may produce false signals.
Volume Analysis
By incorporating information about trading volumes into their analysis, traders unlock a new dimension. Now, they can analyze the interaction of:
- The price of the financial asset (measured in monetary units, such as dollars);
- trading volumes (measured in the number of contracts traded per unit of time);
- time (you can choose the desired timeframe, for example, a 5-minute interval).
Analyzing this interaction enables you to assess the balance of forces between buyers and sellers in the current market situation. This operates on the law of supply and demand, expressed by the intersections of demand and supply curves on the axes of time and volume, as shown in the screenshot below.
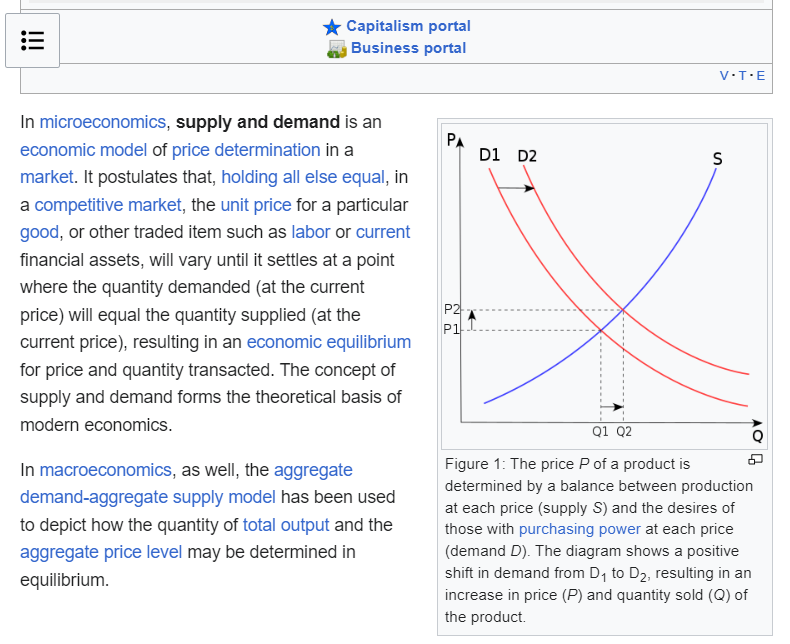
Demand and Supply Signals are the very source that forms patterns on the price chart. Market volume reflects the overall sentiment of traders, considering the psychological factor that underlies all trading.
Example. Let’s explore how volume analysis can be beneficial in the context of the futures chart for the Nasdaq stock market index.
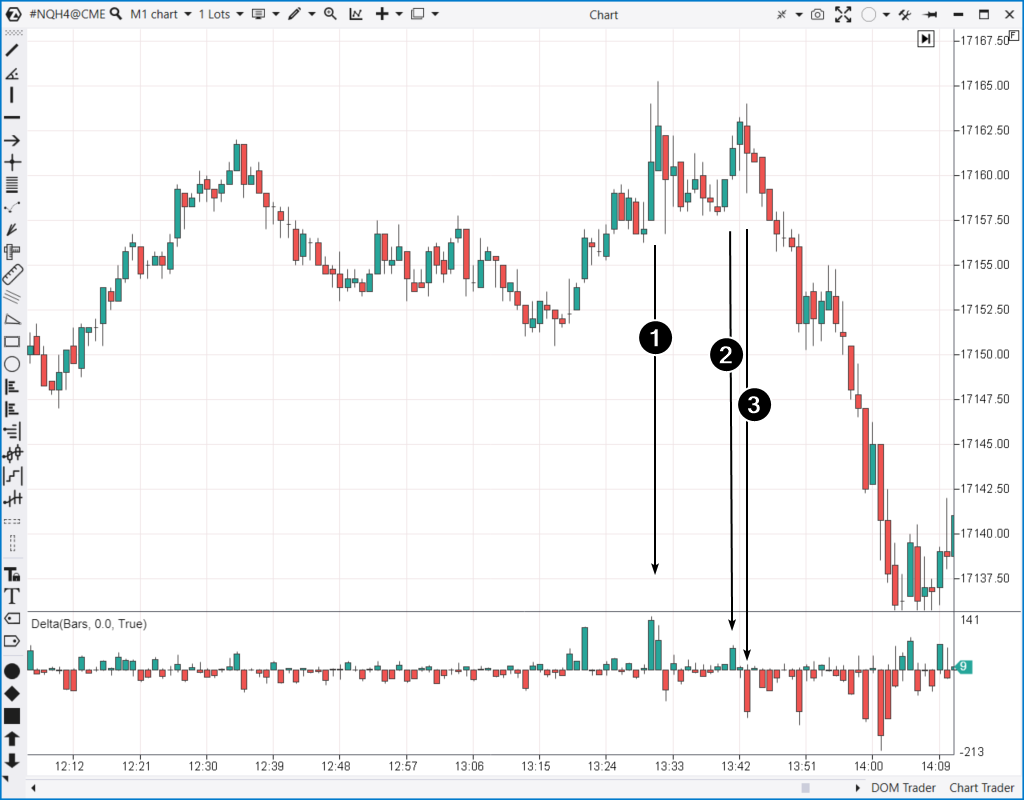
This is a one-minute timeframe with an added delta indicator – it shows the difference between market buys and market sells. Volume analysis provides a timely understanding of the evolving market dynamics:
- Buyers make efforts to break through the resistance level. However, the upper shadows on the candles are long. The price drops to the levels where the efforts began – a sign of weak progress.
- A new attempt by buyers. But judging by the delta indicator, their pressure has noticeably decreased compared to the first attempt.
- Sellers promptly took advantage of demand exhaustion – this is evident in the increase in market sells.
From a technical analysis perspective, this is a double top pattern. However, the delta indicator provides a much more timely and reliable signal than classical technical analysis tools, such as moving averages.
Advantages of volume analysis
- it helps confirm or refute signals obtained from fundamental and/or technical analysis;
- it enables assessing the demand and supply balance on any market and timeframe, which can be useful for forecasting future prices in both short and long terms;
- it aids in identifying market fraud and manipulation.
Disadvantages of volume analysis
- it can be complex and time-consuming as it requires analyzing a large volume of data;
- it does not always provide precise results, as trading volumes can be influenced by external factors such as news and exchange events.
FAQ
How to analyze the stock market?
Combine fundamental and technical analysis, giving priority to volume analysis, as it precisely enables the timely assessment of shifts in market sentiment by capturing the forces of supply and demand.
How to read stock market charts?
Add volume indicators to the chart and analyze the interaction between price and volume. Try evaluating price fluctuations as progress and volumes as applied efforts. Are the parties involved able to sustain the achieved outcome? What efforts are being exerted in the process? Who is more likely to lose money? These are just some of the questions to ask for the puzzle to come together.
What patterns exist in the behavior of price and volumes?
This question is too difficult to be answered in one or two sentences. But in simple terms:
How to use ATAS advantages for market analysisVolume Analysis
Trading involves high competition. To gain an advantage over other market participants, use the ATAS platform that specializes in volume analysis. The following platform’s tools will help you:
- Indicators. ATAS offers tick-level granularity, enabling volume analysis with maximum accuracy. Some of the most useful indicators include: Cluster Search, Big Trades, and Speed of Tape.
- Cluster charts (footprints). By accessing information inside candlesticks, you can make more informed decisions compared to traders who only see 1-minute candlesticks. Additionally, you can experiment with timeframes.
- Working with the Tape and the DOM. Useful ATAS tools for working with Level II and Order Flow include Smart DOM, DOM levels, Smart Tape. Do not forget the indispensable tool for scalpers — DOM Trader.
- Beginner-friendly. The blog, YouTube channel, and Knowledge Base provide specific instructions on setting up and working with charts, applying indicators, developing strategies, and other valuable information for traders employing volume analysis. Additionally, ATAS platform users can rely on responsive customer support.
- Market Replay. You can set up a market simulator to replay historical data, practice analyzing available tools and trade on a demo account as if in real time.
It is worth mentioning the capability to develop custom tools — indicators and automated trading strategies that can be connected via API. Thus, ATAS eliminates any limitations for analyzing cluster charts.
Conclusions
We have discussed three types of analysis for stock markets, cryptocurrency markets, and futures:
- fundamental analysis;
- technical analysis;
- volume analysis can be considered a branch of technical analysis, that has evolved into a separate and self-sufficient direction.
Each type of analysis has its advantages and disadvantages. No matter which approach you lean towards, it cannot guarantee a 100% profit.
- Be prepared for markets to behave differently than expected;
- Try combining various timeframes, types of analysis, and approaches;
- Use the ATAS platform, which helps you form your independent judgment about the current balance of supply and demand forces in the market, enabling you to make more informed trading decisions.
Download ATAS. It is free. During the trial period, you will get full access to the platform’s tools to experiment with market analysis. Moreover, you can continue using the program for free even after the 14-day trial period is over.
Do not miss the next article on our blog. Subscribe to our YouTube channel, follow us on Facebook, Instagram, Telegram, or X, where we publish the latest ATAS news.
Information in this article cannot be perceived as a call for investing or buying/selling of any asset on the exchange. All situations, discussed in the article, are provided with the purpose of getting acquainted with the functionality and advantages of the ATAS platform.


