
Imbalance is a significant difference in the sizes of the asset buy and sell orders, posted by the futures market participants. Perhaps most of you have heard a funny statement that ‘size matters not’ in relation to different types of activity. However, the futures market is definitely not among them since they are governed by ���monster trucks’ of institutional traders.
When a monster truck (a rebuilt or specially built truck with huge wheels and powerful engine) rides over a wrongly parked motor car, an imbalance is evident and often you cannot do anything about it.
The same is true about the trades of institutional traders in the futures market. Their orders are standing in the wings with the ‘working engine’. They are big and powerful and you’d better not stand on their way when they take off, since ‘monstrous’ trades of institutional players easily ride over small trades of retail traders, parked on the wrong side of the market. Institutional traders care little about what happens under the huge wheels of their big trades, that is why you need to find a way of their early detection so that your trades would avoid the destiny of the motor car from the above example. In this article, you will learn about one powerful instrument of the trading and analytical ATAS platform which will help you to do it.
In this article:
What are imbalances and why are they important?
Monster trucks are driven by powerful engines of hundreds or even thousands of horsepower. The futures market is driven by ‘horsepowers’ of monstrous volumes of institutional money. The power of this drive is limited only by a degree of the effort applied by institutional players to the accelerator pedal and the fuel comes in the form of big orders.
Strong imbalances can appear between aggressive buyers and sellers when a big interest of institutional players emerges in the market. They could be very significant in volumes and cover a wide range of prices.
There is a question: would you like to stay in a motor car watching how a monster truck, the driver of which floored the accelerator pedal, is rushing in your direction? You would hardly wish your trading capital to be on the wrong side of the market and consequently on the way of movement of big institutional trades, especially when they move simultaneously in one direction.
How to find them?
It’s quite easy to identify when a monster truck starts movement and in what direction it will move. All you need is to watch attentively.
When the capital of institutional players actively acts in one direction, imbalances could be seen if you look inside a candle. It is not difficult to do it but you will need the best technologies collected in the advanced trading and analytical ATAS platform which you can download free of charge using the link at the beginning of the article. As soon as you manage to remove jackets from candles in the candlestick price chart and look inside them, you have access to the imbalance analysis.
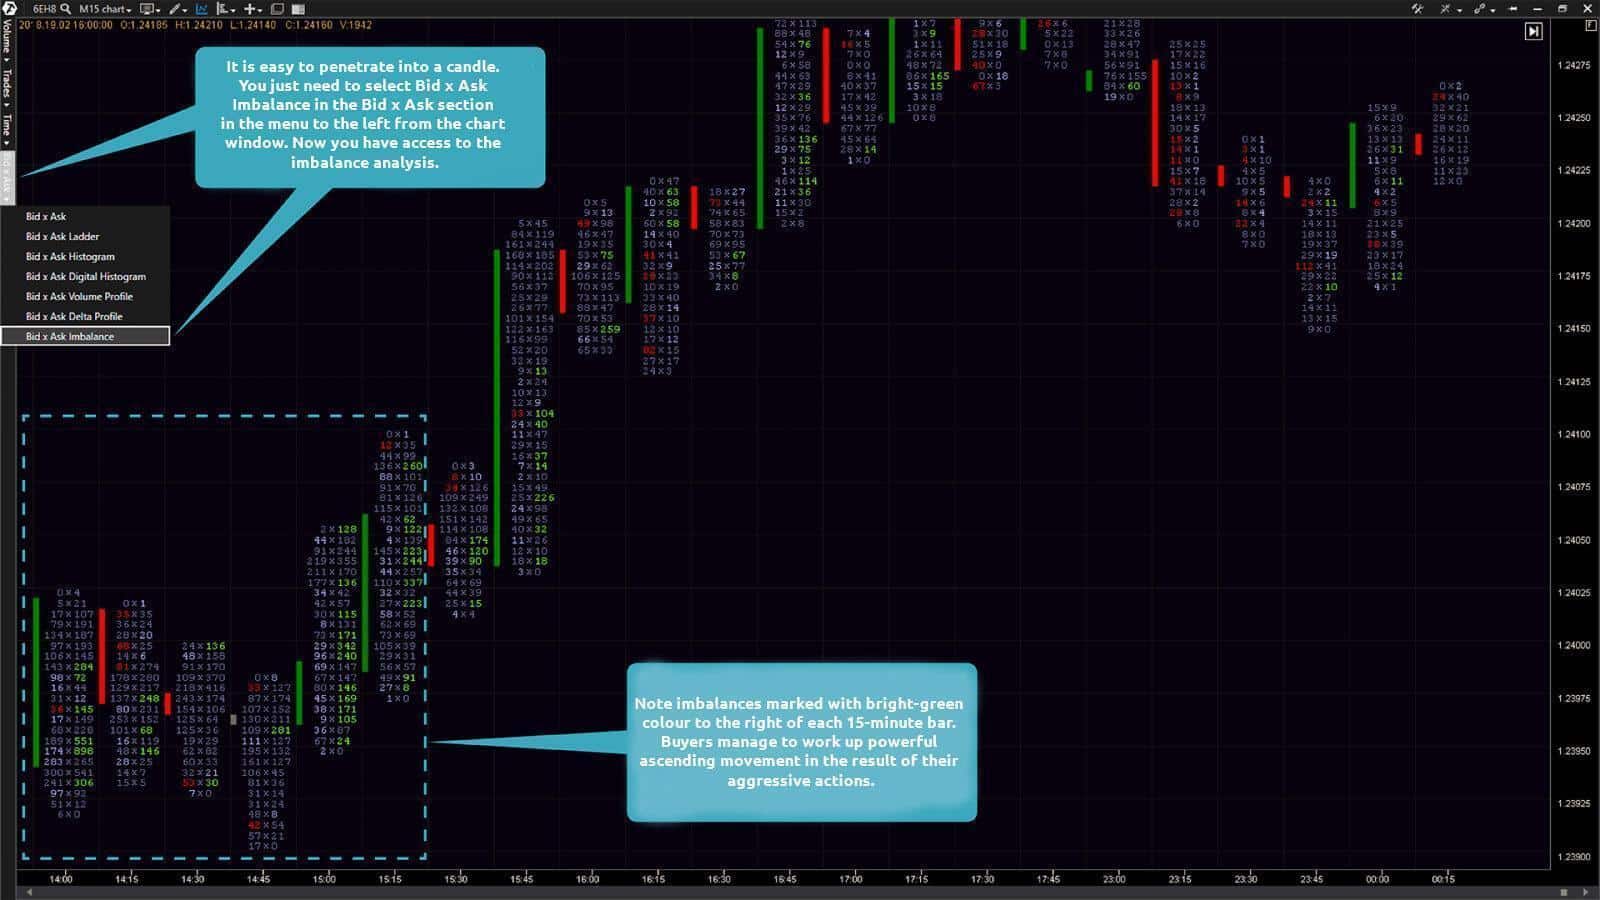
15-minute EUR futures (ticker: 6E) chart. Bid x Ask Imbalance footprint chart
What is good in being able to see monster orders?
Perhaps you already noticed that institutional players, before working up a focused movement, work out the same price levels. The chart below shows their consecutive actions on the whole range between the price quotes of 1.23950 and 1.24065. The ATAS platform allows to mark imbalances by bright colour which will help you to assess without much effort who’s got the initiative and, consequently, in what direction the market would, most probably, move.
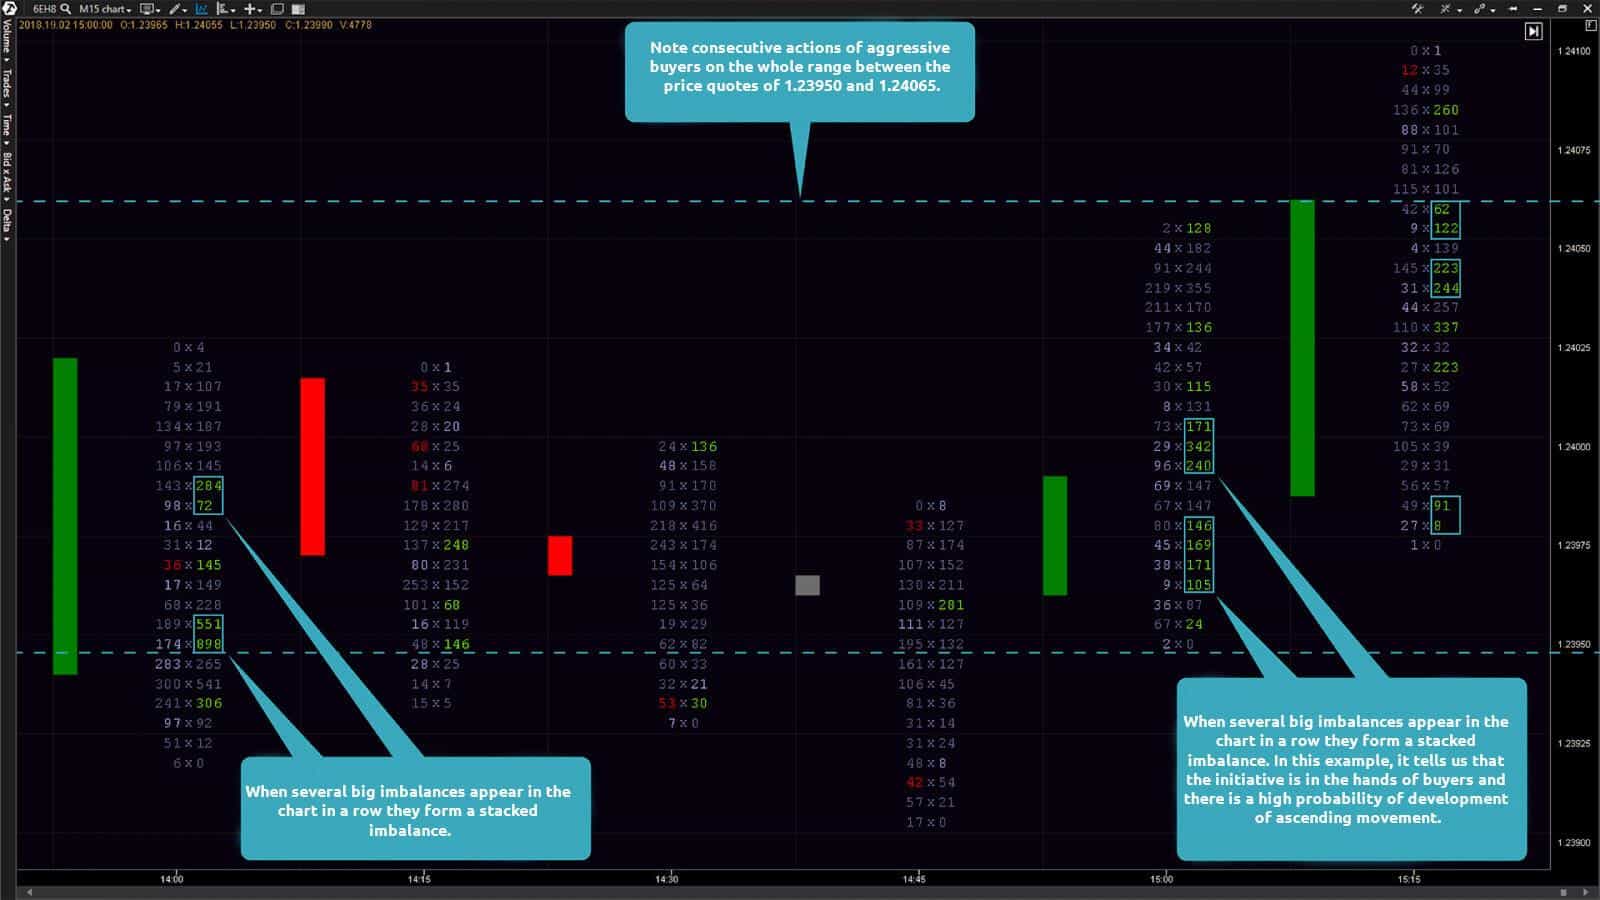
15-minute EUR futures (ticker: 6E) chart. Bid x Ask Imbalance footprint chart.
Now you can see how easy it is to detect really big imbalances that emerge in the futures market in the real time mode. When several big imbalances appear in the chart in a row they form a stacked imbalance.
You can also see from the above chart that a significant part of aggressive trades are executed by buyers. Their aggressive actions are displayed in detail in the right part of the two lattermost bars. Aggressive buyers practically simultaneously floored the accelerator pedals which resulted in the emergence of the biggest number of stacked imbalances coloured bright green. If you would have watched how these imbalances were formed in the real time mode, you would have several possibilities to open a long position alongside with monster trucks of institutional players.
How can you benefit from it?
It is not simply easy to notice monster trucks, it is simply impossible to miss them due to advanced technologies of the ATAS platform. Monster trucks are huge and are coloured in bright colours which you had an opportunity to see for yourself.
The market imbalances are hidden inside candles. It doesn’t mean that you cannot look inside of them. You can attach bright colours to them in the ATAS platform settings like monster trucks of the futures markets, which they are in reality. After that they will always be within the field of your view.
As we already demonstrated in the first chart, you can do it quickly and easily. You just need to select Bid x Ask Imbalance in the Bid x Ask section in the menu to the left from the chart window. Such a presentation of the futures market data is a very efficient instrument in the hands of a retail trader which helps him to detect such institutional monstrous trades in time.
If you suddenly noticed that imbalances had been formed against your trade, they would most probably ride over it with their huge wheels. However, if a stacked imbalance looks into your direction you just will not be able to avoid losses. Having jumped into the cabin of an institutional monster truck with one of your trades, you will ride over a trading deposit of some retail trader who, unlike yourself, has no idea about imbalances and, consequently, about the majority of advanced instruments of the market analysis of the ATAS platform! As a result, you will most probably need your own real monster truck to take your profit to the bank depository.
Modern Tools for Analyzing Imbalances
As the ATAS trading and analytics platform advances, it introduces more tools with enhanced features, helping traders detect imbalances on the chart and use them to make informed trading decisions.
The tools include:
- cluster charts;
- imbalance indicators;
- market profile.
How Cluster Charts Show Imbalances
Let’s take the chart of the TON token as an example to demonstrate how to identify balances and imbalances in the crypto market.
A cluster chart enables you to “look inside” the candles and see the balances and imbalances:
- red clusters indicate a seller dominance
- green clusters indicate a buyer dominance.
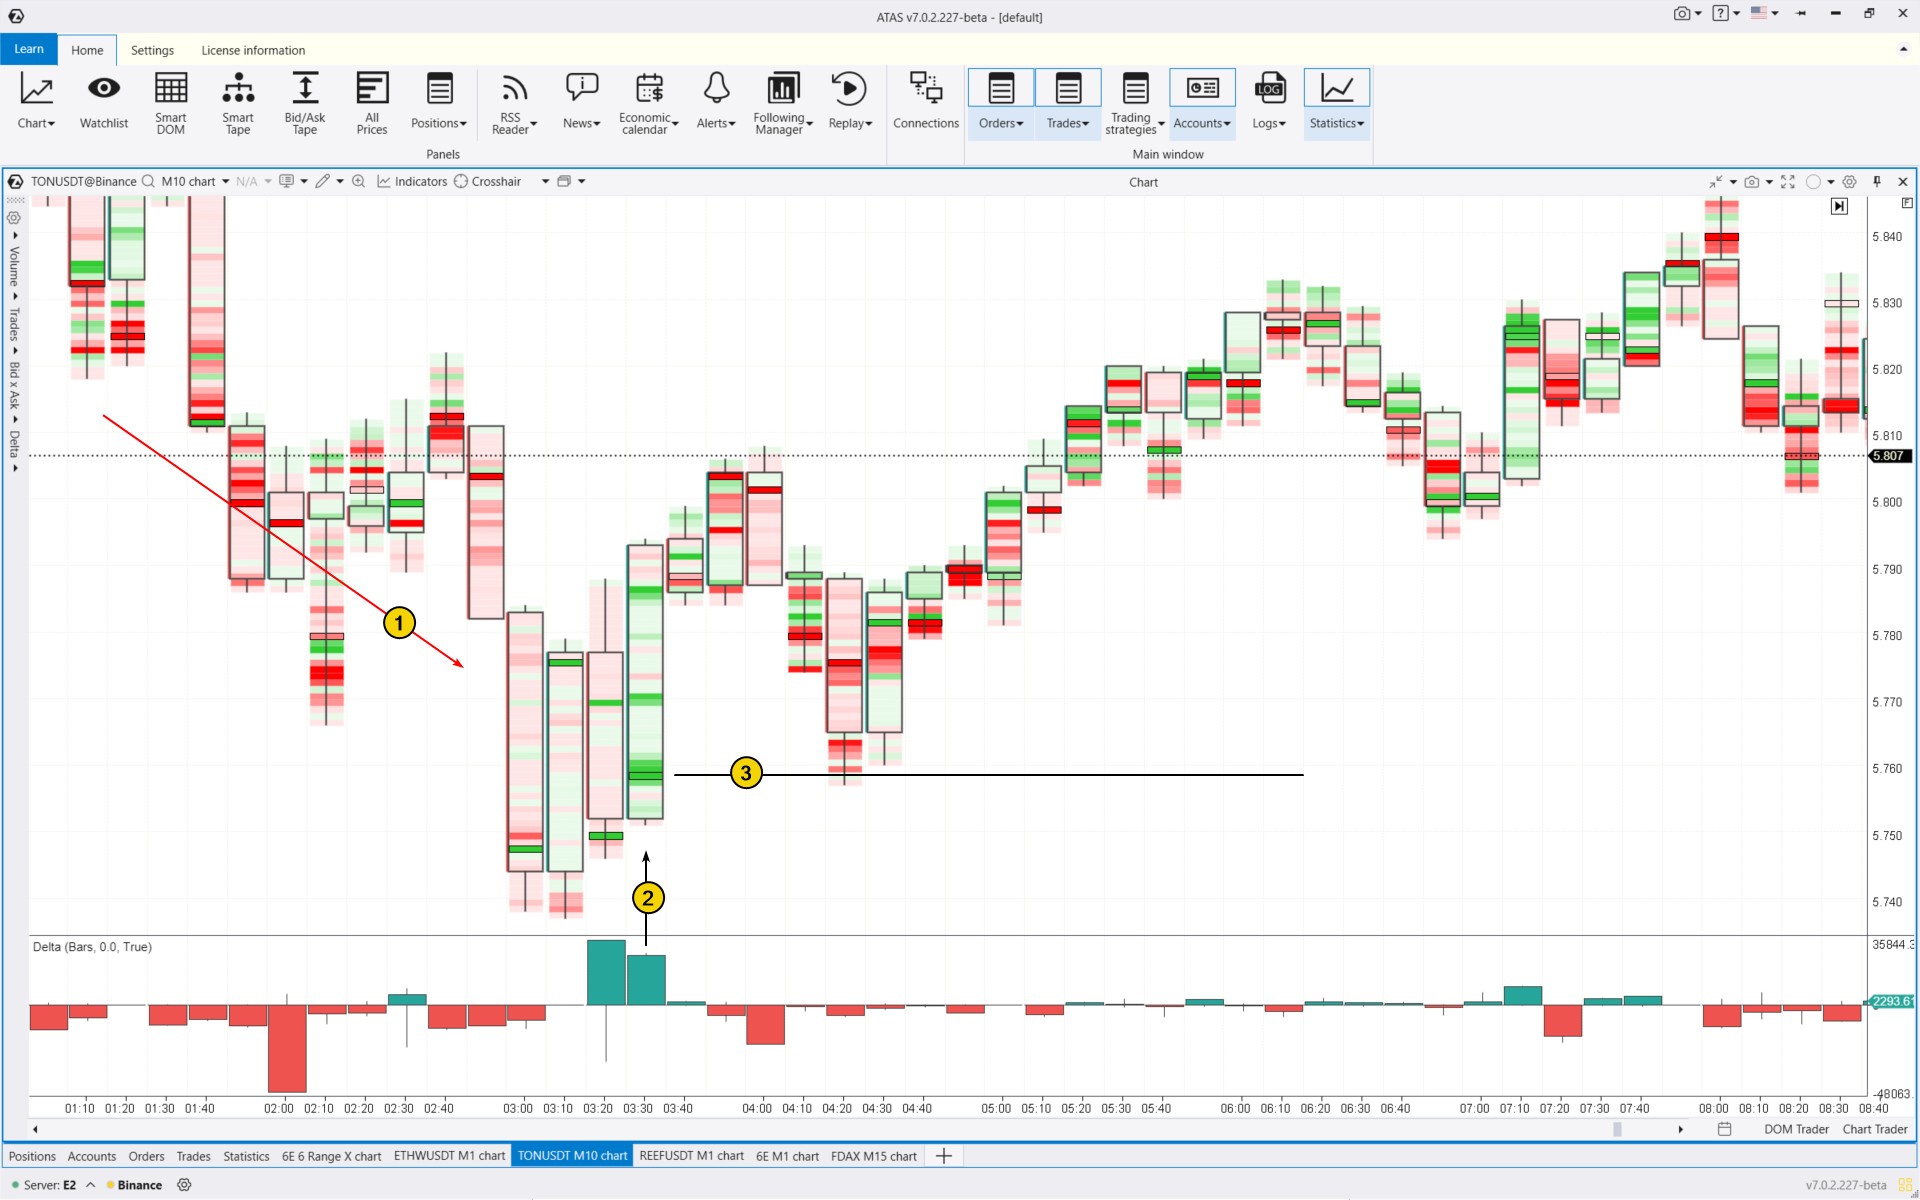
The chart shows the following events:
In the left part of the chart, the market balance was disrupted in favor of the sellers (1) — the price dropped under their pressure, as indicated by the bright red clusters.
But what happened next? The price surged with a wide candle (2) that closed near the high — a clear sign the bulls were stepping in. The bright green clusters (along with a spike in positive delta) show that market buyers gained the upper hand. As a result, the level drawn from the brightest green cluster (indicating that buyers made a strong effort to shift the balance in their favor) acted as support (3).
More information about reading cluster charts can be found in our article on Footprint patterns.
Stacked Imbalance Indicator
The ATAS Stacked Imbalance indicator can be used for volume imbalance trading. It compares volumes at levels within the candle to identify supply and demand imbalances, providing insight into the current market conditions.
Below is an example of analyzing imbalances on the chart of a major cryptocurrency using the Stacked Imbalance indicator:
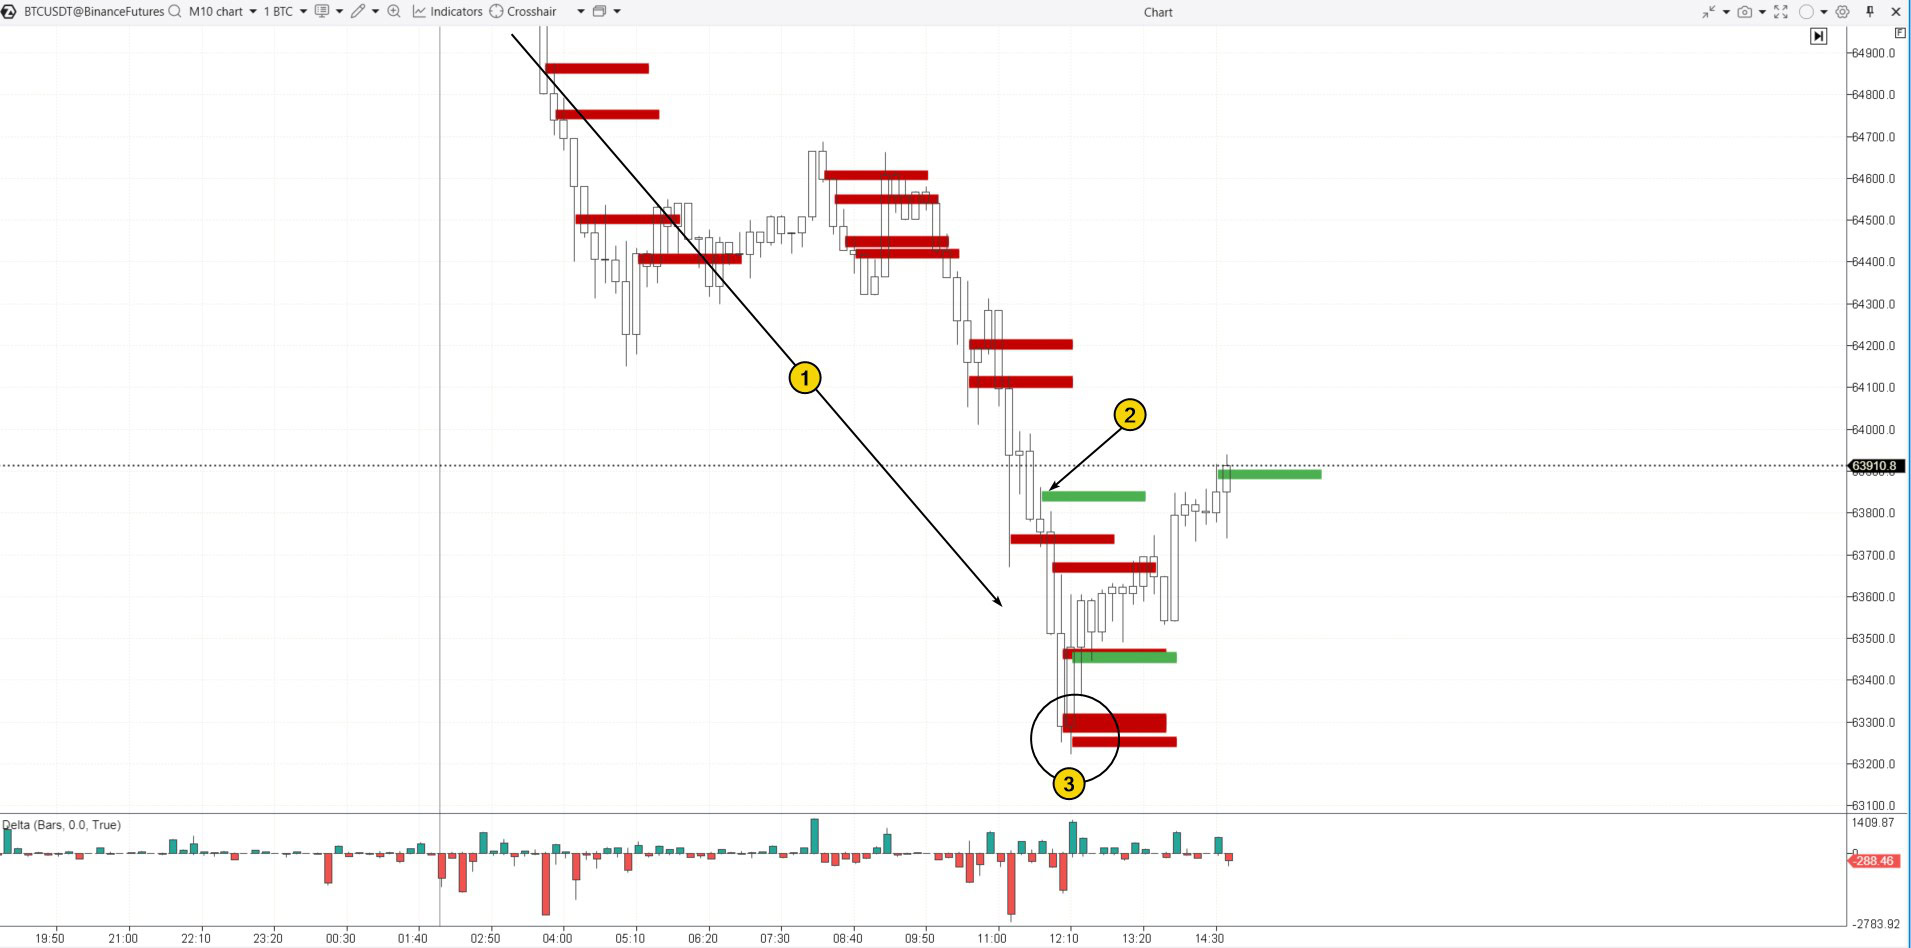
The chart shows that as the downtrend developed (1), the indicator consistently signaled with red lines.
The appearance of an imbalance favoring buyers (2) led to a trap for them, confirming the bearish nature of the market.
The downtrend ended (or paused) with a series of bearish imbalances (3), signaling panic and a selling climax.
Market Profile
The ATAS Market Profile & TPO indicator is a powerful tool for analyzing horizontal volumes on a chart.
You can use it to spot market balances and imbalances in trading based on the following principles:
- bulges in the profile indicate a balanced market, where supply and demand are roughly equal;
- thin areas in the profile suggest an imbalanced market, where prices moved quickly through those levels because one side was in control.
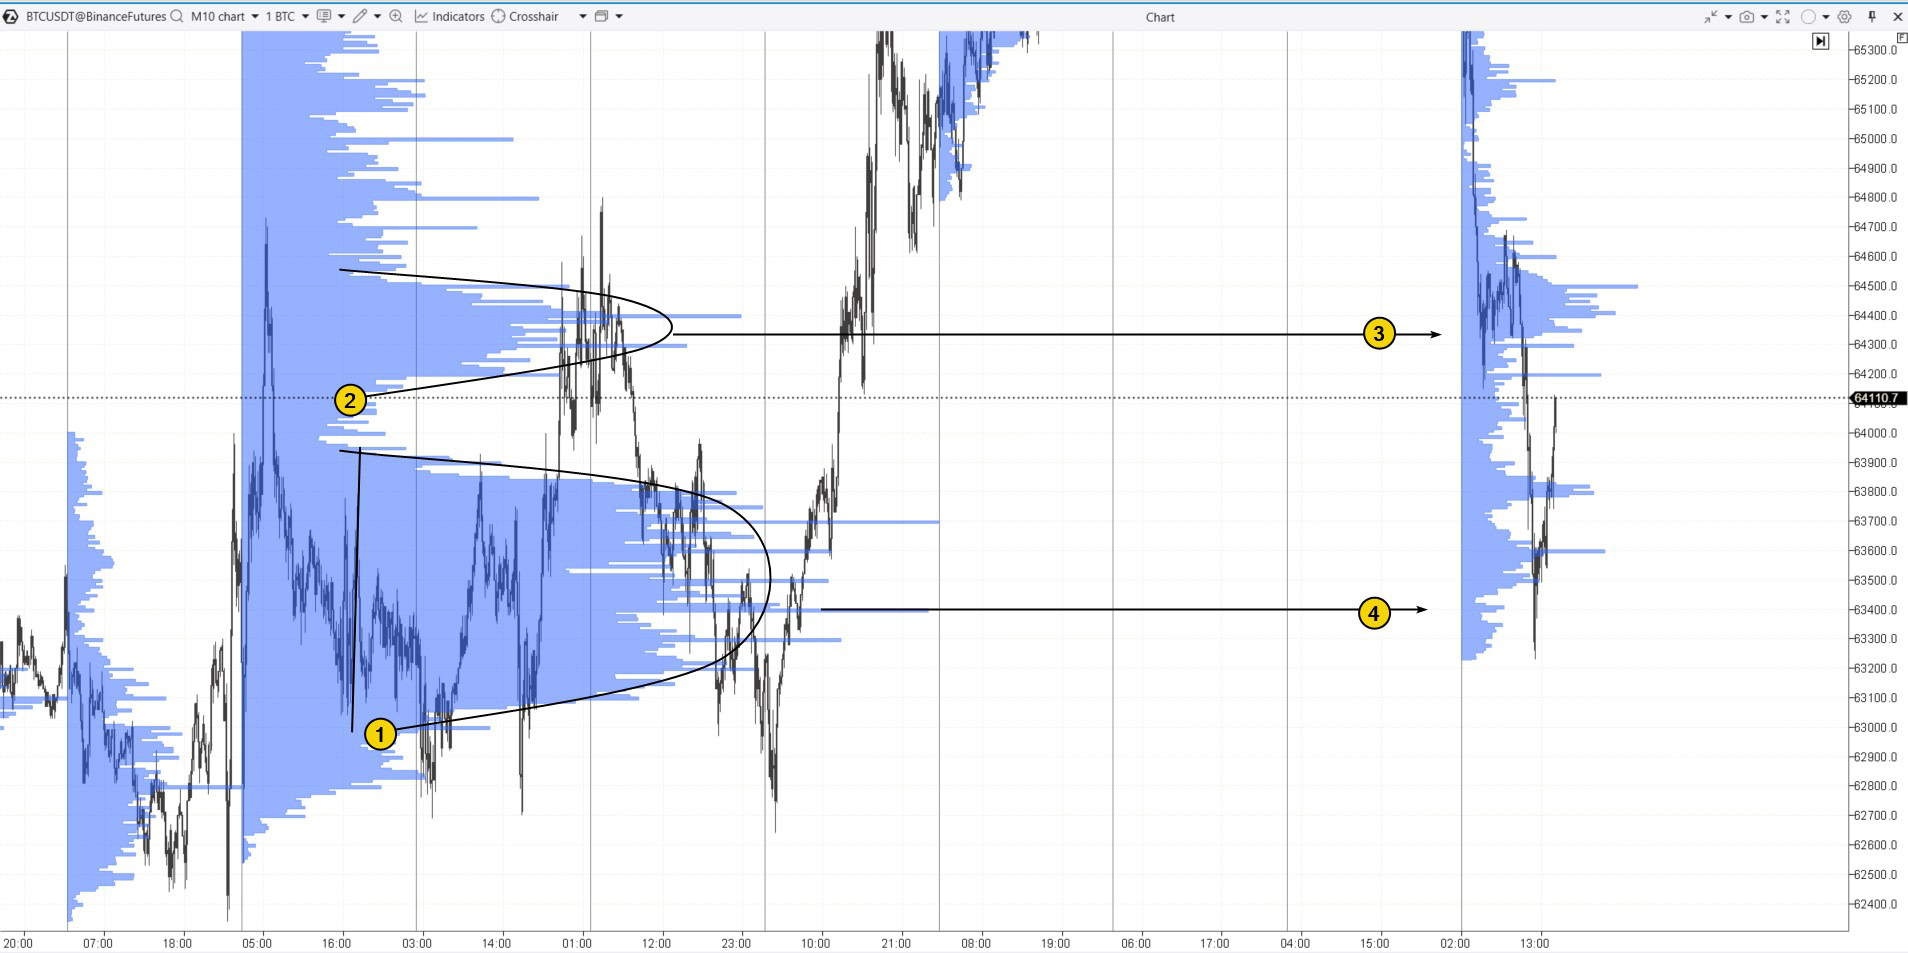
You can see an example on a Bitcoin chart above. It shows crypto imbalances and balances in the market. These balances can be useful for trading, as they often serve as support and resistance zones. For example:
- the bulge (balance) number 2 on the left side of the profile acted as support and halted (3) the sharp price drop;
- the bulge (balance) number 1 on the left side of the profile served as support and led to a significant bounce (4), which could result in a major bullish reversal.
For more details on using market profile to identify balances, imbalances, and make trading decisions, check out the following articles:
Imbalance Trading Strategy
Price interaction with levels where imbalances are identified can be a key factor in developing your strategy to trade imbalances.
For example, if imbalances indicate seller dominance and:
- the price is falling — it is likely that the market is under pressure;
- the price “refuses” to drop — this may indicate that sellers are trapped, and the momentum could shift to the bulls.
The opposite holds true for bullish imbalances:
- if the price is rising where buyers are in control, it signals an upward trend;
- if the price is not rising despite buyer dominance, it might suggest a potential downtrend.
To learn how to apply this logic for market analysis without risking your capital, use the ATAS Market Replay simulator for traders. It enables you to practice trading, including imbalance strategies, using historical data as if the events were unfolding in real time.
To try the simulator, download the ATAS platform for free and then:
- Open a chart of a financial instrument you are interested in;
- Start the Replay mode;
- Activate the Replay mode (the icon should turn green);
- Adjust settings if needed;
- Use Play/Pause to control playback;
- Use the Chart Trader panel to trade on the built-in Replay account.
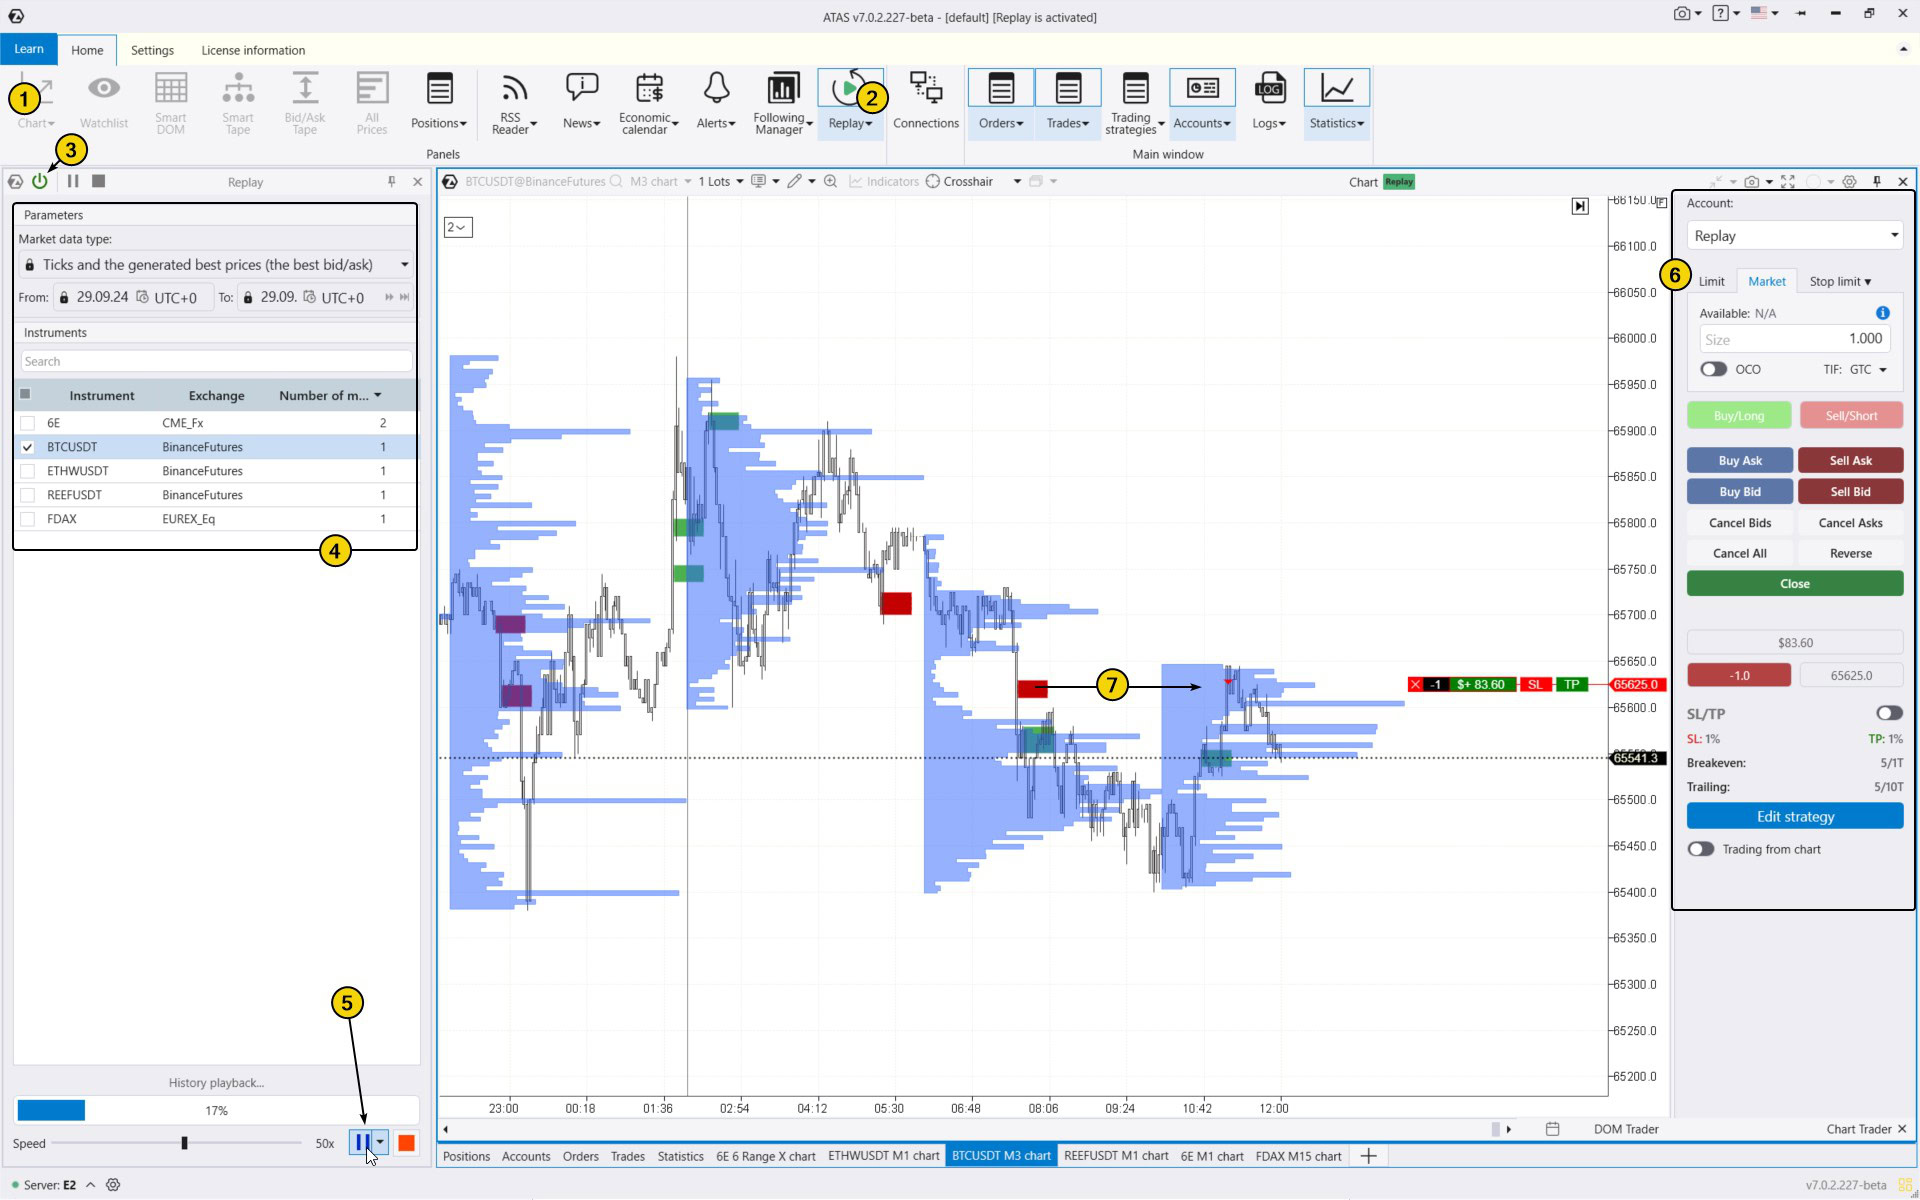
Number 7 indicates how the price turns downward from the level where an imbalance indicating seller dominance was detected (thin profile + signal from the Stacked Imbalance indicator).
For your imbalance trading strategy to be effective, it is important to consider not only your personal circumstances and signals from 1-2 indicators, and your capital and risk management rules, but also the current market situation (analyzing higher timeframes). Additionally, pay attention to fundamental news and adapt your strategy to changing market conditions.
FAQ
What is an imbalance in trading?
In trading, buying and selling imbalances refer to a situation where there are more market orders to buy than to sell, or vice versa. This often leads to sharp price changes as the market tries to find a balance between supply and demand.
What is a trade imbalance?
Traders use volume indicators to spot imbalances and use this information to make more informed trading decisions. When there is more buying than selling, the price may start to rise, leading to the formation of support levels on the chart as buyers are eager to spend money to acquire the asset. On the other hand, an excess of selling can cause prices to drop and create resistance levels, as sellers lower prices to attract buyers.
Conclusions
Balance and imbalance trading refers to moments in the interaction between buyers and sellers when one side clearly has the upper hand. This is reflected in specific patterns on the chart that become noticeable during volume analysis.
Signs of an imbalance in the market where sellers are in control include a thin profile, bright red clusters, pale green clusters, spikes in negative delta, and an increase in selling velocity. The opposite holds true for buyers.
The imbalance trading strategy focuses on opening and closing positions based on the levels where these signs are observed. Examples are provided in this article.
When trading imbalances in cryptocurrencies, futures, or stocks, traders align with current market trends, which gives them the edge needed to thrive in a competitive environment.
Pros of Imbalance Trading Strategy
✔ Better understanding of market dynamics, including the causes of trend movements and price reversals.
✔ More accurate identification of trading levels, which helps reduce risk and increase potential profit.
✔ It can be applied to various markets, particularly useful for intraday trading.
Cons of Imbalance Trading Strategy
✘ It requires professional software and real-time exchange data, which can be challenging for beginner traders.
✘ It involves working with large amounts of data, increasing the risk of overtrading.
✘ It requires experience and skills to accurately interpret volume analysis tools.
Download ATAS. It is free. Once you install the platform, you will automatically get the free START plan, which includes cryptocurrency trading and basic features. You can use this plan for as long as you like before deciding to upgrade to a more advanced plan for additional ATAS tools. You can also activate the Free Trial at any time, giving you 14 days of full access to all the platform’s features. This trial allows you to explore the benefits of higher-tier plans and make a well-informed purchasing decision.
Information in this article cannot be perceived as a call for investing or buying/selling of any asset on the exchange. All situations, discussed in the article, are provided with the purpose of getting acquainted with the functionality and advantages of the ATAS platform.


