Any exchange is a battleground between technology and people, each pursuing their own interests. In such an environment, having a competitive edge is crucial. That is why we developed the ATAS platform (Advanced Trading Analytical Software). Initially created for our own use, it proved to be exceptionally effective, so we decided to make it available to everyone.
If you are reading this, you are probably looking for ways to profit from price movements on exchanges. Our platform can help you with that. However, keep in mind that ATAS is not a magic tool with a “Profit” button but a reliable and indispensable instrument for professional trading.
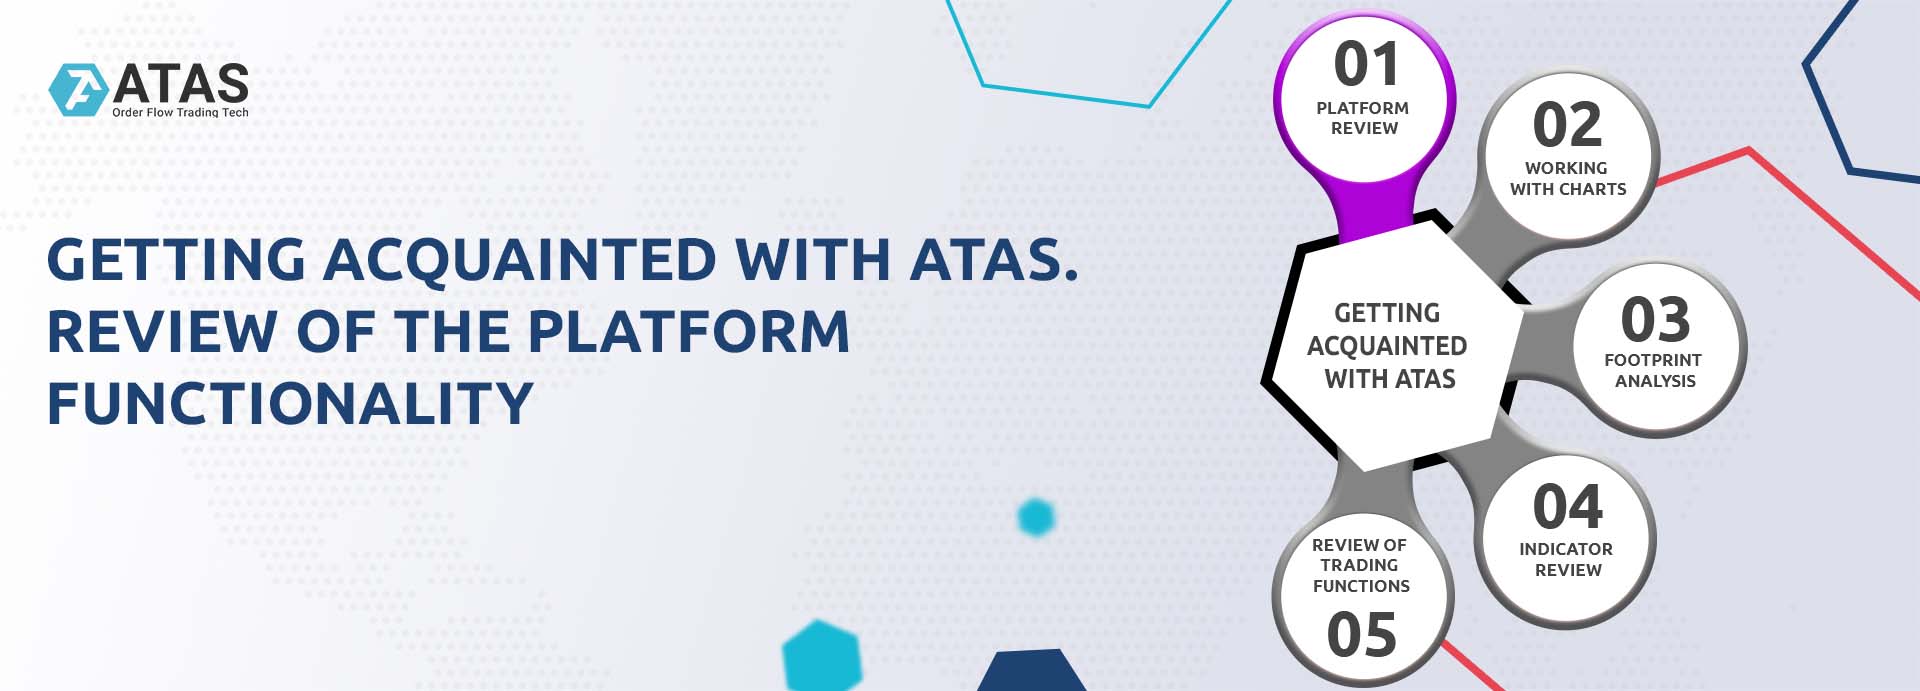
Introduction
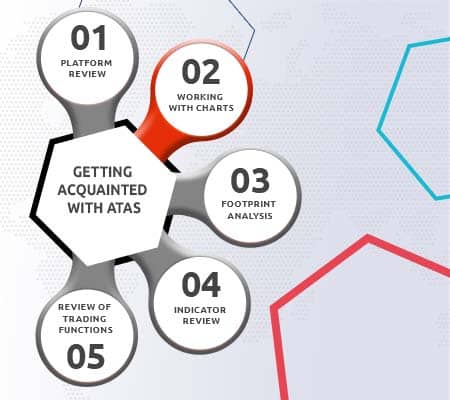
Getting Acquainted With ATAS is a series of 5 articles designed for those interested in volume analysis but who have yet to try the platform in action.
Each article in the series consists of two parts: a video overview and a text section. We recommend starting with the video and then using the text material, enhanced with screenshots and links to helpful resources, to reinforce your knowledge.
The first article covers an overview of the platform.
Here, we will briefly explain:
- what ATAS can do;
- how to start using the platform;
- what components are included.
The purpose of this overview is to demonstrate how the powerful tools of the ATAS platform provide a significant advantage in trading.
Part 1. A Video Overview
Part 2. A Text Description
In this section, we will cover:
If you have any questions, feel free to contact our support team, we will be happy to help.
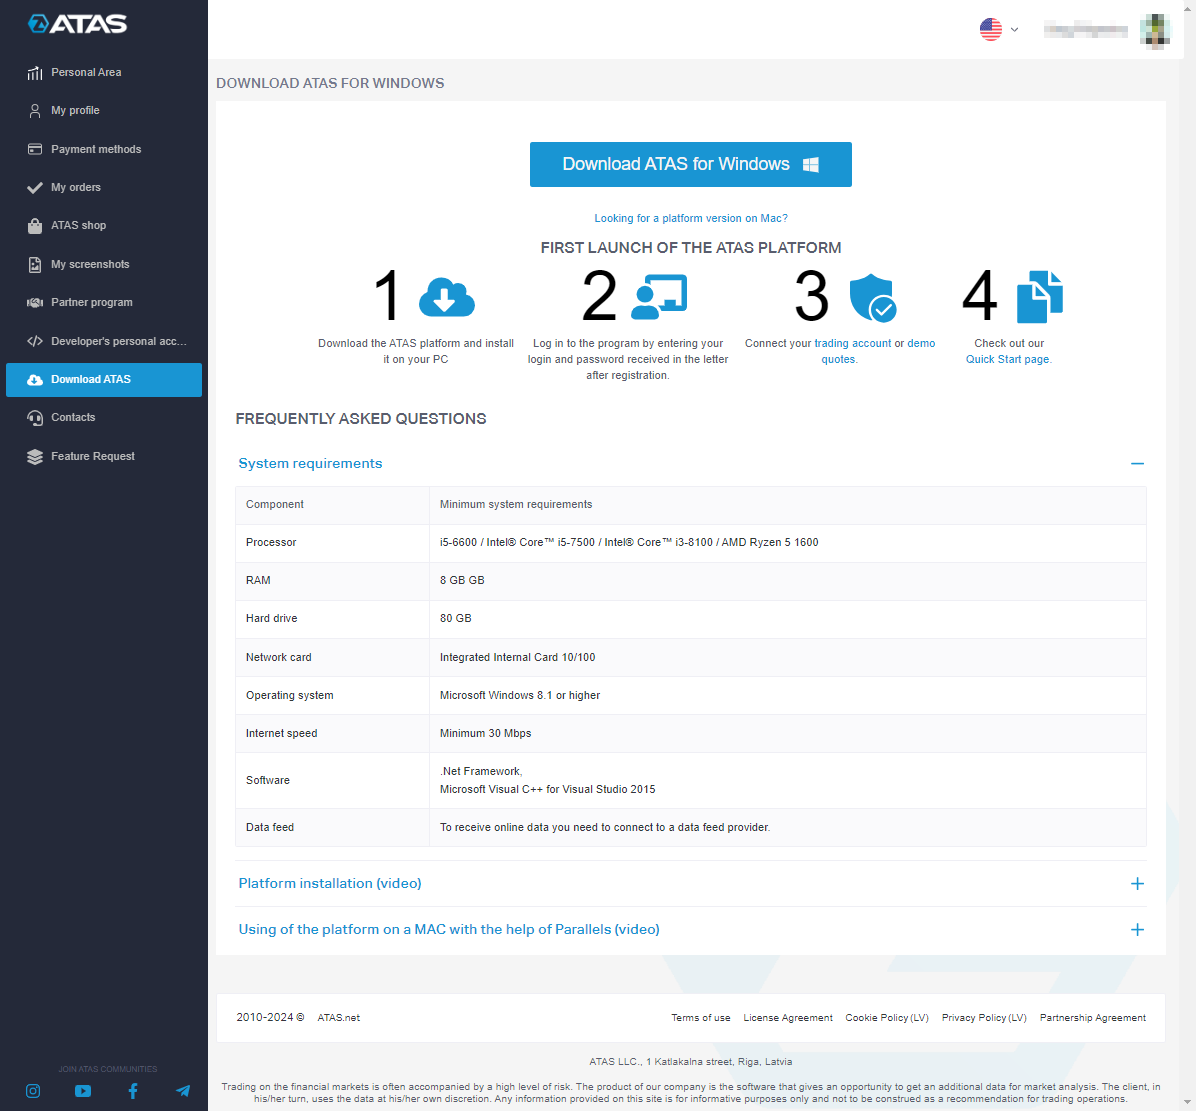
HOW TO DOWNLOAD THE PLATFORM
It is easy with three steps:
- Visit atas.net.
- Register by providing your current email.
- After registering, log in to your account. In the Download section, you will find a link to download the installer.
Useful links – bookmark them and stay updated:
- License pricing. Licenses are often available at a discount during promotions.
- ATAS YouTube channel. Webinars with professional traders, and video overviews of ATAS platform features.
- ATAS blog. Useful articles on trading and volume analysis.
Be sure to check out the Knowledge Base. It contains comprehensive instructions for indicators, modules, account connections, quotes, and other platform elements. You can find:
MAIN WINDOW OF THE ATAS PLATFORM
Upon loading, the Main Window opens. This is where the management of all modules and elements of the platform takes place.

| Top Bar (1) | Main Menu Tabs (2) | Main Menu Buttons (3) | Workspace (4) |
| Here you can find: | There are four tabs: | For example: | |
| Program version and workspace name (if loaded);
Help menu; Interface language selection button (languages available include English, Spanish, German, Russian, and others); Screenshot creation button with subsequent online upload. | Learn. Educational materials on volume analysis and using the ATAS platform.
Home. Frequently used buttons. Settings. Tools for platform customization (colors, workspaces, time zones, and other settings discussed below). License information. Duration and type of active license. | the Chart button opens the chart module,
the Connections button opens the connections manager window. The set of buttons changes when switching tabs. | This is where you can organize your trading journal and view account data, trades, and positions. You can also add charts and other modules here. |
LEARN TAB
The Learn tab in the main menu (highlighted in blue) offers helpful tutorials on using the platform and basic information about tools for volume analysis.
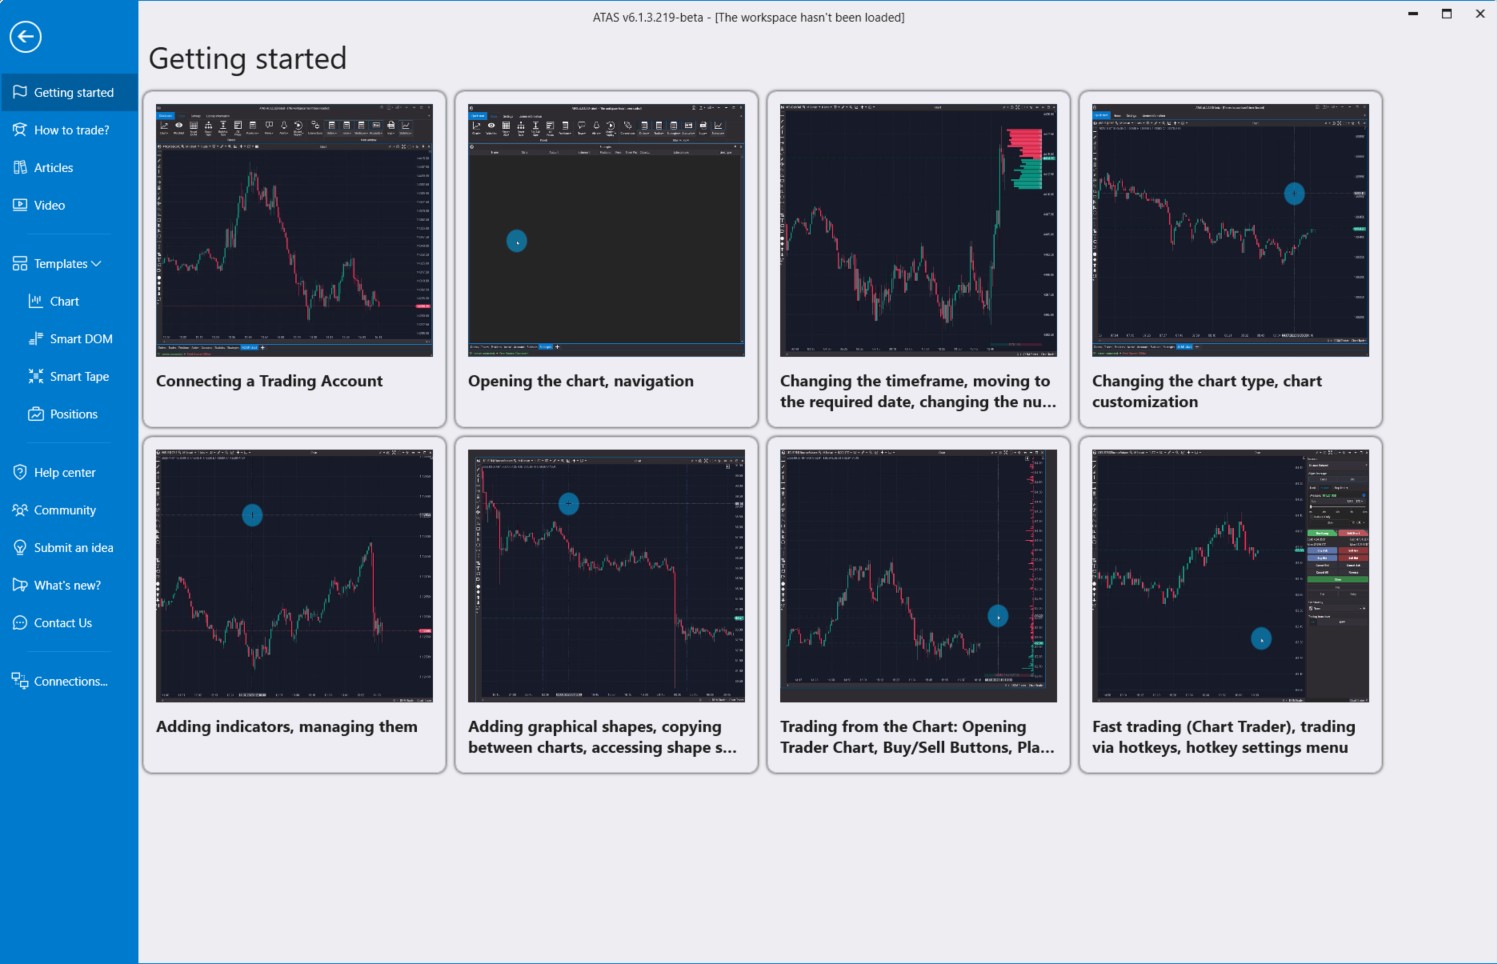
Without leaving the platform, you can:
- watch animations showing how to perform basic actions (e.g., opening a chart, connecting quotes);
- learn how to use indicators;
- read helpful articles and watch videos about trading for beginners;
- use pre-installed templates;
- reach out to support or join the community.
CONNECTING QUOTES
ATAS connects to its servers to load historical data.
To receive real-time data, you need to set up connections with exchanges/brokers.
To manage connectors, click the Connections button. In the window that opens:
- Click Connect to activate an existing connection;
- Click the Gear icon to configure the connection;
- Click Add to create a new connection.

In the window that opens, select the desired connection (available connections include cryptocurrency markets, futures brokers, and other connectors). Then click Next and follow the instructions.
In the connection manager, check the Auto Connect box to ensure the connection is automatically activated when the ATAS platform loads.
Useful links:
Once the quotes are connected, you can take full advantage of Smart DOM, Smart Tape, Chart, and other modules, which we will discuss next.
SMART DOM MODULE
DOM stands for the Depth of Market. The Smart DOM is a specialized module for working with the order book.
In the Smart DOM, you can see limit buy (1) and sell (2) orders.

We call it “Smart” because it offers features such as:
- displaying profiles (3);
- showing your open trades and orders;
- tracking executed trades on the exchange (4);
- saving and loading various templates.
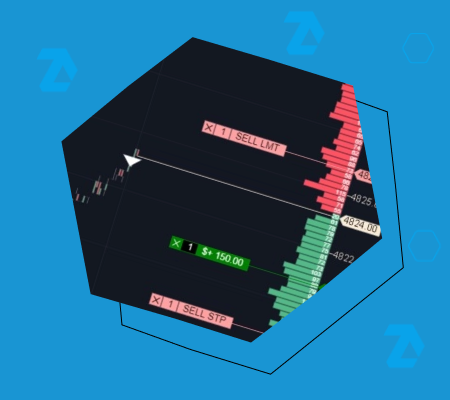
A key advantage of the Smart DOM is its trading functionality.
You can place orders by clicking on the Bid and Ask columns. To cancel an order, click the X at the bottom. You can also place market orders by clicking MKT at the bottom of the columns.
For trader’s convenience:
- the top panel includes account selection, trade volume selection, and an exit strategy function;
- the bottom panel has buttons for reversing or closing all positions.
Useful links:
SMART TAPE MODULE
The Smart Tape is an advanced time and sales ticker, providing data on recently executed trades in a familiar columns format—Time, Price, Volume, etc.
Unlike similar tools, the Smart Tape module in the ATAS platform presents data streams in an easy-to-analyze format by grouping similar orders (aggregation algorithm).

This smooths the tape’s movement, making it easier to follow.
- Red text indicates market sells, while green text indicates buys.
- Blue text highlights out-of-spread trades.
- The +/- column shows the number of consecutive Up/Down ticks. For example, if the price was 100 and the next trade is at 101, you will see a “+”. If another trade occurs at 101, the “+” remains. If the following trade is at 102, it changes to “++”. If a trade occurs at 101 afterward, you will see a “-“.
Other features include:
- a “freeze tape” button that enables you to pause the tape to analyze specific sections closely;
- filters to eliminate market noise;
- indicators for tape speed and buying/selling strength;
- flexible customization for colors and templates.
A key feature is that Smart Tape allows you to trade directly. You can use it as a standalone module or alongside other tools. For convenience, the top panel includes account selection, trade volume options, and exit strategy functions. The bottom panel has buttons for reversing or closing all positions.
Useful links:
BID/ASK TAPE AND ALL PRICES MODULES
The Bid/Ask Tape module, also known as the Spread Tape (highlighted as 1), shows buys and sells within the spread. While the spread remains constant, buy trades accumulate in the print. This presentation style is useful for clearly identifying the balance between buyers and sellers, helping you see who has the initiative.
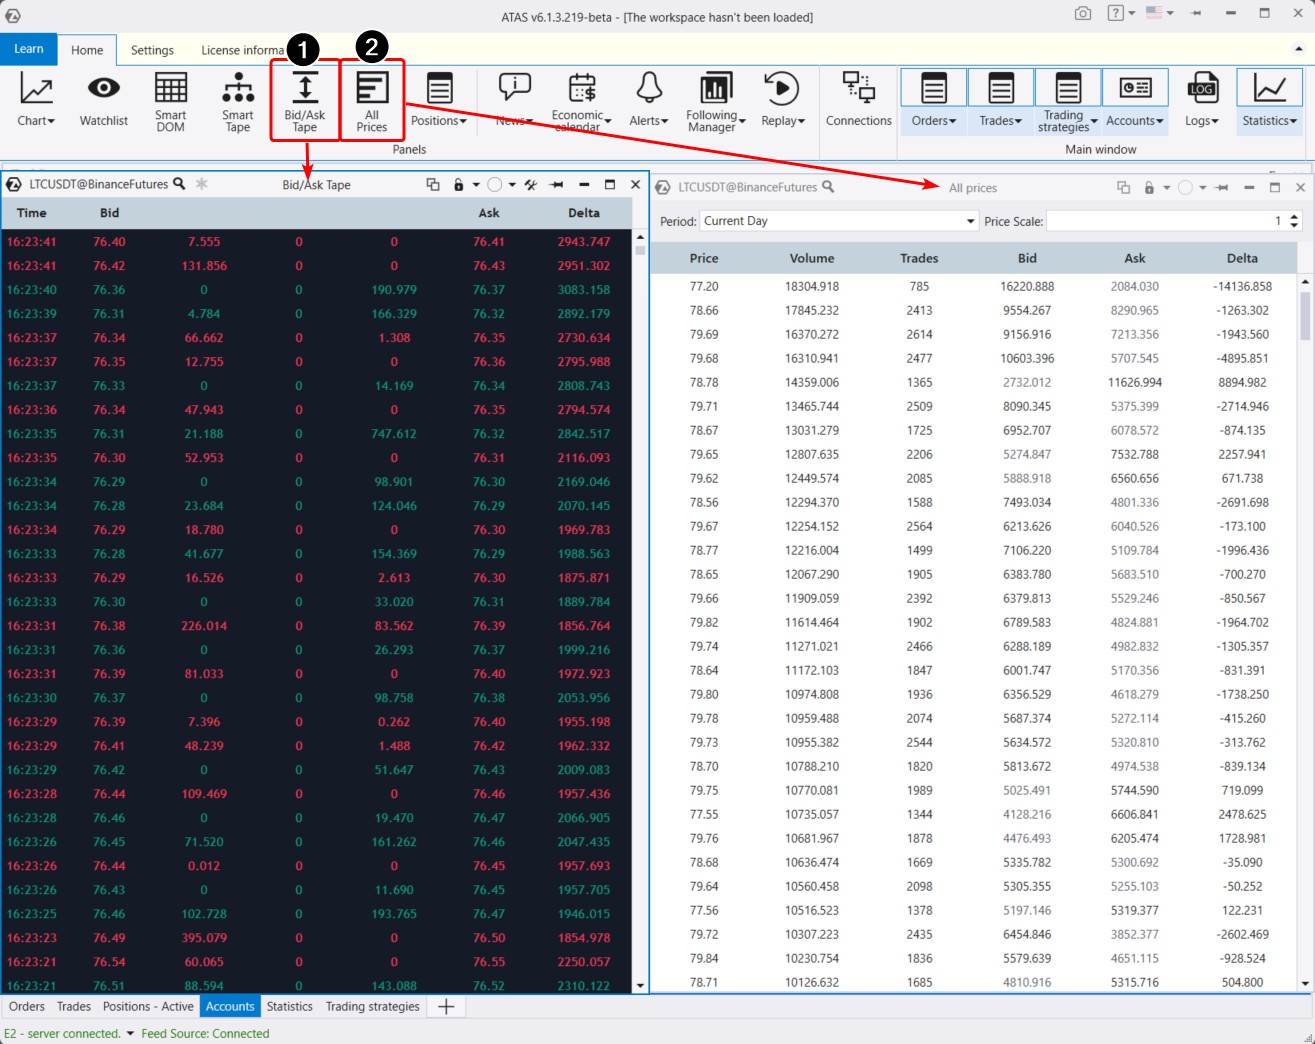
In the All Prices module (2), you will find statistical data for each price level, such as the number of trades, total volume, and delta. You can filter this information by date and sort it in ascending or descending order.
Useful links:
ALERTS AND ECONOMIC CALENDAR MODULES
The Economic Calendar module is a tool designed to help you keep track of fundamental events that might impact financial markets. It lists dates and times for the release of key statistical data, like inflation rates, unemployment figures, GDP growth, central bank interest rate decisions, and other important economic news. Traders use this calendar to plan their trading activities, aiming to reduce risks during expected volatility spikes, as significant news releases can greatly influence the prices of currencies, stocks, and other financial instruments.
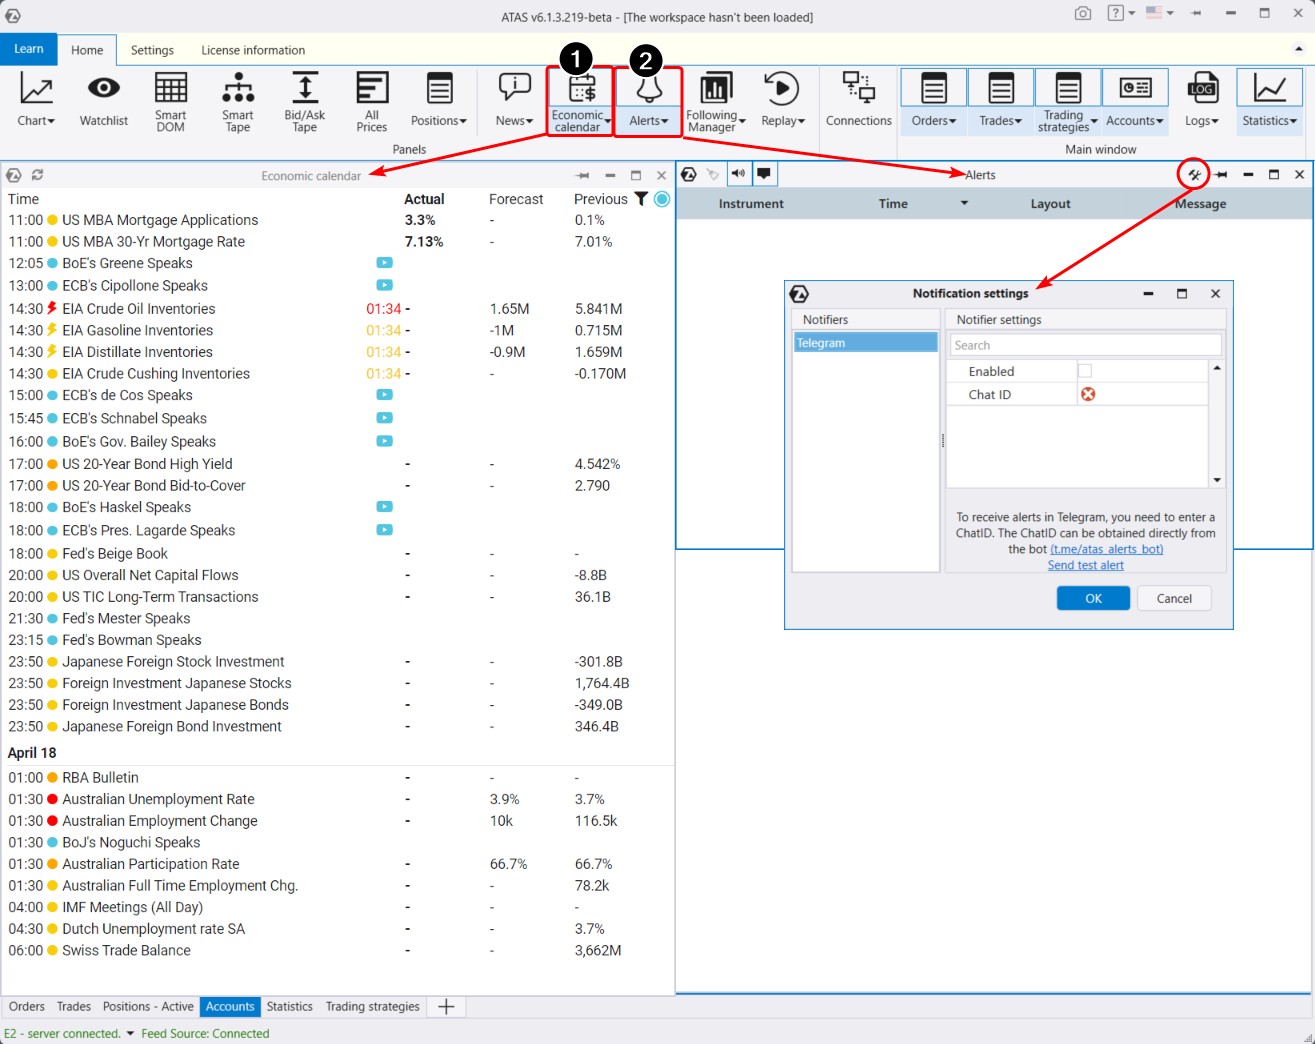
The Alerts module helps you monitor notifications and set them up for transmission to Telegram.
Useful links:
Market Replay Module
The Market Replay module is a tool that enables traders to practice their trading skills without risking real money. This feature is often referred to as a simulator or trading trainer.
With ATAS Market Replay, you can:
- replay historical data as if the trading were happening in real time.
- trade on a demo Replay account.
To start using ATAS Market Replay (see the screenshot below):
- Click the Replay button in the main menu;
- Configure the settings: activate Replay mode, select the chart, choose the data type, and select the time period;
- Click Play.

Advantages of Market Replay:
- supports cryptocurrencies, futures, and stocks;
- allows you to adjust playback speed;
- works with chart modules, Smart DOM, and others;
- supports footprints, indicators, algorithmic strategies, and other tools from the ATAS arsenal.
Useful links:
CHART MODULE
This is probably the main module and there is a lot of information about it. To make it easier, we have divided it into 3 sections:
- Menu overview.
- Cluster charts.
- Chart Trader.
To open the module, click the Chart button (1) in the main menu, and then select the instrument whose chart will be displayed.
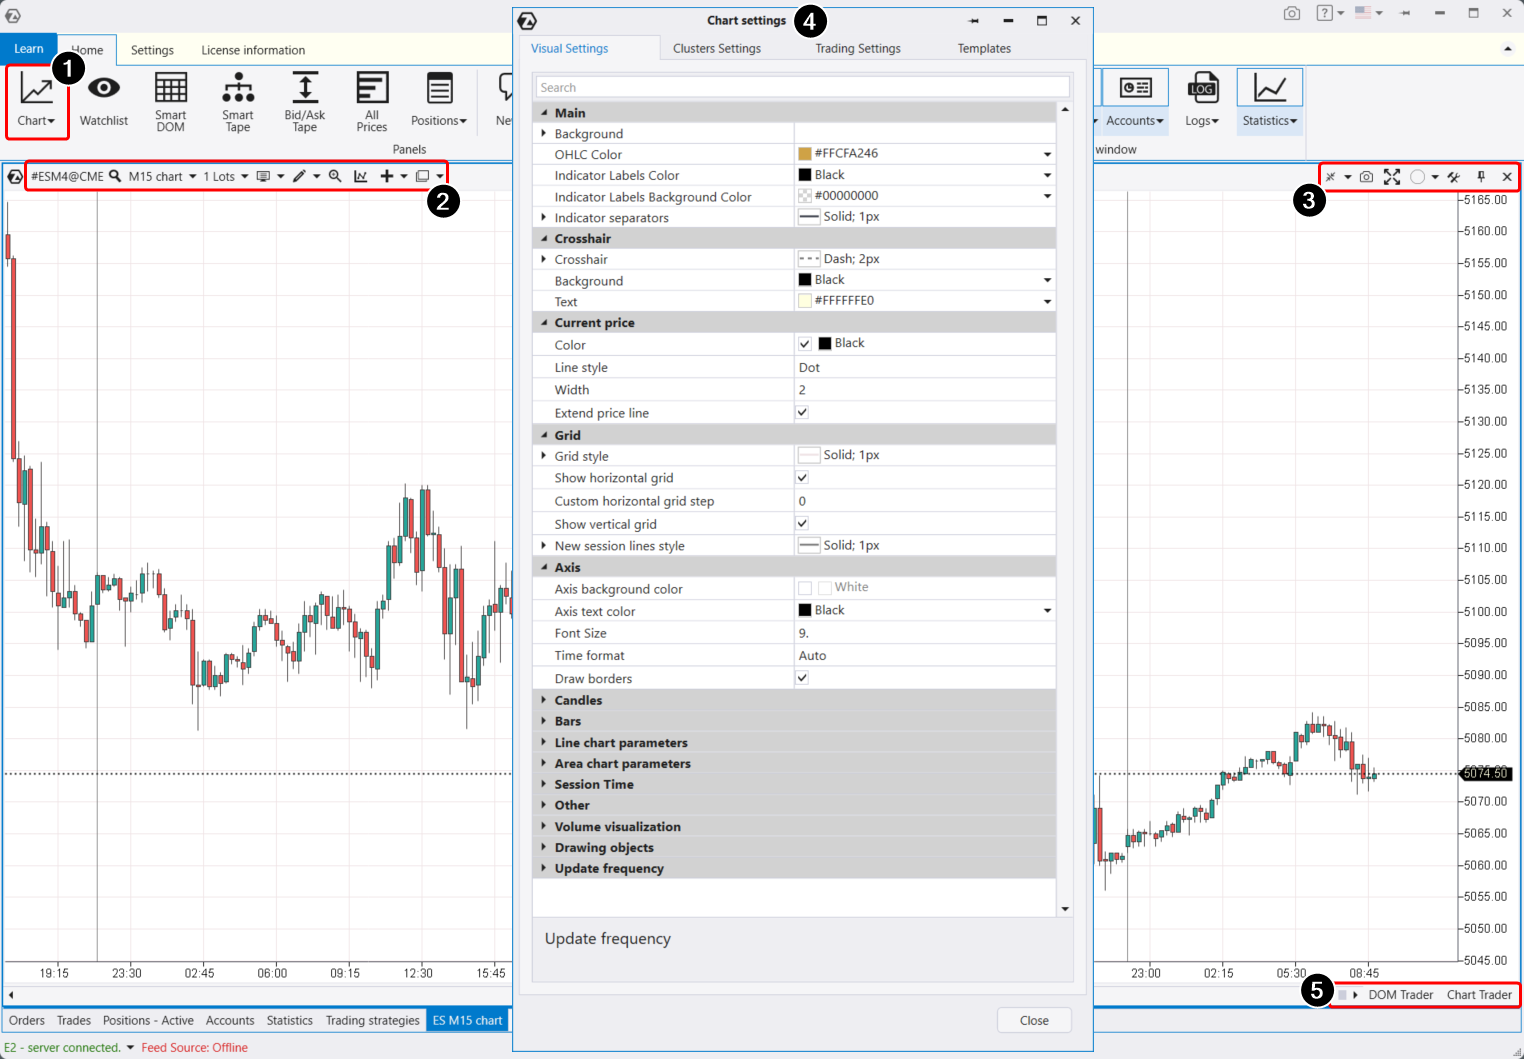
The horizontal axis represents time, while the vertical axis represents the price. Both scales can be adjusted by dragging with the mouse to achieve a comfortable display. When you stretch the time axis horizontally, at some point, clusters will appear instead of candlesticks, accompanied by an additional menu on the left to manage cluster modes.
To work with the chart, you have:
- upper left menu (2);
- upper right menu (3);
- settings manager (4);
- lower right menu (5).
Overview of Chart Module Settings and Menu
Settings in the upper left menu enable you to:
- Adjust the timeframe (including custom and unique ones).
- Set the chart type.
- Activate drawing objects (lines, profiles, labels).
- Add/adjust indicators (both classic and advanced, totaling over 100).
- Connect automatic chart strategies (here you can access developed trading strategies for algorithmic trading).
- Activate the magnifying glass.
- Use chart templates, which can be stored in a list or saved as separate files on your hard drive.
Using the upper right menu, you can:
- Adjust the vertical scale (level of detail).
- Take a screenshot of the chart. After pressing, a browser page will automatically open with a link to the screenshot.
- Assign a group to the chart.
- Expand the chart to full screen, close it, or pin it.
- Access the tool manager.
Using the lower right menu, you can:
- Launch the Chart Trader panel for trading.
- Launch the DOM Trader software for scalping.
In the settings manager, there are four tabs:
- Visual settings (change background, text, candles, lines).
- Cluster settings (cluster background color, text size in clusters, and many other parameters discussed in the third article).
- Trading parameters settings, where you can change marker colors for trades, positions, and other visualizations.
- Template settings.
Tip: For more convenient operation, use the context menu, which has essential functions. To access it, simply right-click anywhere on the chart.
Useful links:
CLUSTER CHARTS
To switch to cluster chart mode (footprint), you can use several methods:
- Stretch the horizontal time axis with the mouse (or scroll the mouse wheel).
- Select in the upper menu > Mode > Clusters.
- Press Shift+K.
This will open an additional menu on the left (shown as number 1 in the chart below), which allows you to quickly choose the optimal footprint display option:
1. By volume.
2. By the number of executed trades regardless of volume. For example, a trade might have a volume of 15 contracts, 5 contracts, or 1 contract, but it will still count as one trade.
3. Bid Ask mode shows buy and sell trades separately. ATAS has a special algorithm that splits incoming trades from the exchange into buys and sells and highlights them with the corresponding color. Aggressive sell trades are shown in red on the left, and aggressive buy trades are shown in green on the right. Aggressive trades are matched with passive limit orders. Thus, you can see how many limit buy orders were executed in red on the left, and limit sell orders in green on the right.
4. By delta. Delta shows the balance between aggressive buys and sells and highlights it with the appropriate color. If there were more aggressive buyers than market sellers at this price and in this candle, you will see a cell highlighted in the corresponding color and the number of contracts that match this balance.
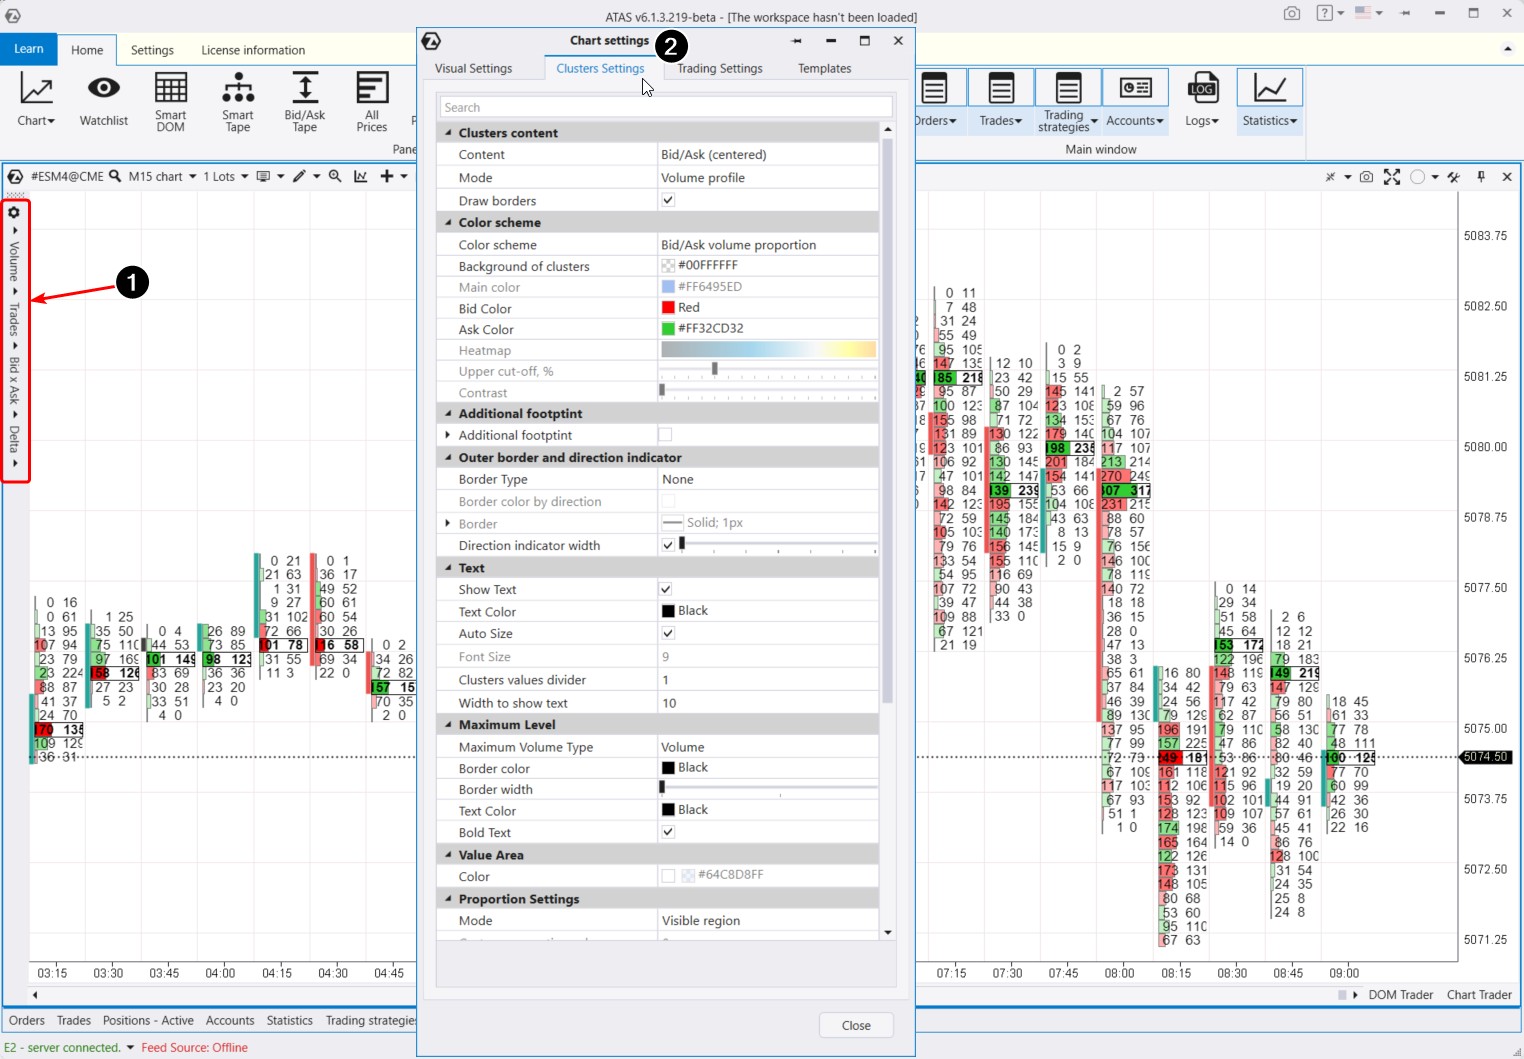
For detailed customization, use the settings manager (which can also be accessed through the context menu or with the keyboard shortcut Ctrl+S).
Key settings include:
- Content – select the information to display within the clusters;
- Mode – choose different ways to display this information;
- Color Scheme – select color schemes, including gradients;
- Level Settings (Point of Control, Value Area);
- Proportion settings.
Useful links:
Indicators
You can open the indicator manager in several ways:
- By pressing the keyboard shortcut Ctrl+I.
- From the top menu bar.
- By right-clicking to open the context menu and selecting “Indicators.”
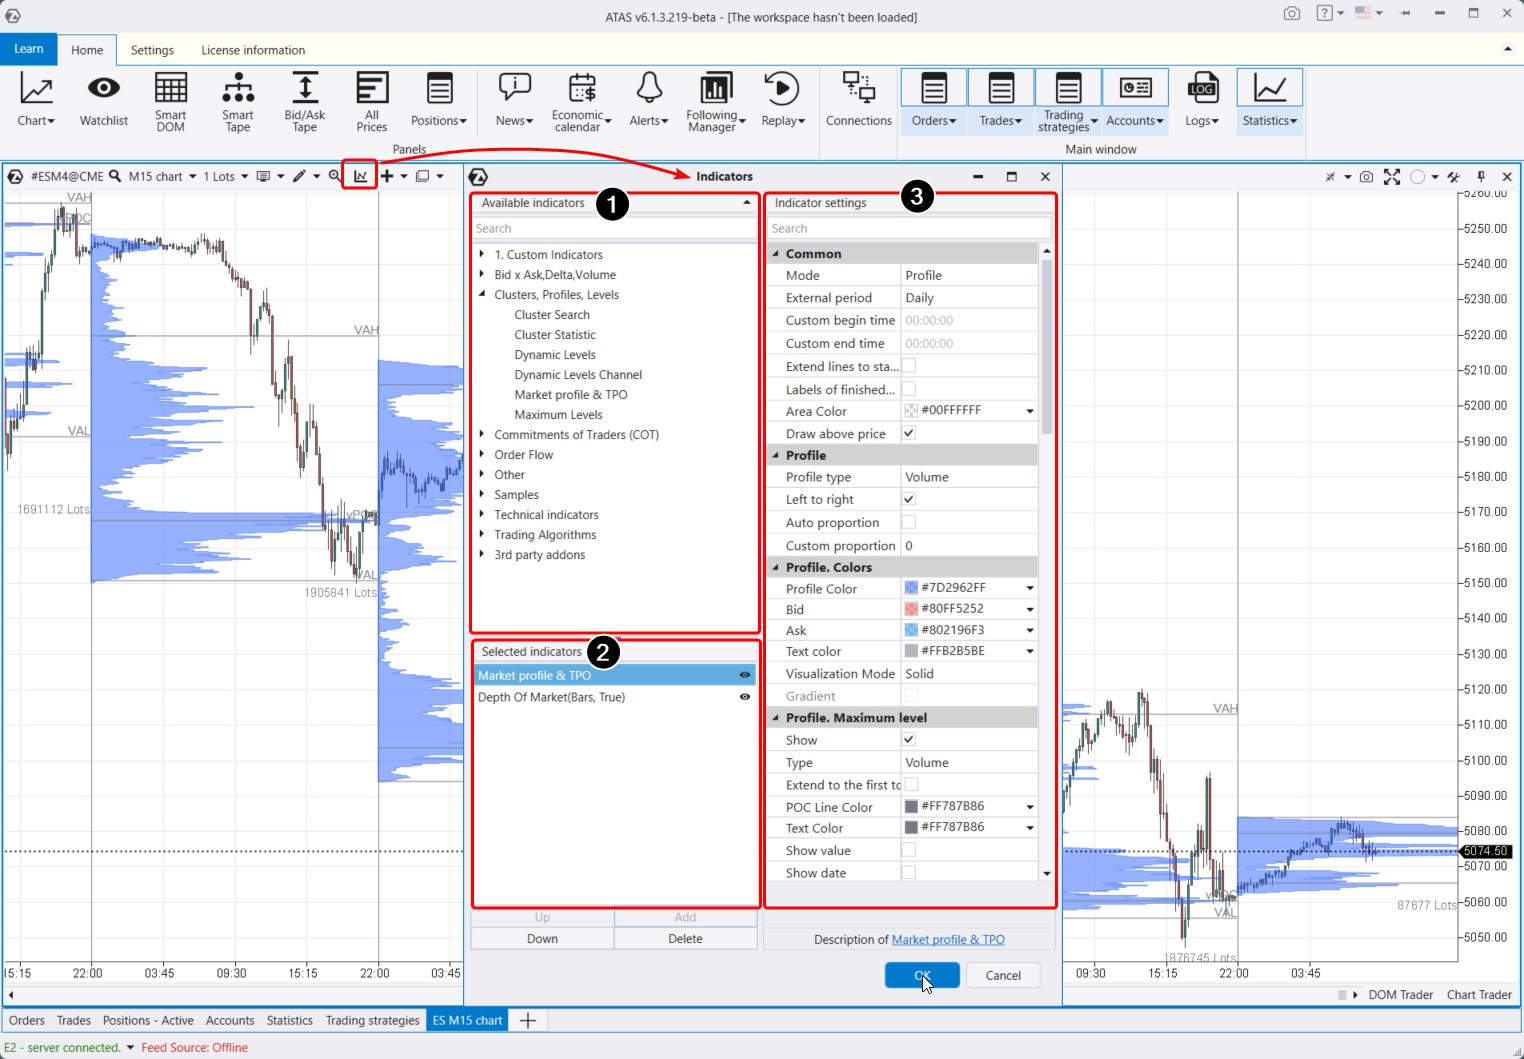
The indicator manager has three main areas (marked by numbers below):
- A list of available indicators (over 240 indicators, with new ones constantly being added). To add an indicator to the chart, select it from the available list (1) and click the “Add” button.
- A list of added indicators on the chart.
- Settings for the selected indicator (the picture shows the settings for the profile indicator). When you change the settings for an indicator already loaded on the chart, ATAS will immediately apply the changes.
When you select an indicator from the list on the left side of the manager, the current settings for that indicator will appear on the right. Under the settings, there are links to instructions for each indicator — click them to read the detailed description in the Knowledge Base.
All available indicators are divided into several groups, including:
- Bid, Ask, Delta, Volume. This group includes indicators for vertical volume, delta, cumulative delta (which shows the dynamic change in the balance of buyers and sellers).
- Clusters, Profiles, Levels. This group features the powerful Cluster Search indicator for working with clusters. It also includes volume profile and its derivative indicators for dynamic levels and maximum levels, as well as cluster statistics.
- Order Flow. This group includes the Big Trade indicator, which detects large trades in the tape and displays them directly on the chart, whether aggregated or individual. There is also the Dom Levels indicator, which shows order book levels directly on the chart. Market Power, Speed of Tape, Tape Patterns, and Order Flow Indicator are derived tools from the tape used to analyze the order flow. The Speed of Tape indicator is particularly noteworthy.
- Other. This group includes the Depth of Market, the External Chart, which displays candles for the selected period over the regular chart. Then you can find user-created custom indicators, RTIndicator, and HRanges. You can set session colors and differentiate sessions by colors.
- Technical Indicators. This group contains classic indicators such as RSI, MACD, and CCI, as well as the margin zones indicator. The Open Interest indicator (for Moscow Exchange futures) shows real-time trader entries and exits. These indicators can be combined with volume analysis indicators.
Indicators are discussed in detail in the separate article Getting Acquainted With ATAS. Indicators
Useful links:
Chart Trader Panel
Chart Trader is a trading panel that can be activated in two ways:
- by clicking the corresponding button in the bottom right menu;
- by pressing the Ctrl+T key combination.
The Chart Trader interface will open to the right of the chart:

The panel may vary depending on the instrument opened on the chart — for cryptocurrency markets, the Chart Trader panel includes additional functions (for example, selecting margin type).
Additionally, the panel features (as shown in the screenshot above):
- A block of control buttons. The function of each button is indicated by its label, specifying the trading operation it controls. You can assign hotkeys to these buttons for quicker access. Below the order control buttons, you will find the current status of open positions.
- A block of exit strategies to automatically set stop-loss and take-profit orders. For instance, you can configure trailing stops to automatically adjust based on a specified price increment, allowing profits to grow.
ATAS offers flexibility in tailoring the trading process to suit individual needs. Discover the method that best aligns with your preferences for both efficiency and security. For a more detailed exploration of Chart Trader’s trading capabilities, refer to the fifth article Getting Acquainted With ATAS. Trading Advantages.
Useful links:
STATISTICS MODULE
Let’s return to the interface of the main window of the ATAS platform to explore the important Statistics module. This module allows users to analyze their trading results in real time as well as over specific historical periods for a particular account or instrument.

Here, you can view the number of executed trades and performance metrics such as profit factor, average loss/profit, drawdowns, and other figures.
The module includes tabs where users can access:
- their trade journal,
- the Equity curve,
- order information and execution details.
Additionally, there is information about accounts and open positions. Logs record ATAS program actions. They are necessary to monitor program operations.
All these data are thoughtfully organized in one place to ensure traders can easily use them.
SETTINGS TAB
To conclude the article, let’s explore the remaining items in the main program menu.
On the Settings tab of the main menu, you can configure:
- Workspaces, which are created during platform use and saved upon shutdown.
- Layouts. You can add charts and platform modules to the layouts and switch between them for quick loading of selected windows. This is helpful for users with limited monitor space.
- Color theme. You can choose between light and dark themes.
- Additional settings.
You can adjust the time zone for displaying time on charts and other platform tools. Clicking on the Commissions button allows you to set commission values for all instruments or individually, ensuring accurate tracking of your trading results.
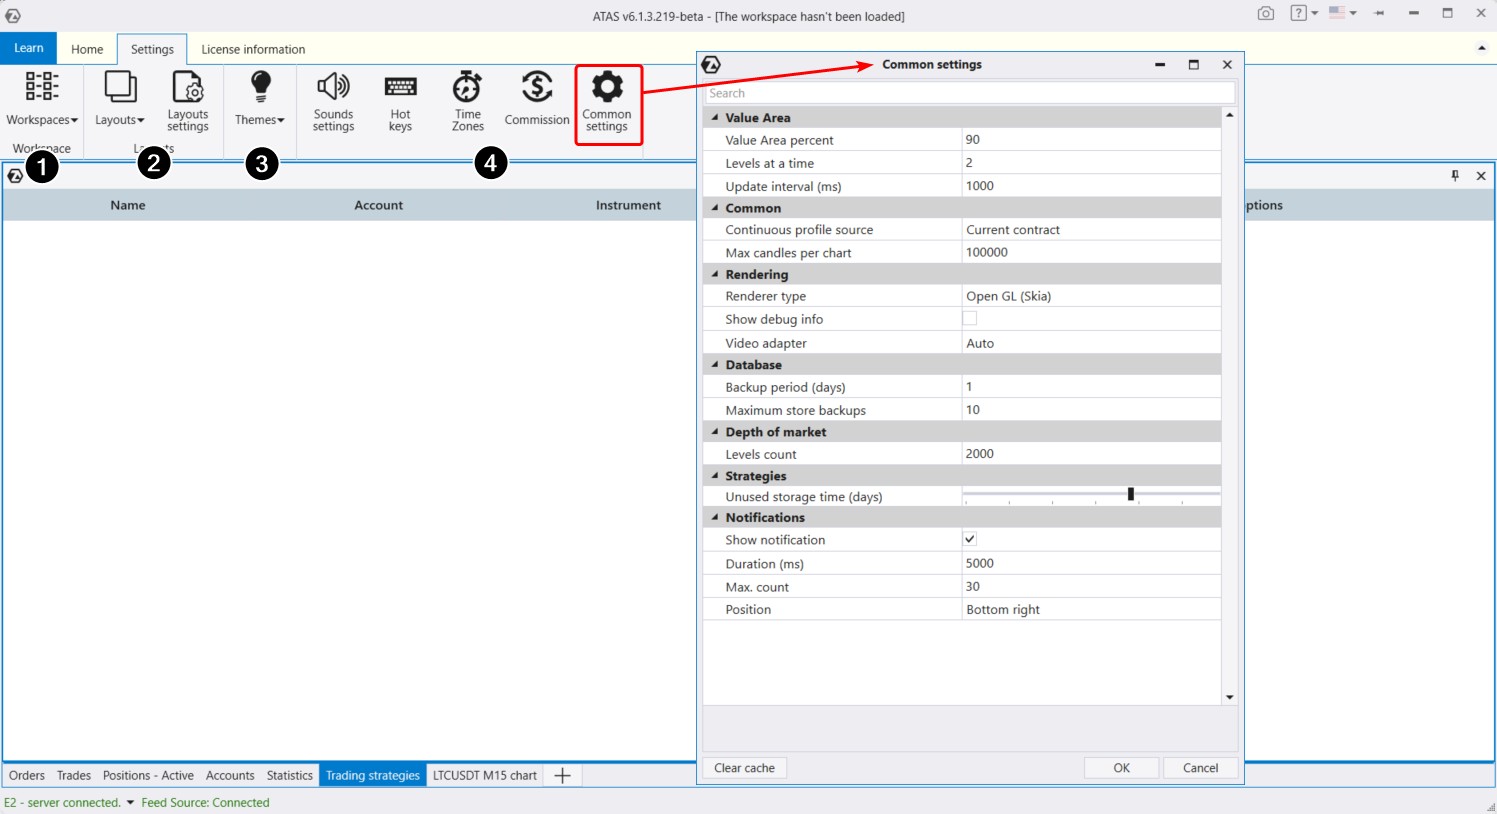
In the Common Settings, you can adjust the value area percentage and remove the limit on displayed levels in the order book by setting it to 0. You can also clear the cache accumulated within the platform from here.
CONCLUSIONS
You have taken your first steps toward mastering the ATAS platform.
It is perfectly normal if you feel overwhelmed by its complexity and depth upon reading our introductory article on ATAS. We have provided a brief overview of a rather complex software product.
Progress step by step, using the “Getting Acquainted With ATAS” series articles as your guide. If you have less than a year of experience in financial markets, you will learn a lot from these materials. In upcoming articles, we will provide detailed descriptions and instructions to answer all your questions and help you build a comprehensive understanding.
What is next? Download the ATAS platform demo version and start practicing with its capabilities. Keep exploring the introductory materials by moving on to the second article Getting Acquainted With ATAS. Working With Charts.
Information in this article cannot be perceived as a call for investing or buying/selling of any asset on the exchange. All situations, discussed in the article, are provided with the purpose of getting acquainted with the functionality and advantages of the ATAS platform.