
There is a major review article on false breakouts in our blog. The article considers the reasons why false breakouts happen and the processes that occur during their formation.
The information presented below offers a practical idea for trading false breakouts. Do not treat the idea as a guaranteed way to earn money – there are no holy grails on the stock exchange. This article represents thoughts on how to make money through trading false breakouts.
Read in the article:
What false breakouts are
To put it simply, a false breakout is a pattern when:
- the price moves within the range (a bulge forms on the market profile at this time);
- after that, the price breaks a trading range, but its movement gets exhausted, and there are no trend followers;
- the price returns to the range (and often breaks the range in the opposite direction).
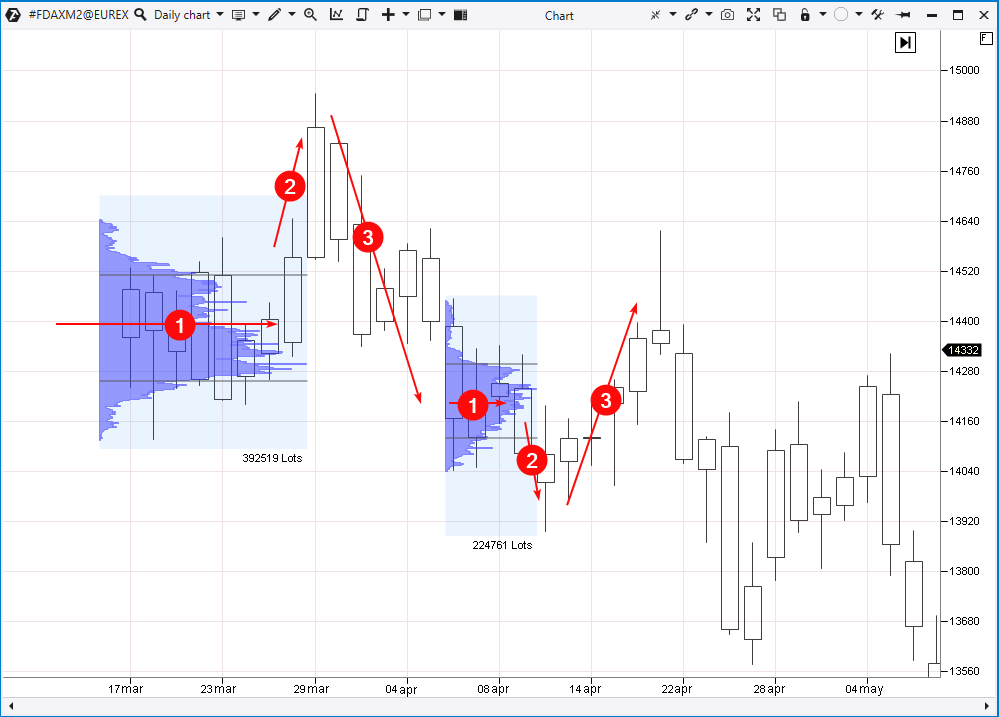
You can see examples of two false breakouts on the DAX futures chart below (these are not perfect examples of false breakouts, but the gold standard can hardly be set).
False breakouts are dangerous because:
- some people lose money when they open positions in the direction of a breakout and consider that the trend will continue;
- others lose money because their stops (which are set out of the range) get knocked out.
You can find more about the causes of false breakouts and their specific features in the article mentioned above. We will get down to business and consider the strategy.
Idea of the strategy
If the price moves below the range but then returns to it, this is a sign of sellers’ uncertainty and a lack of selling pressure to establish a downtrend. If the seller is weak, there is a reason to look for entries into long positions.
The opposite is true for a false bullish breakout which indicates buyers’ weakness. Therefore, there are arguments for opening a short position.
Let’s have a closer look at the same chart (the first candle is on March 17, 2022).
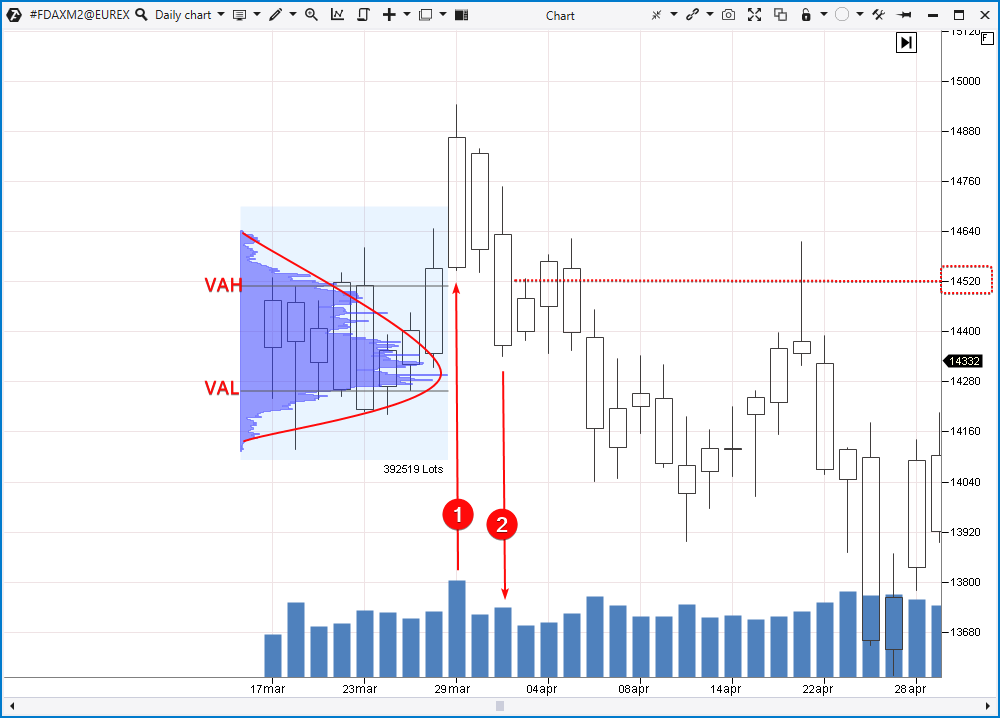
On the left side of the chart, you can see a trading range that formed while there was a relative balance of supply and demand in the market. A bulge formed on the profile, the Value Area High and Value Area Low levels show the limits of the value area (to read about the basics of the market profile indicator, read these articles: one, two, three).
As long as there is a balance between supply and demand in the market, it is recommended to sell around the upper limit of the balance (for example, from the VAH level) and buy around the lower limit (for example, from the VAL level). The intention is clear – buy low, sell high. The strategy will lead to profit until the balance is upset.
In our case, the balance was upset when a bullish breakout occurred on the 29th (1). Under the influence of some bullish factors, buyers got an advantage in the market, and the price went up on increasing volumes. It seemed that the picture was bullish.
However, the next day, almost all growth progress was wiped out and a day later the price dropped inside the initial range. A false bullish breakout was formed.
The following conclusions can be made:
- there were not enough buyers in the market to support the bullish momentum;
- perhaps the impact of the news was overestimated, and purchases were made in the heat of the moment. Traders probably thought “faster, until it flew even higher”;
- the large volume on the 29th (1) represents buyers who tried “not to miss the boat”. This volume also shows short positions closed by stop-losses that were set above the range limits;
- a professional trader, who knows and sees more than anyone else, could use this spike of trading activity on a bullish breakout attempt to accumulate a short position. It is believed that a professional trader sells on a breakout and buys short positions from those who are forced to close them.
If the volume on the 29th is real bullish activity of major traders, why did the price drop? This means that a major trader is likely to have a bearish view of the market.
So, when the price dropped to the original range after an attempt of a bullish breakout on high volume, one might get an idea to open a short position from the VAH level – approximately from the 14520 level.
The idea has greater profit potential because a failed bullish breakout can be followed by a real bearish one. Even a bearish trend can set in.
Let’s look at a few examples to elaborate the strategy.
Example 1
This is a daily bitcoin chart.
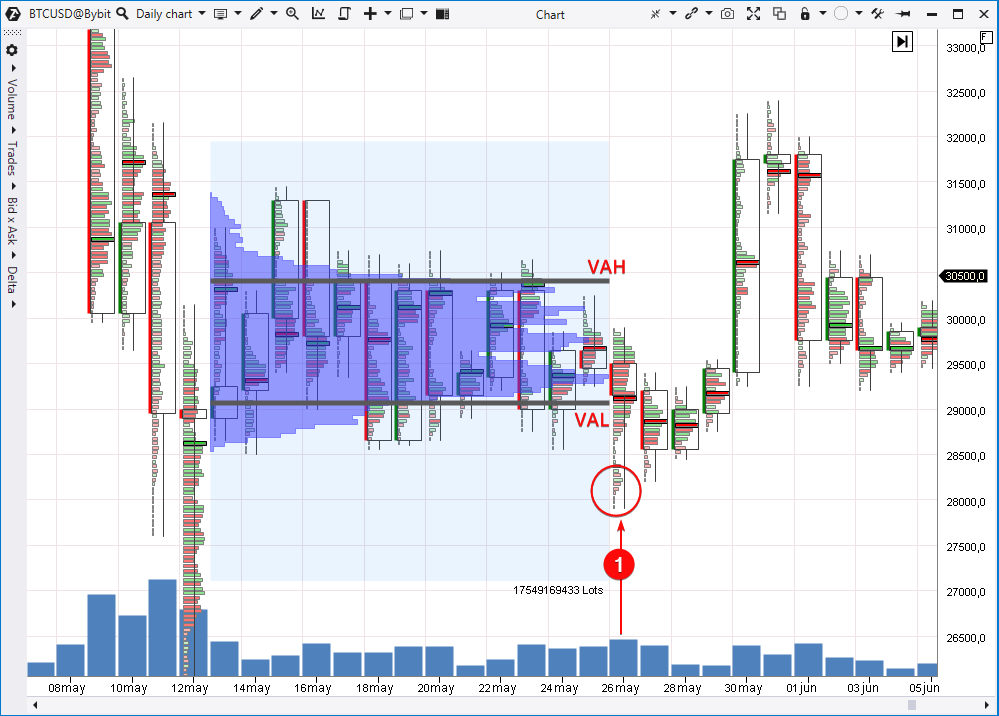
During May, a range with VAL around 29000 and VAH around 30500 formed in the market.
After that, a false bearish breakdown happened (1). The circle marks the activity which can be interpreted as panic selling and the closing of long positions by stop-losses. The price returned to the range on the same day, thus showing that the bearish sentiment was exaggerated. So there were reasons to believe that the bulls could show their strength.
The next day, the price fell below VAL providing a buying opportunity, for example, at 28500. A stop-loss can be set below the activity indicated by the circle, for example, at 28000. And the final goal is the 31000 level at least.
It is important to ensure that the goal-to-risk ratio is at least 2:1.
Example 2
A daily chart for euro futures.
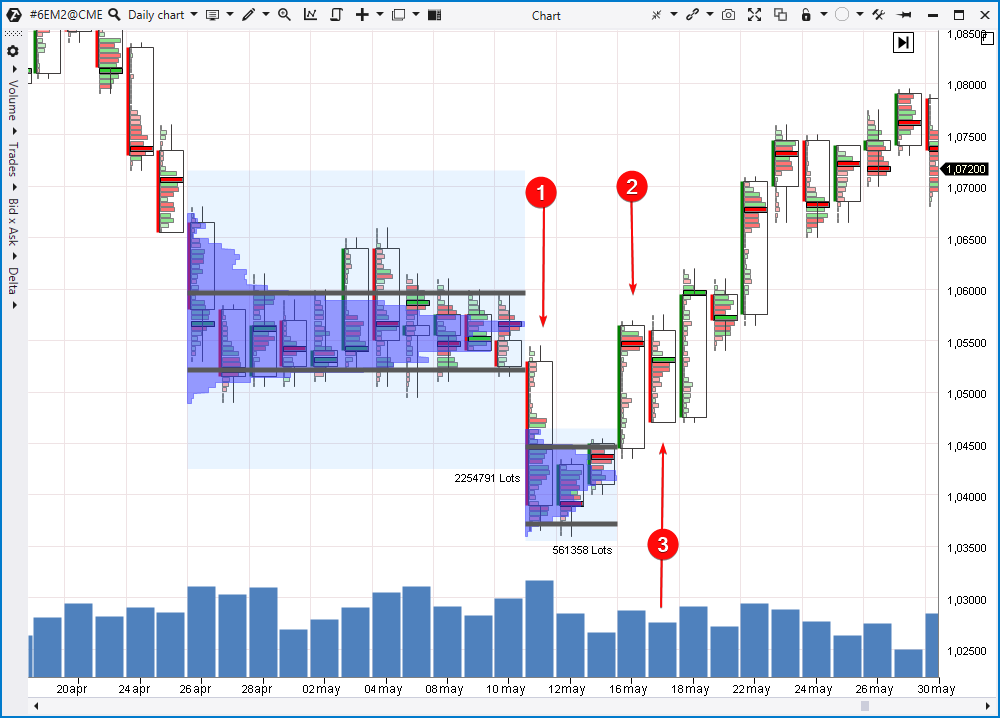
A range formed in the market in late April – early May 2022. Contracts traded mostly between 1,052 and 1,06 ( by the way, the upward movement on May 3 can be considered a false bullish breakout).
Numbers indicate:
- A bearish breakout. The price traded mostly below 1,045 in the next two days, luring traders into opening short positions on the euro amid news about the war in Ukraine, inflation, fuel shortages and others.
- The price returns to the original range. Those who shorted below 1,045 were trapped.
- A day of sales, but look at clusters inside the candle. Red clusters are getting exhausted at the bottom of the candle, which means the seller’s weakness. This is the day when it makes sense to open a long position according to the strategy in question.
The next day (on the 18th) buyers appear (noticeable by green clusters). If you have opened the position, it pays off.
It should be noted that the false bearish breakout was very large in comparison with the initial range, and the ratio of risk to potential profit may be unsatisfactory due to this reason.
In any case, the position volume should be calculated in such a way that even if stop-losses get triggered, the capital will not decrease more than 2-3%.
Example 3
30-minute gold futures chart.
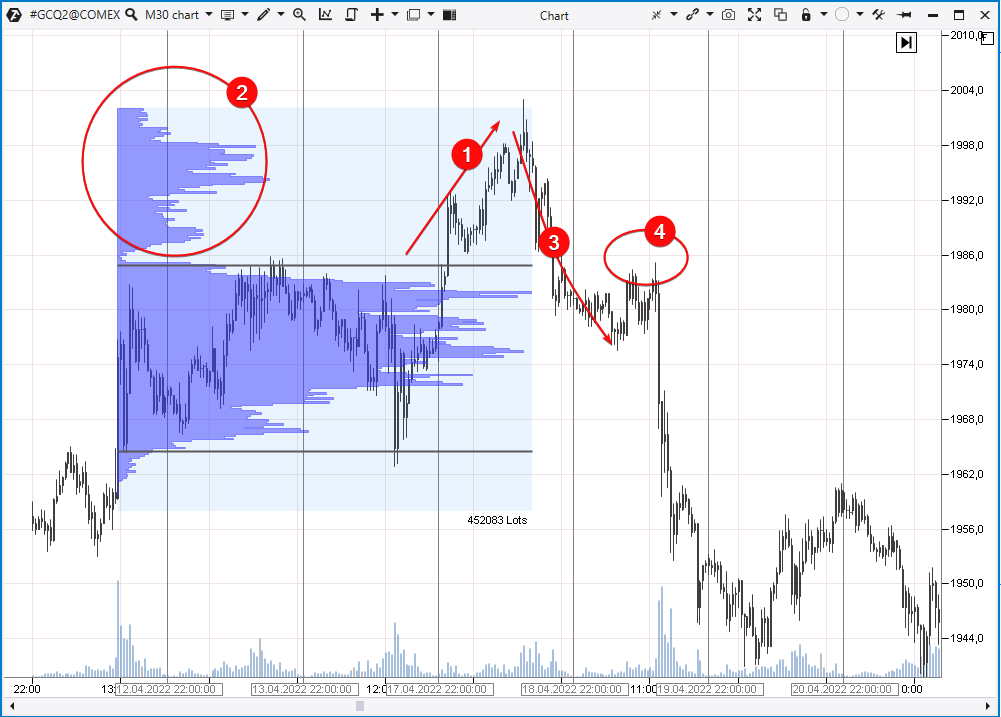
A range formed in the market in mid-April 2022, trades were executed mainly between the 1965 and 1985 levels.
Numbers indicate:
- An attempt at a bullish breakout of the range.
- Activity that can be described as follows: some traders affected by FOMO (fear of missing out on profits) enter long positions, while others are forced to exit short positions. Al professional uses this activity to create a large short position.
- The price returns to the range. The bullish breakout turns out to be a false one, so traders get an idea that a bearish breakout will be successful.
- An area to open short positions according to the described strategy.
How to start trading
We hope that information presented in the article was useful for you. It is worth noting that false breakouts appear quite often in any market. They make traders’ work more complicated. After all, if every breakout was a real one, it would be too easy to make money.
The strategy described above is mostly aimed at entering a position on the first rollback after the very first impulse of a beginning trend.
Profiles show balances and imbalances. When you notice a false breakout, analyze the idea of opening a position in the opposite direction of the false breakout.
Use the ATAS tools to find an entry point more accurately, thereby reducing the risk. For example, if you use the speed of tape indicator, you can see a reversal on a fast time frame and enter a position so that the stop-loss is short and does not go beyond the false breakout extremum.
Conclusions
False breakout trading allows you to make money where others lose it.
Use the market profile to identify trading ranges, false breakouts and entry points according to the described strategy. To minimize the risk, look for more accurate entry points on lower time frames with the help of useful ATAS indicators.
You can download ATAS for free right now and try a powerful tool for cluster chart analysis in stock, futures and crypto markets. It is easy to practice new trading strategies on the platform.
Four good reasons to download ATAS:
- It is free and you can continue using the program even after the 14-day trial period.
- You will be able to analyze divergences in the stock, futures and crypto markets.
- A demo account built into the platform allows you to practice trading without risking your real capital.
- The platform offers many benefits for traders who want to trade with easy-to-use cluster charts.
Read our blog and subscribe to our YouTube channel to improve your trading skills.
Information in this article cannot be perceived as a call for investing or buying/selling of any asset on the exchange. All situations, discussed in the article, are provided with the purpose of getting acquainted with the functionality and advantages of the ATAS platform.
Did you like it? Tell your friends:


