In this article, you will find two useful cheat sheets—one for candlestick patterns and another for chart patterns. We have included clear explanations with examples to help you understand these formations and use them in your trading. These cheat sheets are helpful for trading stocks, futures, and other financial assets, especially on daily time frames.
Read more:
Candlestick Pattern Cheat Sheet
Candlestick patterns are based on traditional Japanese candlestick analysis. They typically consist of one to three candles and are widely used by traders for both trend-following strategies and spotting potential reversals.
While these patterns are traditionally applied to daily charts, using them for intraday trading comes with its own challenges due to the varying levels of trader activity across different market sessions—the Asian, European, and U.S. sessions.
How to Read Candlestick Patterns
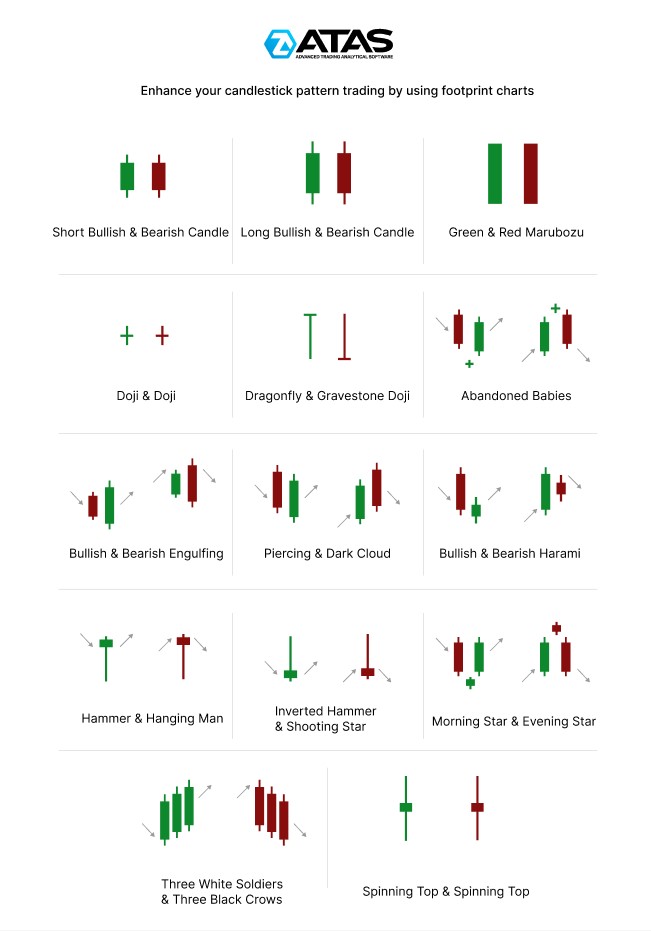
Short Bullish & Bearish Candle
Short bullish and bearish candles indicate a small price movement from open to close, showing only slight dominance by buyers or sellers.
Long Bullish & Bearish Candle
Long bullish or bearish candles indicate a stronger dominance of buyers or sellers.
Tip: To confirm signals, traders can use the Delta indicator and the Bid & Ask indicator, which help differentiate between market buys and sells.
Green & Red Marubozu
- A green Marubozu means the opening price was at the low, and the closing price was at the high, with no shadows on the candle, signaling strong bullish momentum.
- A red Marubozu is the opposite. These candles suggest a dominant market trend, and trading against it can be highly risky.
Doji
A doji forms when the opening and closing prices are nearly the same, signaling a balance between buyers and sellers. This can suggest trader indecision (low trading volume) or that opposing forces are evenly matched (moderate to high trading volume).
When a doji appears, it is important to consider the broader market context, which can provide clues about why it formed. Learn more in our article: How to Trade the Doji Candle.
Dragonfly Doji & Gravestone Doji
These are variations of the doji pattern:
- Dragonfly doji has a long lower wick and a small body, showing that the price dropped but then moved back up. This could indicate a potential price reversal from an important support level.
- Gravestone doji when the price moves up but then falls back down, leaving a long upper wick and a small body at the bottom.
Tip: To better understand the market dynamics behind candles with long wicks, read our article on Upthrusts and Shakeouts—it will give you deeper insights into price action!
Abandoned Baby
The abandoned baby pattern is rare but considered a strong reversal signal. It consists of three candles, with a doji candle sandwiched between two candles moving in opposite directions. Gaps between the candles make the pattern even more significant.
Bullish & Bearish Engulfing
A popular reversal pattern:
- The bullish engulfing pattern forms when a large green candle fully covers the previous red candle, indicating a shift in momentum toward the bulls.
- The bearish engulfing pattern is similar but with the colors reversed.
Piercing & Dark Cloud
- The piercing pattern is a bullish reversal pattern that suggests the end of a downtrend.
- The dark cloud is its bearish counterpart, where the second candle closes below the midpoint of the first bullish candle.
You can read more about these patterns in our article: How to Trade the Piercing Pattern.
Bullish & Bearish Harami
- The bullish harami is a reversal pattern that occurs when a small candle is completely contained within the range of the previous large red candle.
- The bearish harami is the opposite, where a small red candle is inside a larger green one.
You can learn more in our article: How to Trade the Harami Pattern.
Hammer & Hanging Man
- The hammer pattern has a small body and a long lower wick, indicating a potential upward reversal after a downtrend.
- The hanging man pattern, however, signals a possible downward reversal.
For more details, read our articles: What is a Hammer Candle? and How to Trade the Hanging Man Pattern.
Inverted Hammer & Shooting Star
- The inverted hammer has a long upper wick and a small body at the bottom, signaling a potential reversal after a downtrend.
- The shooting star forms after a price rise and warns of a possible downward reversal.
You can read more in our article: How to Trade the Shooting Star Pattern.
Morning Star & Evening Star
- The morning star is a bullish reversal pattern made up of three candles, with a doji in the middle, suggesting a potential trend reversal.
- The evening star is the opposite pattern, signaling a potential downward trend reversal.
Three White Soldiers & Three Black Crows
- The three white soldiers is a bullish pattern made up of three long white candles. It typically appears after a long downtrend and signals strong bullish momentum.
- The three black crows is a bearish pattern made up of three long black candles.
Spinning Top
The spinning top pattern features a small body and long wicks, signaling uncertainty or a balance of power between buyers and sellers. For more details, read our article: How to Trade the Spinning Top Pattern.
Helpful Resources for Working with Candlestick Patterns
Candlestick patterns are still a popular tool among beginner traders, despite their traditional nature. To use them more effectively, we recommend:
- Thomas Bulkowski’s “Encyclopedia of Candlestick Patterns”. This book not only describes what the patterns look like and their meanings but also provides statistics on which patterns work best and the probability of making a profit when trading them.
- Article: How to Improve the Accuracy of Candlestick Patterns
- Article: Searching For Candlestick Patterns and Clusters
Now, let’s move from candlestick patterns to chart patterns.
Chart Pattern Cheat Sheet
Chart patterns are formations that appear on price charts as a result of price fluctuations. Traders typically use lines to mark these patterns, turning market dynamics into various technical analysis figures, such as triangles, channels, and more.
Traders use chart patterns to spot trading opportunities, for example, when the price breaks through a pattern’s boundary, signaling a trade in the direction of the trend.
How to Read Chart Patterns
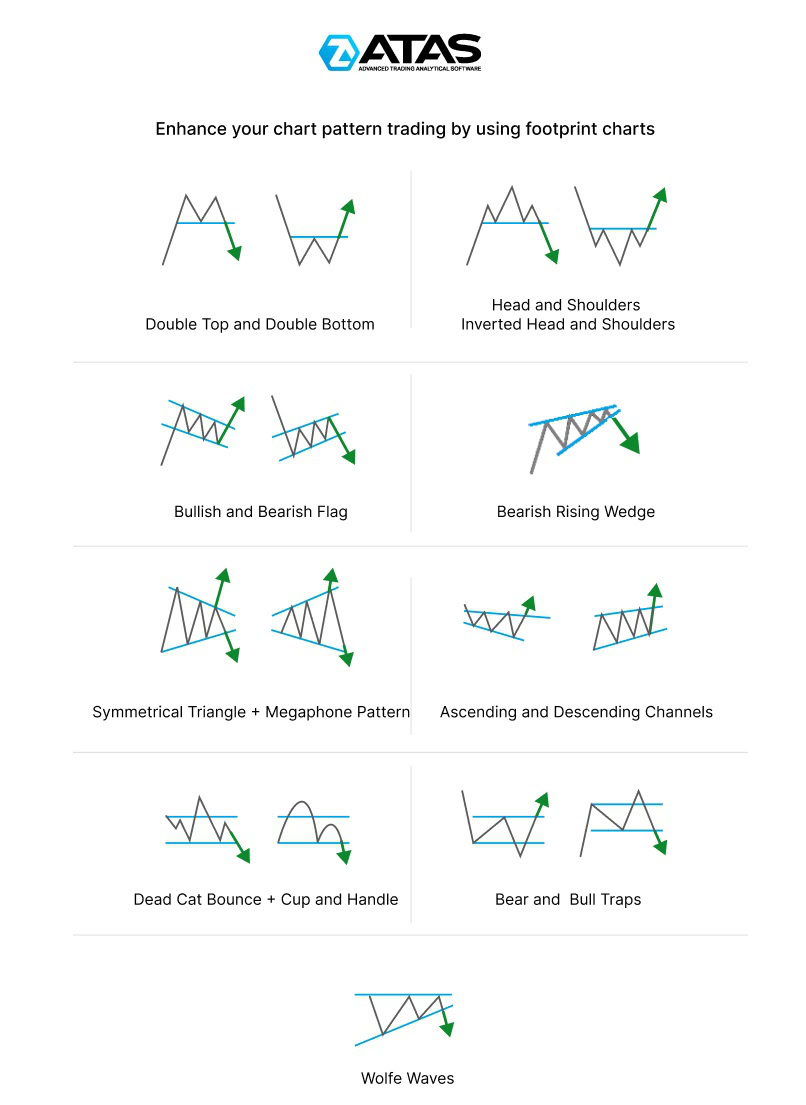
Double Bottom & Double Top
These patterns signal potential trend reversals.
- A double bottom forms after a downtrend, creating two consecutive lows at roughly the same level. This suggests the price may be preparing for an upward reversal.
- A double top, on the other hand, indicates a possible shift to a downtrend.
To learn how footprint charts can help analyze these reversal patterns in more detail, read our article: Double Bottom & Double Top in Trading.
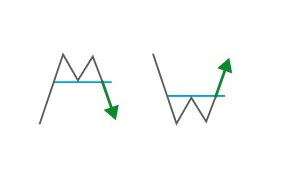
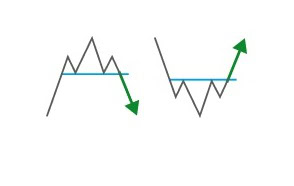
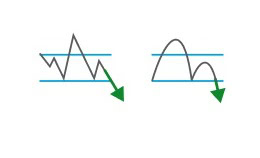
Head and Shoulders & Inverse Head and Shoulders
The head and shoulders pattern is widely considered one of the most reliable chart patterns.
- This classic formation consists of three peaks, with the middle one (the “head”) being higher than the two side peaks (the “shoulders”). A break below the “neckline” is typically seen as a signal to enter a short trade.
- The inverse head and shoulders pattern works similarly but signals a trend reversal from bearish to bullish.
For more insights on trading these patterns, read our article: Head and Shoulders in Trading: How to Trade It.
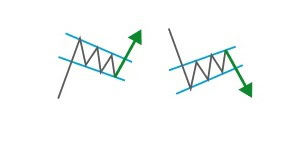
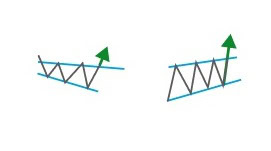
Bullish & Bearish Flag
Flag patterns represent price ranges that indicate temporary counter-trends within a larger trend.
- A bullish flag appears during an uptrend, indicating that after a brief consolidation, the trend is likely to continue, and the rally may resume.
- A bearish flag forms during a downtrend and suggests that the trend may continue after a temporary consolidation, which could be influenced by a key support level.
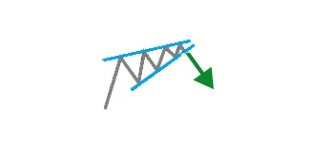
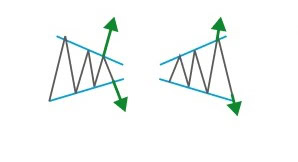
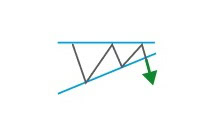
Bearish Rising Wedge и Bullish Falling Wedge
- A rising wedge forms when price movements narrow between two upward-sloping trendlines. This pattern often signals a bearish reversal.
- A falling wedge occurs when price movements narrow between two downward-sloping trendlines, potentially indicating a bullish reversal.
Genuine breakouts of these patterns often happen during a fast-moving impulse, catching traders off guard: long traders lose profit or get stopped out, while short traders do not have enough time or confirmation to open new positions.
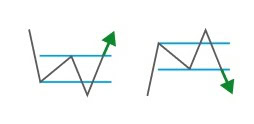
Symmetrical Triangle and Megaphone Pattern
These patterns differ in how the amplitude of price fluctuations changes:
- A symmetrical triangle forms when the price fluctuations gradually decrease. On the chart, it appears as a narrowing triangle, and its breakout can signal the start of a new trend.
- The megaphone pattern (or expanding triangle) is the opposite, with increasing price fluctuations that lead to a figure with expanding boundaries. This clearly signals growing market volatility.
Find out more in the article: How to Trade the Megaphone Pattern.
Ascending and Descending Channels
Parallel lines are a key concept in Euclidean geometry, and in technical analysis, drawing parallel channels serves the same fundamental purpose. This is one of the most effective tools for traders. By using two parallel lines, traders can:
- identify the trend direction;
- assess the strength of the trend;
- evaluate volatility;
- spot trading opportunities.
Learn more in the articles:
Dead Cat Bounce and Cup and Handle
Despite the differences in names, these patterns can be seen as mirror images of each other:
- A dead cat bounce in trading occurs when the price briefly rises from a support level during a developing downtrend but then resumes its decline.
- A cup and handle pattern in trading consists of two U-shaped trajectories (the second one is smaller than the first), formed below a resistance level, indicating a possible breakout upwards.
Bull and Bear Traps
These occur when a false breakout of a key level lures traders into opening positions, only for the price to quickly reverse, trapping them in either a bull or bear trap.
Wolfe Waves
Although the name includes “waves,” this pattern is not part of wave analysis.
Wolfe Waves is a market analysis technique that focuses on identifying specific geometric formations on the price chart. Traders look for patterns made up of five waves, which reflect the natural flow of price changes and can predict future market balance points. This method helps traders identify potential entry and exit points, and accurately forecast trend reversals with high probability.
To gain a deeper understanding and learn how to effectively apply Wolfe Waves in trading, check out these articles:
General Principles of Pattern-Based Trading
When trading candlestick and chart patterns, it is crucial to follow risk and capital management rules.
Setting stop-loss orders. These are protective orders designed to shield traders from significant losses. They can be placed:
- Below the previous low or above the previous high;
- Beyond a key support or resistance level;
- Outside the range of a candlestick or chart pattern;
- Based on volatility indicators (e.g., the ATR indicator);
- Using other methods and exit strategies.
Setting take-profit orders. They help set profit targets and balance potential gains with risk. Traders determine take-profit levels using:
- The previous local high or low;
- A key support or resistance level;
- A mathematical approach, ensuring the potential profit exceeds the risk by a set ratio;
- A trailing stop (a stop-loss order that moves with the market price);
- Other techniques.
Confirmation search. When a trader spots an opportunity that seems promising, they can reduce risks and find a more accurate entry point by using the following:
- Lower time frames. Focusing on smaller details can boost confidence when entering a trade, and help set a tighter (but justified) stop-loss, improving risk management and entry accuracy;
Professional volume analysis indicators and/or footprint charts. These tools offer a more advanced level of analysis compared to traditional chart and candlestick patterns, enabling traders to better assess market conditions and enhance their trading strategy.
A serious approach to trading. While trading cryptocurrencies and other assets might seem like an easy way to make quick profits, the reality is quite different. To consistently succeed in pattern-based trading, it is important to:
- Work on your psychology. Avoid making emotional decisions, manage expectations, handle profits and losses appropriately, and build resilience to stress.
- Follow a strategy. This involves developing a trading plan, adapting it to changing market conditions, and analyzing trade statistics.
- Continuous improvement. Learn new trading tools and practice regularly using trading simulators.
How to Improve Your Pattern Trading Skills
For beginners, it is important to stay skeptical about the effectiveness of pattern-based trading. In reality, profits can sometimes be smaller than losses due to factors like fees, slippage, human error, and other market nuances.
To increase your chances of success in trading, use the ATAS Market Replay simulator. This tool of the ATAS platform recreates trading conditions using historical data.
You can effectively develop your trading skills in a risk-free environment that closely mirrors real market conditions. Use footprint charts and other useful ATAS tools for trading candlestick and chart patterns, as described in the checklists, and also develop your own strategies. This will help you enhance your skills and get ready for live trading.
When practicing trading patterns in the Market Replay simulator, you can:
- adjust the playback speed and pause;
- analyze footprint charts;
- use over 200 indicators;
- use Chart Trader and other features to trade on the built-in Replay demo account and then analyze your performance;
- apply exit strategies.
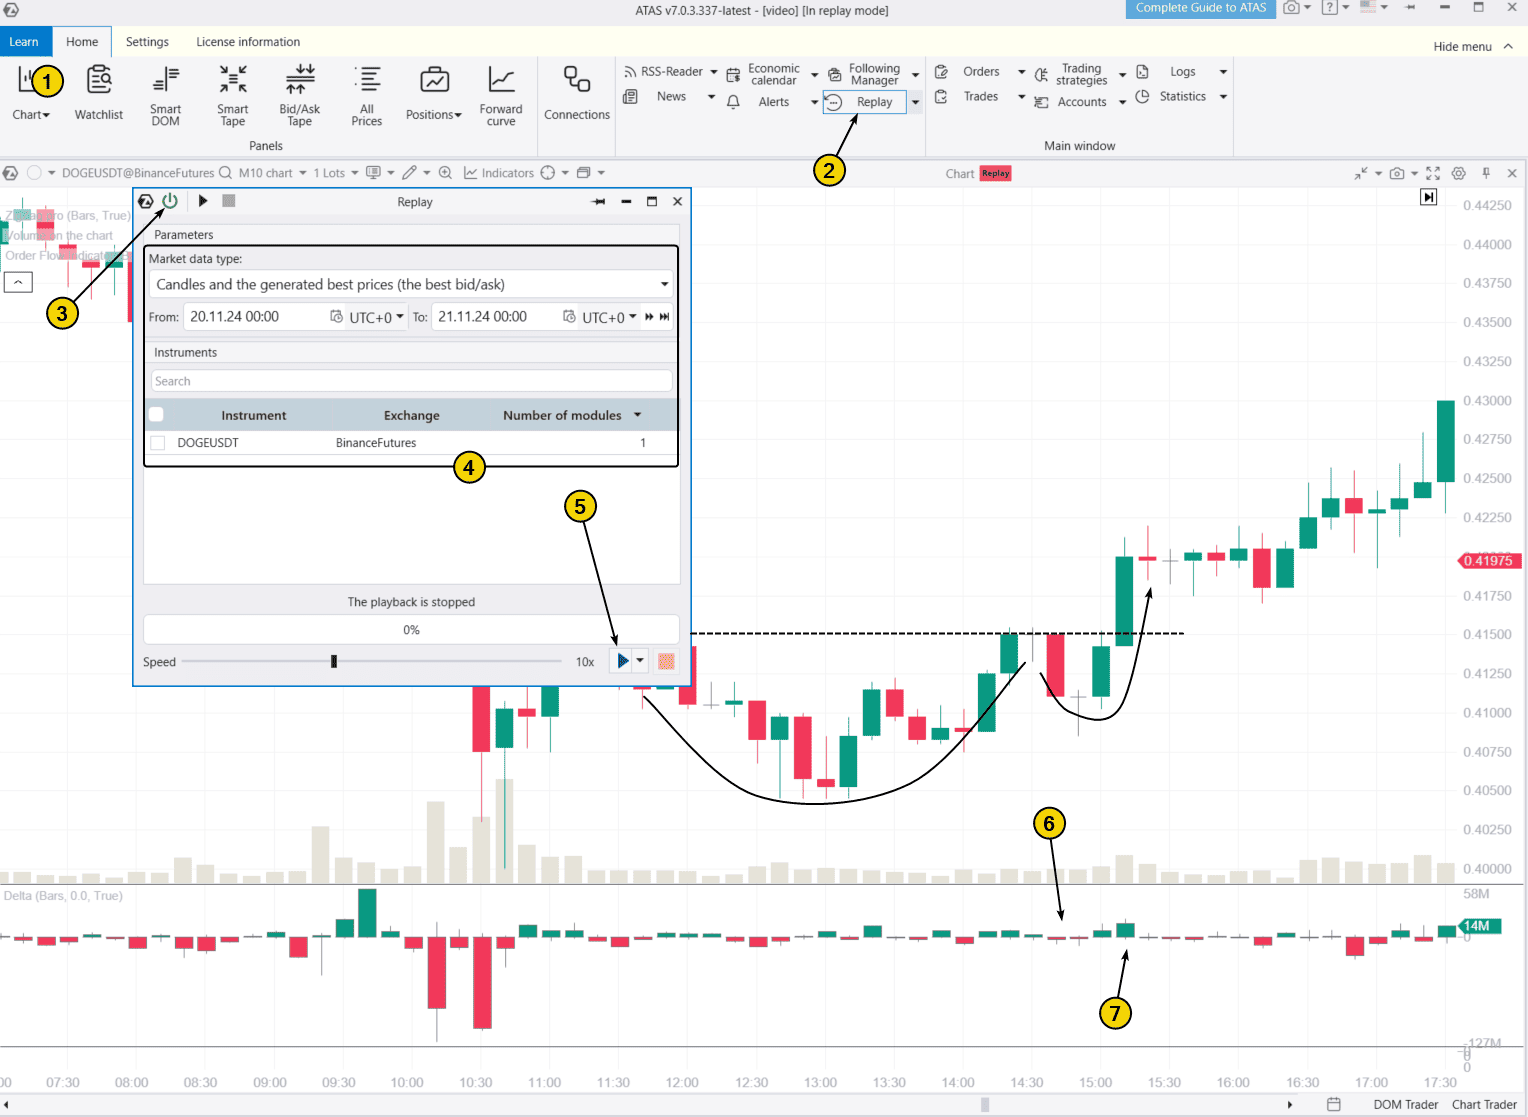
To try the simulator, download the ATAS platform for free, install, and launch it, and then:
- Open a chart of a financial instrument.
- Click on the Market Replay button in the main ATAS menu.
- Activate the Replay mode (the icon should turn green).
- Adjust settings (date and data type).
- Start the playback and watch for the familiar candlestick pattern to appear on the chart. Look for confirmations on the footprint or using indicators.
ATAS enables you to load tick data from cryptocurrency, stock, and futures markets, giving you a solid foundation to spot patterns in the price and volume interaction, and helping you refine your trading strategy based on pattern cheat sheets.
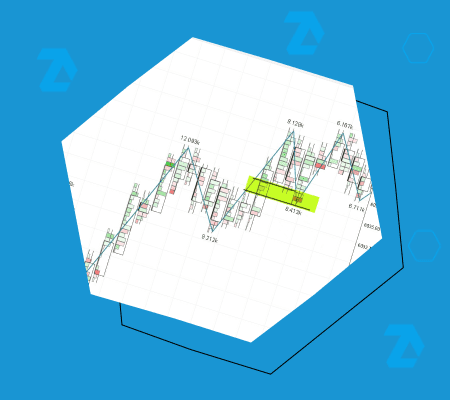
Example. On the chart, the bullish “Cup and Handle” pattern is marked with black lines. It formed after a period of panic selling during the day. The pattern is confirmed by volume analysis using the Delta indicator: during the formation of the “handle,” selling pressure was low (6), while the breakout was accompanied by active market buying (7) – a bullish signal.
FAQ and Tips for Trading Patterns
What types of patterns exist?
By trend direction:
- Continuation patterns – suggest the current trend is likely to persist.
- Reversal patterns – indicate a potential shift in market direction. Learn more in the article 5 Reversal Patterns.
By expected price movement:
- Bullish patterns – signal a potential price increase.
- Bearish patterns – suggest a possible decline.
How to use cheat sheets?
Cheat sheets are not a guarantee of profit but a valuable learning tool for traders. Beginners should understand that trading is more than just following patterns. For example, a stock price does not rise simply because a “Cup and Handle” pattern appears on the chart—it happens because buyer activity (reflected in market-buy orders) exceeds seller supply (limit-sell orders).
Therefore, incorporating volume analysis and other trading tools can be key to gaining an edge in the market.
Conclusion
Cheat sheets are a handy tool for beginner traders, making it easier to learn and apply popular technical analysis patterns, including both candlestick and chart formations. They serve as a great starting point and help structure market analysis. However, trading success comes with deeper practice and a solid understanding of market dynamics.
Advantages Of Using The Chart Patterns Cheat Sheet
✔ Convenience. Cheat sheets offer quick access to key information all in one place, saving time and making it easier to find relevant data while trading.
✔ Customization. Traders can personalize cheat sheets by adding notes or adjustments to better suit their trading style.
✔ Helps maintain discipline. When used with clear trading rules, cheat sheets encourage consistency and help traders stick to their strategy, minimizing impulsive decisions.
Limitations Of Using The Chart Patterns Cheat Sheet
✘ Oversimplification. While cheat sheets offer a quick reference, they often miss important nuances that can significantly impact trading decisions. Relying too much on simplified information increases the risk of misjudgments.
✘ Dependence. Relying too heavily on cheat sheets can prevent traders from developing a deeper understanding of the market. Focusing solely on patterns may lead to overlooking key factors like market psychology and supply-demand dynamics.
Before trading with real money, make sure your pattern-based strategy is profitable on a demo account. The ATAS Market Replay function and historical data will help you with this. Use these tools to complement traditional candlestick analysis with professional volume-based techniques, such as footprint charts, the Delta indicator, market profile, and other trader-designed solutions. This will help refine your trading skills and reduce risk.
Download ATAS. Once you install the platform, you will automatically get the free START plan, which includes cryptocurrency trading and basic features. You can use this plan for as long as you like before deciding to upgrade to a more advanced plan for additional ATAS tools. You can also activate the Free Trial at any time, giving you 14 days of full access to all the platform’s features. This trial allows you to explore the benefits of higher-tier plans and make a well-informed purchasing decision.
Do not miss the next article on our blog. Subscribe to our YouTube channel, follow us on Facebook, Instagram, Telegram or X, where we publish the latest ATAS news. Share life hacks and seek advice from other traders in the Telegram group @ATAS_Discussions or on Discord.
Information in this article cannot be perceived as a call for investing or buying/selling of any asset on the exchange. All situations, discussed in the article, are provided with the purpose of getting acquainted with the functionality and advantages of the ATAS platform.