This article explains the principle behind categorizing all available indicators on the platform. Novice ATAS users can also gain insights into the purpose of indicators and how to work with them.
Read in the article:
Why Indicators Are Necessary
Among traders, there is a belief that trading profitably is possible even with a “clean“ chart, without relying on any indicators. This becomes achievable when employing specific strategies:
- Elliott Waves: analysts manually break down price movements into wave structures of impulses and corrections, upon which decisions are made;
- breakouts of graphical patterns and/or extremes;
- candle patterns;
- strategies based on statistical data.
The list could go on, but is it necessary? Indicators are designed to simplify a trader’s work, making it more efficient, saving time and effort. Completely dismissing indicators might seem like a dubious idea, though it can be viable.
Various indicators help to:
- assess market sentiments and trend strength;
- identify entry and exit points;
- reduce risks;
- evaluate the impact of fundamental factors;
- perform other actions.
The professional ATAS platform provides access to approximately 250 indicators by default, and their number constantly grows with each platform update. This list is complemented by indicators from partner projects and custom developments.
The Indicator Manager enables you to manage a variety of available indicators.
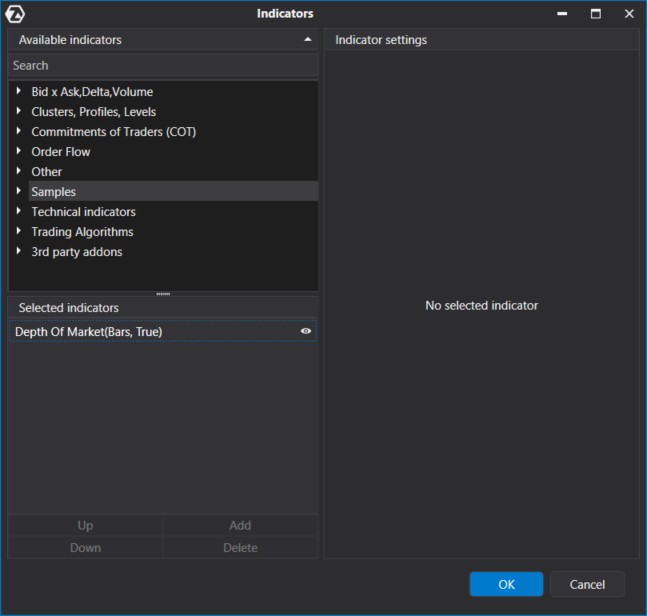
You can access the Indicator Manager in three ways —just make sure you have a chart open:
- Press Ctrl+I.
- Click the icon in the top panel of the chart module.
- Select the corresponding option from the context menu (right-click on an empty space on the screen).
To enhance navigation, all available indicators are neatly categorized into sections, which we will explore further.
About Categories of Indicators in the ATAS Platform
At the top of the menu, you will find indicators designed specifically for volume analysis, as the platform is crafted to focus precisely on this aspect of market assessment.
Explore the benefits of volume analysis in the following articles:
In the central catalog section, you will find the Technical Indicators section, which includes all the classic and well-known indicators. Their usefulness might be questionable. But if you happen to need an indicator you have read about in a well-known trader’s encyclopedia, you will certainly find it here.
Below, you will find categories of indicators developed by individual projects. These could be partner-developed indicators or ones you create yourself.
Further in the article, we will provide a detailed description of each section.
Please note: The list may be subject to modifications as the platform evolves.
Bid x Ask, Delta, Volume
The first group includes indicators (in alphabetical order):
- Bars Volume Filter
- Bid Ask
- Cumulative Daily Volume
- Cumulative Delta Volume
- Delta
- Volume
- Volume On the Chart
These are basic indicators for analyzing vertical volumes.
Here is what all the indicators of this group look like on a gold futures chart:
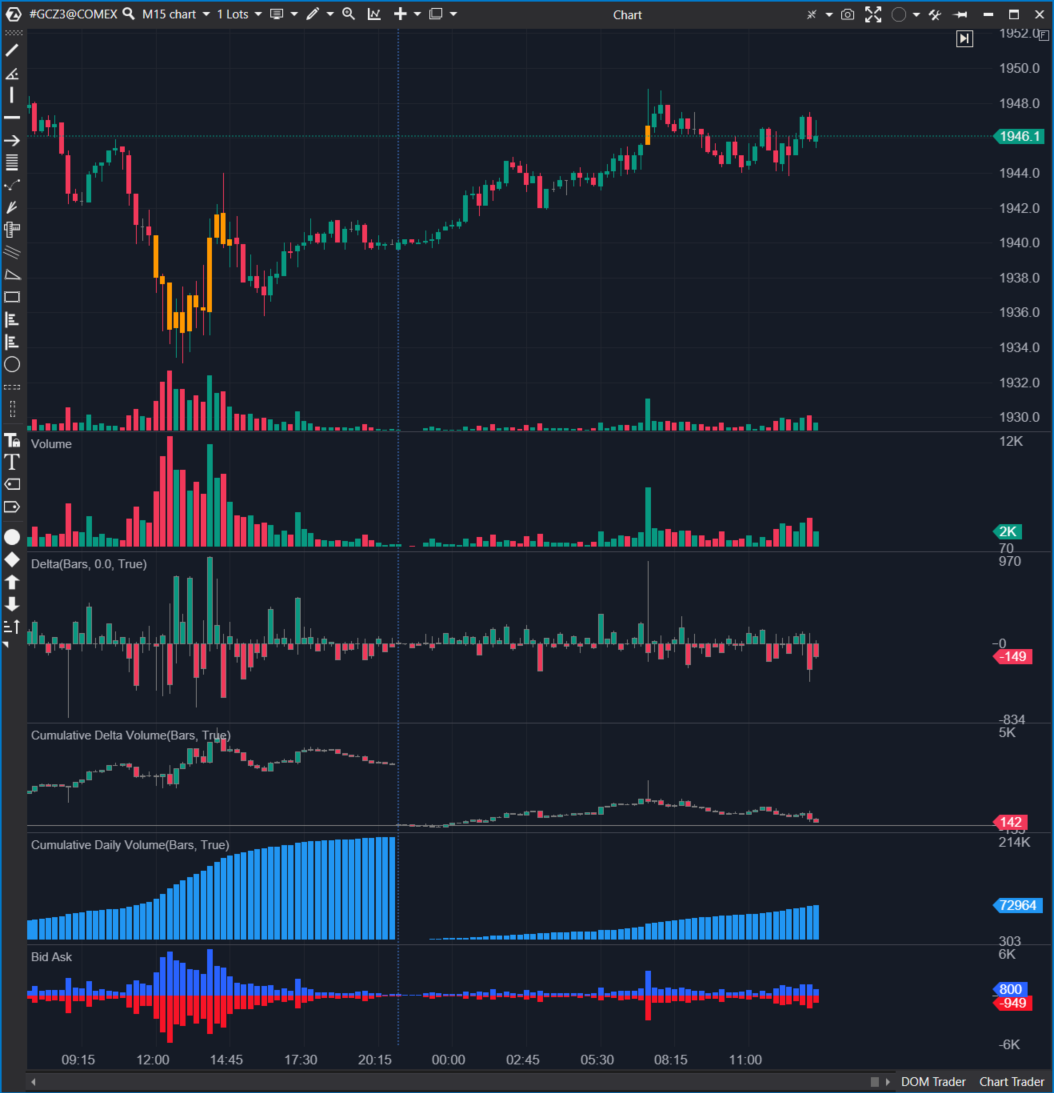
The Bars Volume Filter Indicator colors candles based on a specified volume filter: above a set value and/or below a set value. In this case, all candles with a volume above 5,000 contracts are colored yellow.
The Volume On the Chart Indicator (upper histogram) displays exchange volumes in the chart area to save space. In this case, the histogram can overlay candles of the price.
The Volume Indicator (second histogram from the top) represents the standard volume histogram. It appears in a separate panel below the price area.
The Delta Indicator (third histogram from the top) shows the difference between market buys and sells. A negative delta (displayed in red) indicates more initiative selling activity in the market.
The Cumulative Delta Volume Indicator (fourth histogram from the top) accumulates negative and positive delta values from the beginning of the day.
The Cumulative Daily Volume Indicator (blue histogram) accumulates volume values from the beginning of the day. When the day ends, it resets.
The Bid Ask Indicator (bottom histogram) shows market buys (above zero) and sells (below zero). Taking their absolute values gives the volume indicator. Subtracting negative values from positive ones results in the delta indicator.
Learn more about what Bid, Ask, and Spread mean in detail.
Clusters, Profiles, Levels
Horizontal volume analysis tools are collected in a separate group (in alphabetical order):
- Cluster Search
- Cluster Statistic
- Dynamic Levels
- Dynamic Levels Channel
- Market Profile & TPO
- Maximum Levels
Here is how all the indicators in this group appear on a cluster chart of gold futures (cluster chart in Volume mode, with brighter blue indicating larger cluster volume):
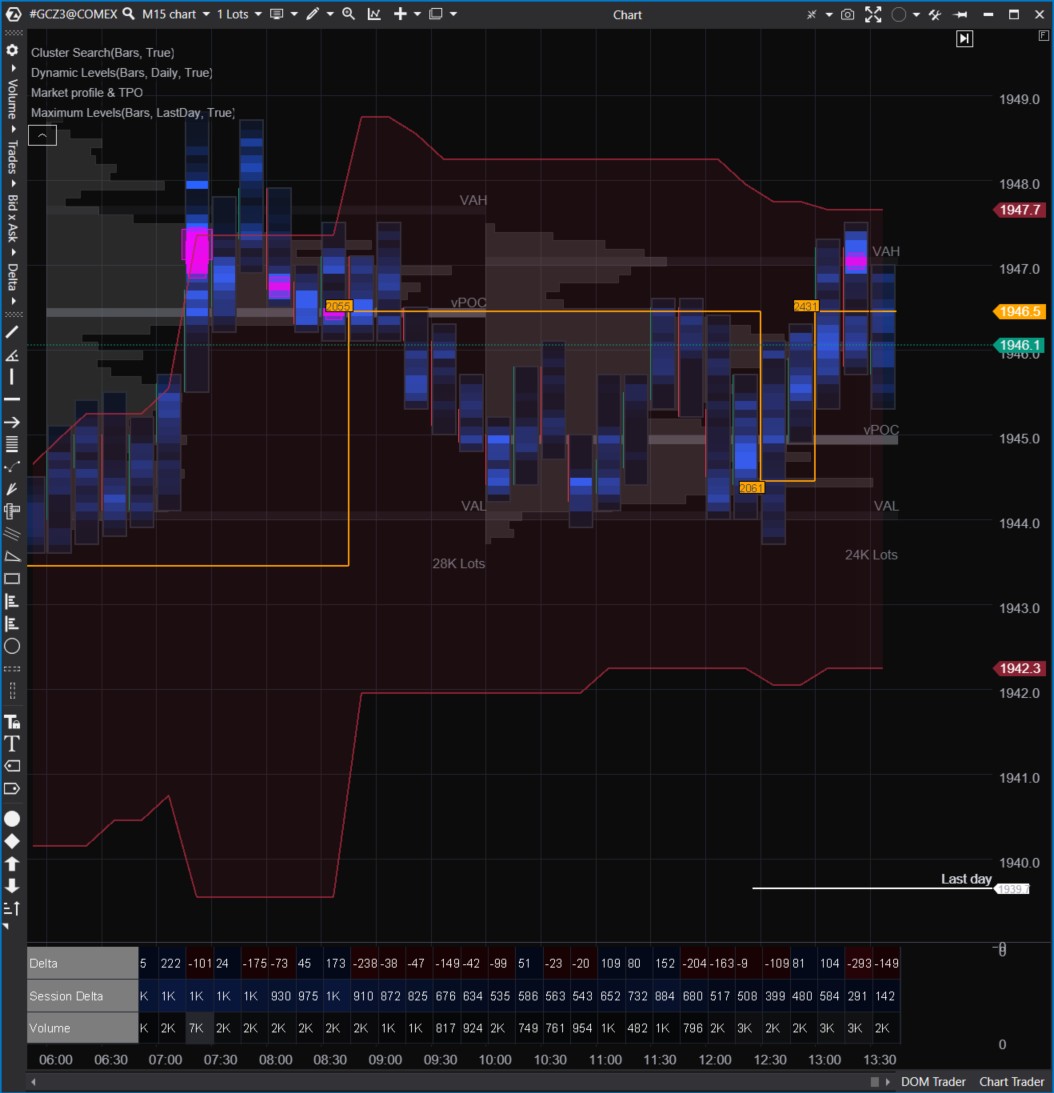
The Cluster Search Indicator colors clusters based on specified search criteria. In this case, all candles with a volume above 5,000 contracts are colored pink. The wide range of criteria makes this indicator a powerful tool for volume analysis. More details about the indicator can be found in this article.
The Cluster Statistic Indicator (three lines in the area below the chart) provides statistical summaries for each candle. It offers a wide range of parameters for displaying statistics. You can change the color depending on the data.
The Dynamic Levels Indicator (a red channel with a yellow dashed line) illustrates the dynamics of VAL, VAH, POC levels (terms related to the volume profile).
Market Profile & TPO (gray histogram) is a subtle yet highly valuable tool frequently used by traders analyzing volumes. The indicator constructs levels based on the activity observed in them. The more interesting a level is for market participants, the more noticeable it becomes on the profile, indicating a higher likelihood that the price will react to it.
Learn more about market profile in article How to Use Market Profile.
Maximum Levels (white label) is a simple auxiliary indicator designed to help traders remember significant high-volume levels from the past.
COT indicators
The Commitments of Traders section contains specific indicators. They reflect the dynamics of weekly published reports on trader positions in the United States. As envisioned by those who implemented this practice, these reports aims to make markets more transparent and minimize the risk of panic. All indicators from this group have been added to the daily chart below.
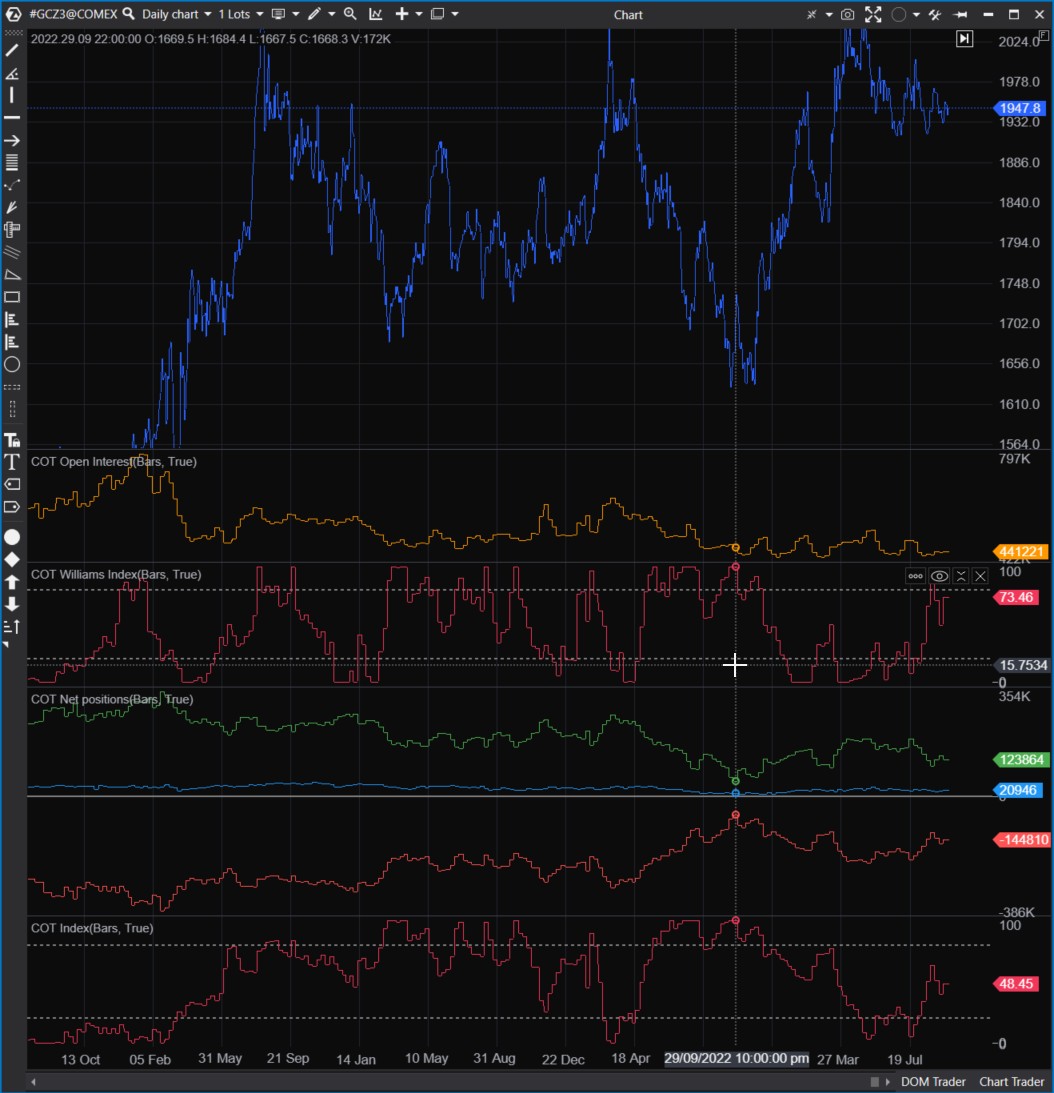
These indicators will be useful for those investing in US markets for a period exceeding one month, given that the reports are published weekly and with a delay.
For more information about the Commitments of Traders indicators, read the article on COT indicators analysis.
Order Flow Indicators
The indicators in the Order Flow section are highly sensitive, focusing on the flow of individual trades (prints). This sensitivity comes with increased computer load — to mitigate this, some indicators have limit how far back they analyze historical data.
- Adaptive Big Trades
- Big Trades
- DOM Levels
- Market Power
- OI Analyzer
- Order Flow
- Order Flow Rhythm
- Tape Pattens
The screenshot below displays indicators from the Order Flow section. In this example, Litecoin futures from the Binance futures exchange.
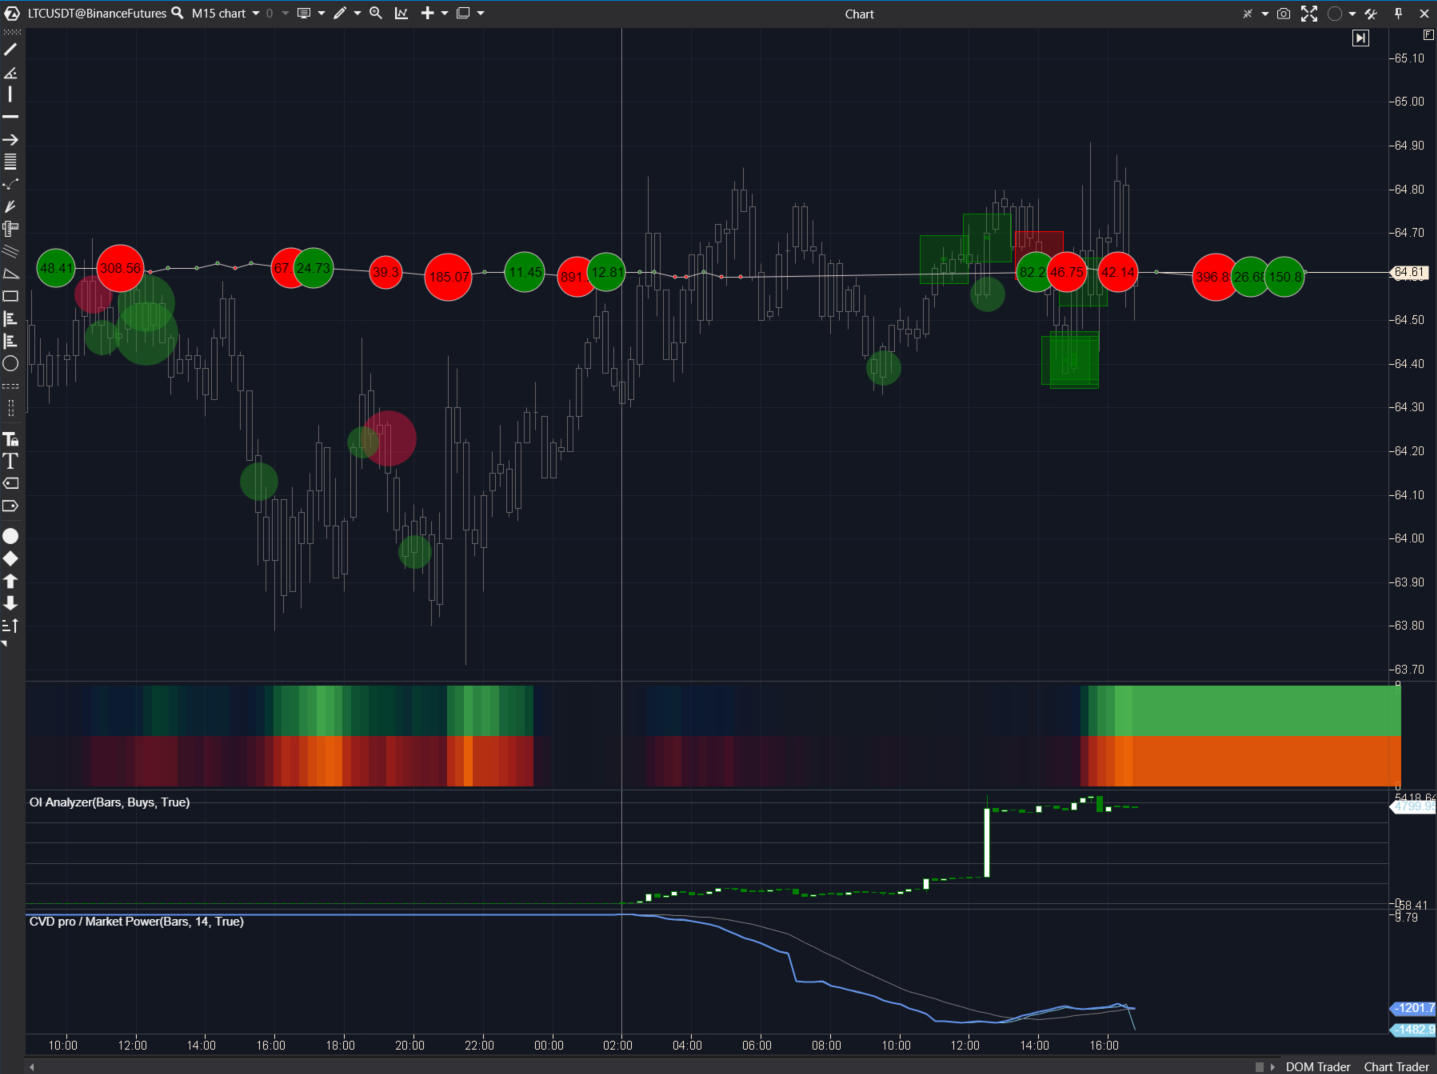
The Adaptive Big Trades Indicator is represented by red and green circles. It analyzes all trades within the visible portion of the chart and displays the ten largest trades, indicating the trade direction (green for market buys, red for sells). Its “elder sibling,“ the original Big Trades Indicator, offers more settings and is recommended for more experienced users.
The Tape Patterns Indicator appears as red and green squares. It functions as a filter, analyzing all trades and searching for chains of trades that match specified criteria. This process is resource-intensive, so the indicator considers only the current trading session. However, you can explore the indicator’s functionality by specifying the last day for data loading in the timeframes menu. More details can be found in the article Gain an Advantage with the Tape Patterns Indicator.
The Order Flow Indicator appears as a chain of red and green elements. It indicates recently executed trades. The largest trades (a parameter you can adjust) are represented by circles with numbers.
The Order Flow Rhythm Indicator appears as a red-green bar with varying intensity. It indicates the speed of buy and sell trades. The brighter the color, the faster trades appear on the tape. In fact, it is an interpretation of the Speed of Tape indicator with a slightly different visualization. You can find a detailed article about this tool in Analyzing Smart Tape with the Speed of Tape indicator.
The proprietary OI Analyzer Indicator is represented by white and green candles. It indicates open interest, i.e., the size of existing trader positions. If the OI is increasing, it means traders are opening new positions. This indicator works only on specific markets and is calculated for the current day only. For more information, read the article What Does Open Interest Cover?
The Market Power Indicator is conceptually similar to the Cumulative Delta. However, its unique feature lies in the ability to filter various trades by volume. For instance, the settings applied in the screenshot display trades with a volume of no more than 1 contract. If the blue line is trending downward, it suggests that small traders anticipate a price decrease. However, they are usually mistaken.
Additionally, within this group of indicators, there is the DOM Levels (Heatmap or Liquidity Map) — it is not shown in the screenshot as it deserves a separate description. You can find more information about it in the article Heatmap in ATAS Functionality.
Indicators from the Other Section
This section includes indicators that enhance volume analysis and the platform’s capabilities. They do not fully correspond to the categories or indicators previously described in Technical Analysis. Many of them are proprietary developments of our partners.
The chart below shows:
- Bar Numbering
- Depth of Market
- External Chart
- HRanges
- RTIndicator
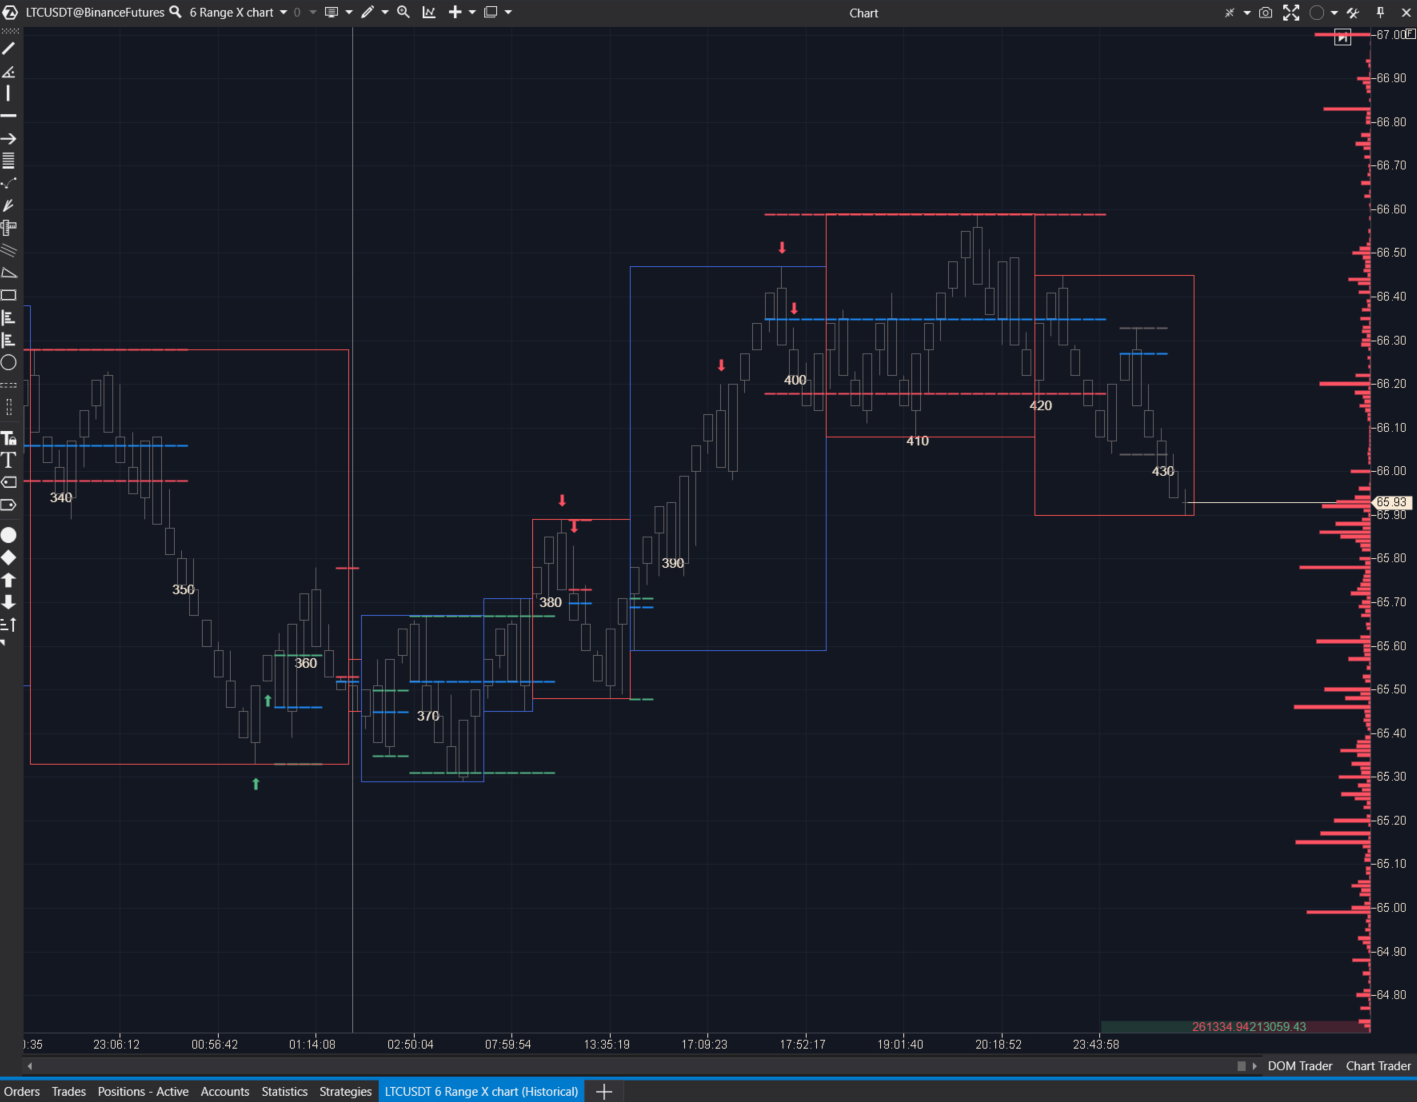
The Bar Numbering Indicator simply helps count how many bars (candles) are loaded on the chart.
The Depth of Market Indicator is entirely unique and highly significant. It displays data from the order book as a histogram on the right side of the chart (by default). The taller the bar on the histogram, the larger the volume listed in the order book at that level. For more information on market depth, you can read the article on What the Depth of Market Indicator Means.
The External Chart Indicator overlays the outlines of candles from higher timeframes on the chart using red and blue rectangles, making it easier to track the overall picture.
The HRanges Indicator is a proprietary tool for trading based on reversal strategies. More details can be found in the Knowledge Base.
The RTIndicator is another proprietary tool designed for trading reversal strategies on range charts. More details can be found in the Knowledge Base.
Technical Indicators
This section contains classic technical analysis tools:
Using the links above, you can get ideas on how to combine these well-known indicators with modern volume analysis methods.
We also recommend reading the article Forex Indicators vs. ATAS Tools.
Indicator Capabilities
Working with indicators in the ATAS platform provides significant advantages:
- Visualization Settings. Almost all indicators have numerous customization parameters, making the ATAS platform highly flexible for creating unique workspaces tailored to individual preferences.
- Filters. Indicators like Volume, Cluster Search, Big Trades, etc., come with filters that simplify working with large volumes of data, enhancing its efficiency. For example, you can focus on specific volume values.
- Alerts. When certain values are reached, ATAS can alert the user about these events.
- Source Selection. In some indicators, you can choose sources not limited to price data (typically closing of the candle) but also volume data or indicators from other tools.
- Display Panel Selection. You can configure the display panel for each indicator—create a new one or combine it with another indicator.
- Grouping on the Chart Indicators can be moved as layers on the chart relative to each other. This will provide better information interpretation.
- Reference Data. In the Indicator Manager, under each indicator’s settings, there is a link to an article in the Knowledge Base. Here, you can study the specifics of each tool’s operation and settings.
It is worth mentioning the capability to develop custom tools — indicators and automated trading strategies that can be connected via API. You can access almost all ATAS indicators, obtaining the necessary parameter values. This opens up a universe of possibilities. All you need is proficiency in the C# programming language.
Conclusions
The ATAS platform indicators provide you with a powerful arsenal for expert-level market analysis:
- primary focus is on volume analysis indicators:
- in addition, you have access to indicators from classical technical analysis;
- the list of available indicators is constantly expanding with each ATAS platform update;
- proprietary indicators are available;
- each indicator has flexible settings;
- there is the option to add indicators via API (both custom and from partner projects).
To use ATAS professionally, you do not need to memorize all the indicators. By combining 2-5 of them on a single chart, you can create a potent combination to effectively assess the market and make trading decisions.
To learn how to use ATAS indicators, pay attention to:
- ATAS Blog: insights on using indicators, building strategies, and other useful information are published here.
- Market Replay Simulator enables you to learn to read indicators much faster and without risking your capital. To practice analyzing Order Flow indicators, choose the Level II data loading mode when launching the simulator.
Download ATAS. It is free. During the trial period, you will get full access to the platform’s tools to experiment with the DOM and other indicators. Moreover, you can continue using the program for free even after the 14-day trial period is over, whether it is for cryptocurrency trading or volume analysis.
That ATAS platform:
- enables you to download tick history from the futures, stocks, and crypto markets so that you can get a detailed picture of the market;
- provides numerous advantages for traders who combine user-friendly cluster charts, useful indicators, and other professional-level features in their work.
Do not miss the next article on our blog. Subscribe to our YouTube channel, follow us on Facebook, Instagram, Telegram or Twitter, where we publish the latest ATAS news.
Information in this article cannot be perceived as a call for investing or buying/selling of any asset on the exchange. All situations, discussed in the article, are provided with the purpose of getting acquainted with the functionality and advantages of the ATAS platform.