
In this article, we will talk about a trading strategy designed to help you join the main trend in an easy way when an intermediate pullback (correction) ends. This material is packed with charts and keeps the text to a minimum.
Read more:
The Core Concept of the Strategy
POC (Point of Control) is the price level where the highest volume of trades occurs over a selected period. The market profile indicator (horizontal volumes) helps identify these levels.
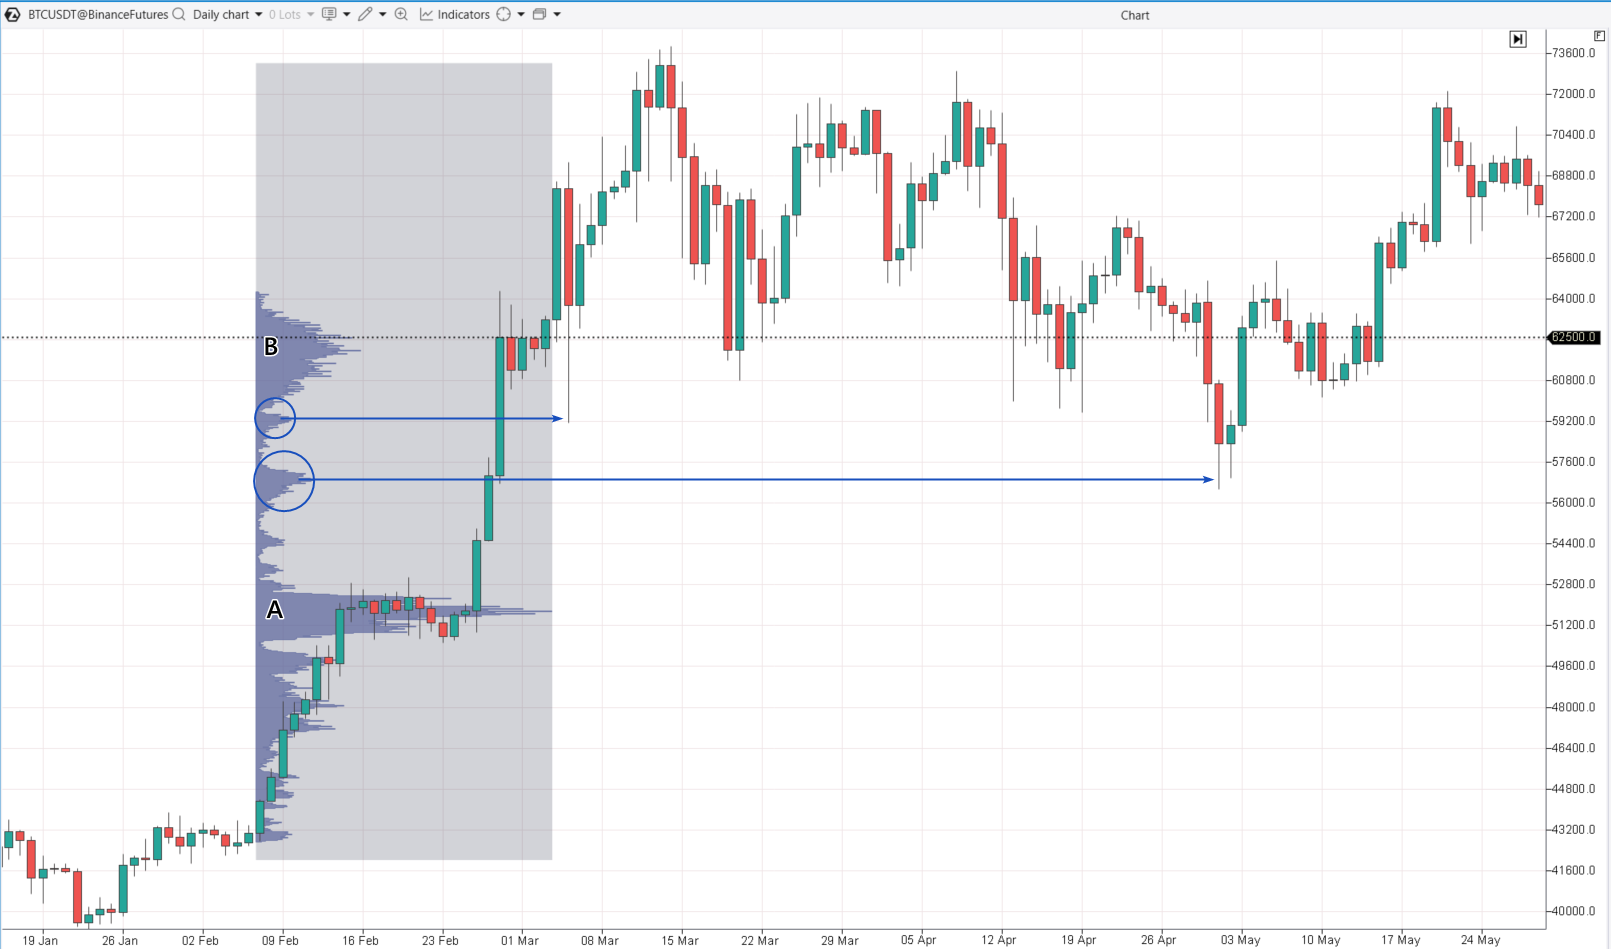
Let’s explain the main idea of the “Mini-POC Test” strategy using a daily Bitcoin chart (below).
A market profile drawing object has been added, covering the price increase period from February 7 to March 3, 2024:
The chart tells the following story:
- During the price rise period, a temporary (lasting several days) balance of supply and demand (marked as A) formed around $52k. This balance is shown by the bulge in the profile.
- The balance around $52k was then disrupted (sellers were in the minority), resulting in three wide bullish candles on the chart.
- This was followed by the formation of a new balance of supply and demand (marked as B) around $62k. In other words, buyers and sellers once again reached a temporary consensus on the fair price of Bitcoin, considering all influencing factors.
Interestingly, during the price rise, small bulges (marked with circles) formed on the chart between balance zones A and B. These are the mini-POC levels that the strategy is based on. They are called mini-POCs in this context because they are significantly smaller than the POC balances A and B.
The idea is that if balance B is above balance A (a sign of a bullish market), the upward trend might continue after testing the mini-POC level located between balances A and B. Conversely, if B is below A, testing the intermediate mini-POC could lead to a continuation of the downward trend.
The arrows show how the strategy played out: after testing both mini-POC levels, the price rose by more than $10k.
Why the “Mini-POC Test” Strategy Works
Typically, mini-POC levels appear when intermediate support and resistance levels are broken (often at psychological price levels).
Let’s start with some axioms:
- The market is designed so that the majority always loses.
- Prices move in ways that cause the most pain to the largest number of participants.
- Just when you think you have outsmarted the market, be ready for the price to move against you.
In the chart above, mini-POCs formed at the $57.0k and $59.2k levels, acting as temporary resistance points on the way to balance B.
During the formation of the mini-POCs, some traders opened long positions, expecting the upward momentum to continue. Believing they had made the right call, they probably set stop-loss orders at breakeven to protect themselves.
If the above-mentioned theses hold true, then testing the mini-POC level is somewhat connected to (intentionally or unintentionally) “triggering” these market participants’ stop-loss orders, leaving them without profit even if they made the correct decision (causing pain).
Historical analysis indicates that after testing mini-POCs, the price often resumes movement in the direction of the main impulse, signaling the end of the correction.
Examples on Charts
The charts and descriptions provided may not offer sufficient detail for some traders. Some may need information on stop-loss and take-profit levels or confirming signals. In reality, the content below provides an opportunity to create a personalized trading plan that takes into account individual preferences, favorite indicators, risk tolerance, and other factors.
Simply put, the main idea is presented clearly. For a more thorough analysis, use personal preferences and engage in independent research.
Example 1. Gold Futures Market
The chart below shows a decline from balance zone A to balance zone B.
The profile indicates the formation of a mini-POC (marked with a circle) around $2353 after breaking through local support.
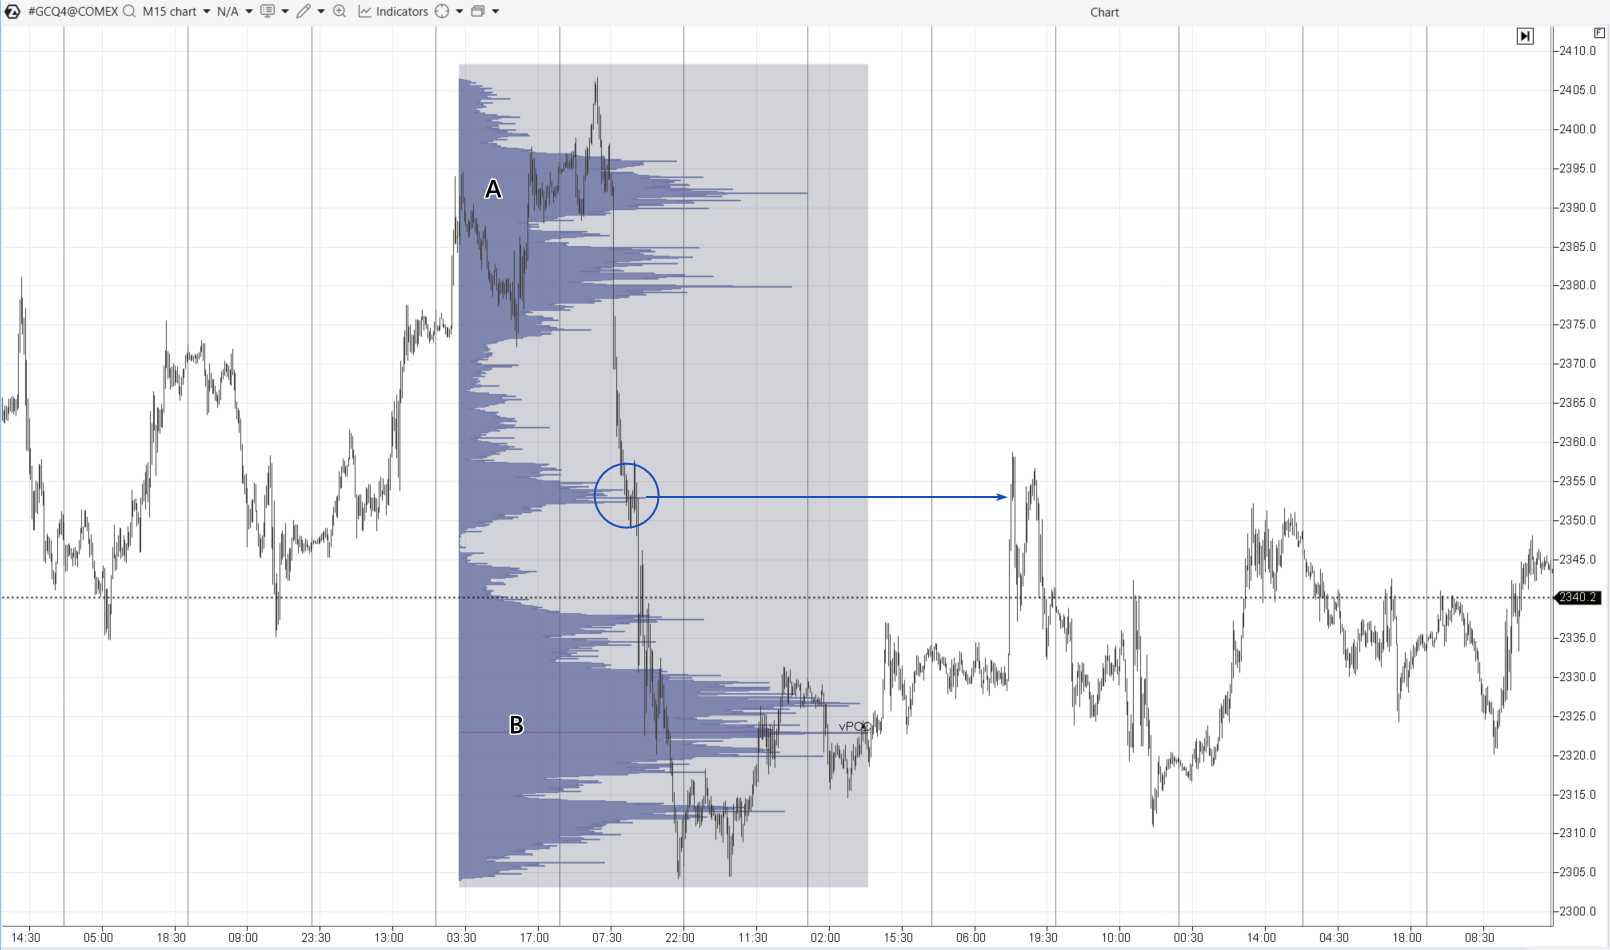
Several days later, a strong bullish impulse formed in the market; however, the mini-POC level acted as a reliable resistance for it (indicated by the arrow).
Example 2. E-mini S&P 500 Futures Market
The daily cluster chart (Scale = 10) below shows the price increase of E-mini S&P 500 futures from balance zone A (formed at the end of April 2024) to balance zone B. Mini-POC levels are marked with circles, noticeable on the graphical tool for drawing arbitrary profiles, which covers the period of price growth.
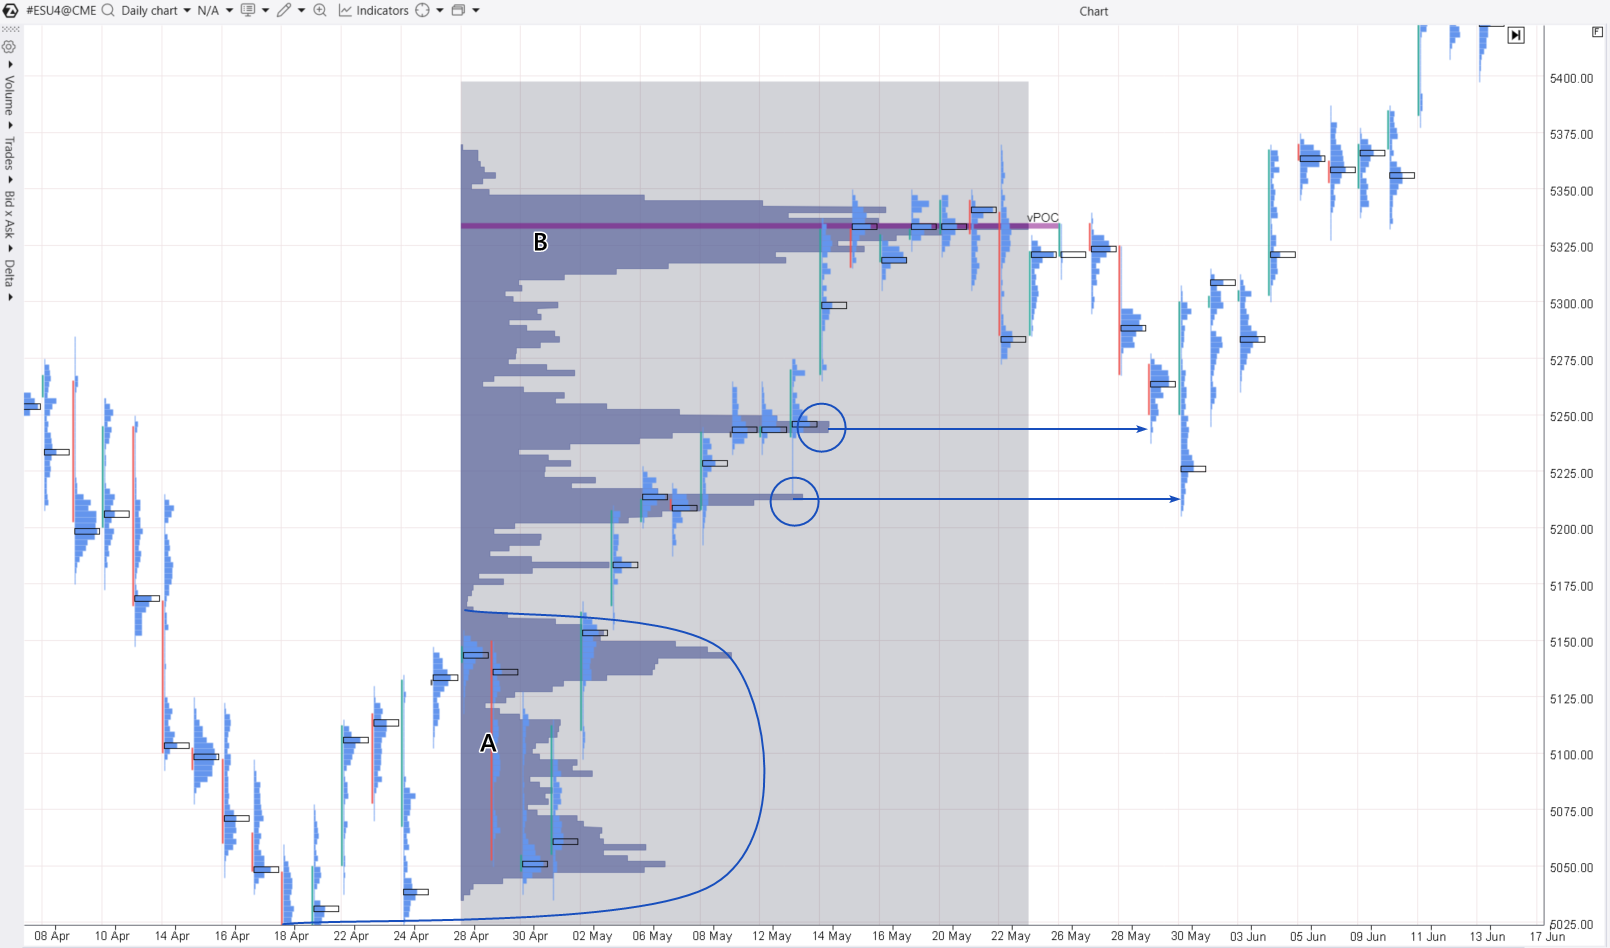
At the end of May, testing occurred at both levels:
- in the first scenario, the mini-POC level acted only as local support (potentially, the long position could have been closed due to a stop-loss order);
- in the second scenario, bulls successfully used it to resume the upward trend, surpassing the May highs (and recovering losses from the initial long position).
Example 3. Apple Stock
On May 3, Apple released its earnings report for the first quarter, which exceeded expectations. Fueled by optimism, AAPL shares surged above $180 and then consolidated for several days, forming balance zone A.
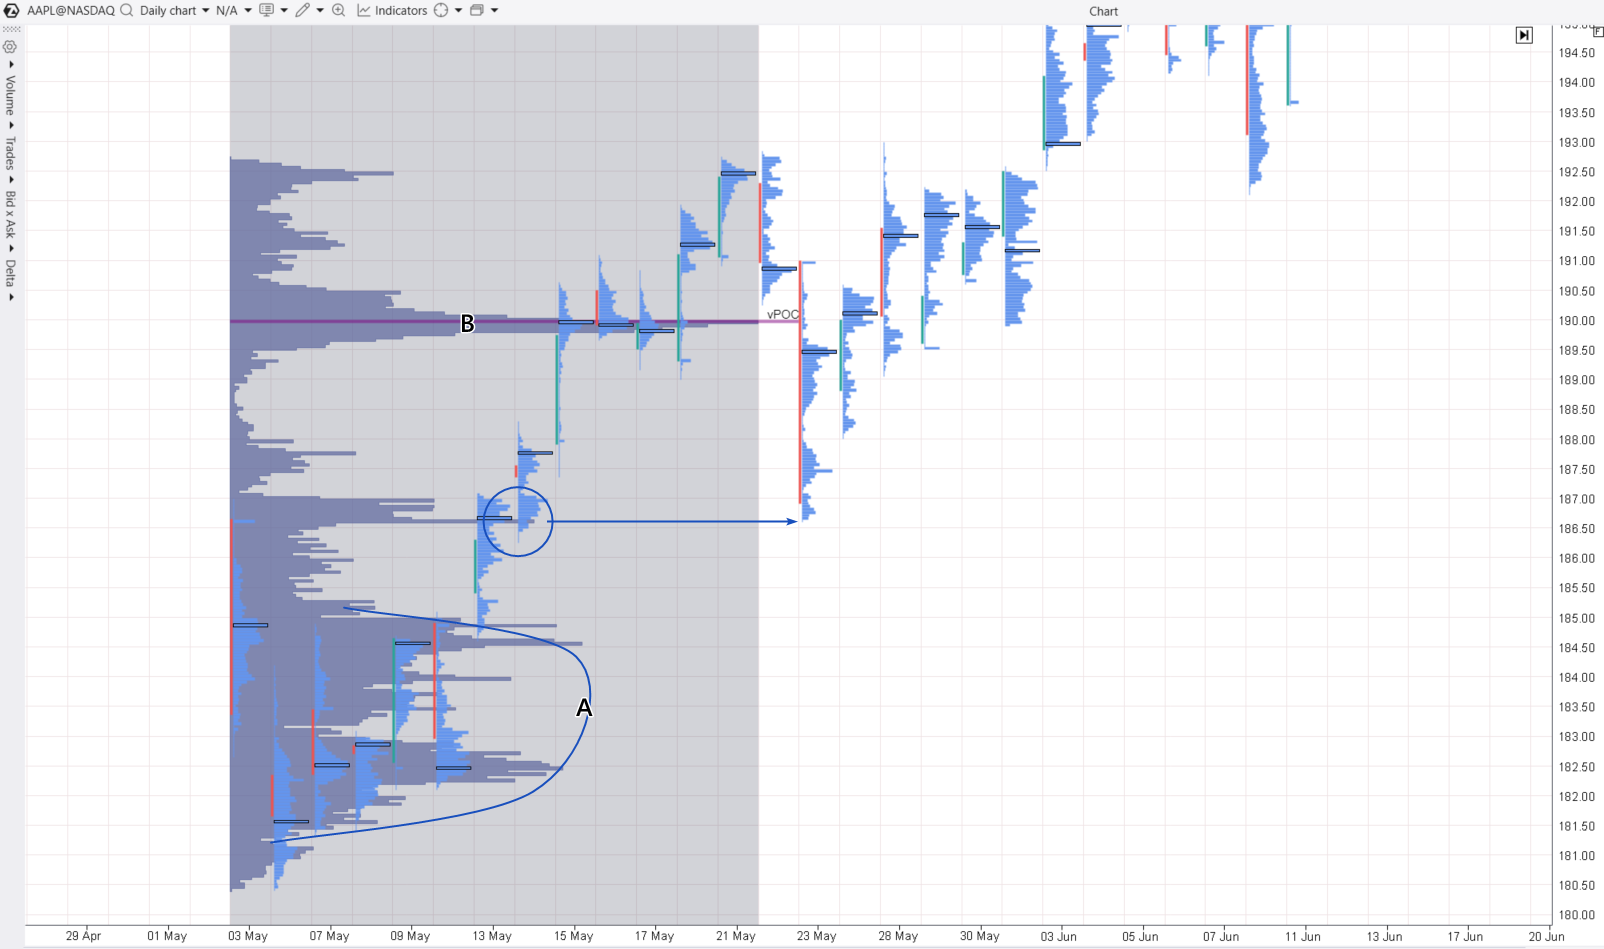
Subsequently, the price resumed its upward trend, reaching a psychological level of $190 per share, where it consolidated within a narrow range B.
The profile indicates the formation of a mini-POC at $186.60, tested on May 23 before the price continued its upward trend (to a historical high above $200).
Example 4. DAX Index Futures
The market unfolded as follows:
- Formation of balance zone A.
- Decline to balance zone B with the formation of a mini-POC just below 18,750.
- Testing of the mini-POC level a few days later.
- Resumption of the downward trend with a new low in balance zone B.
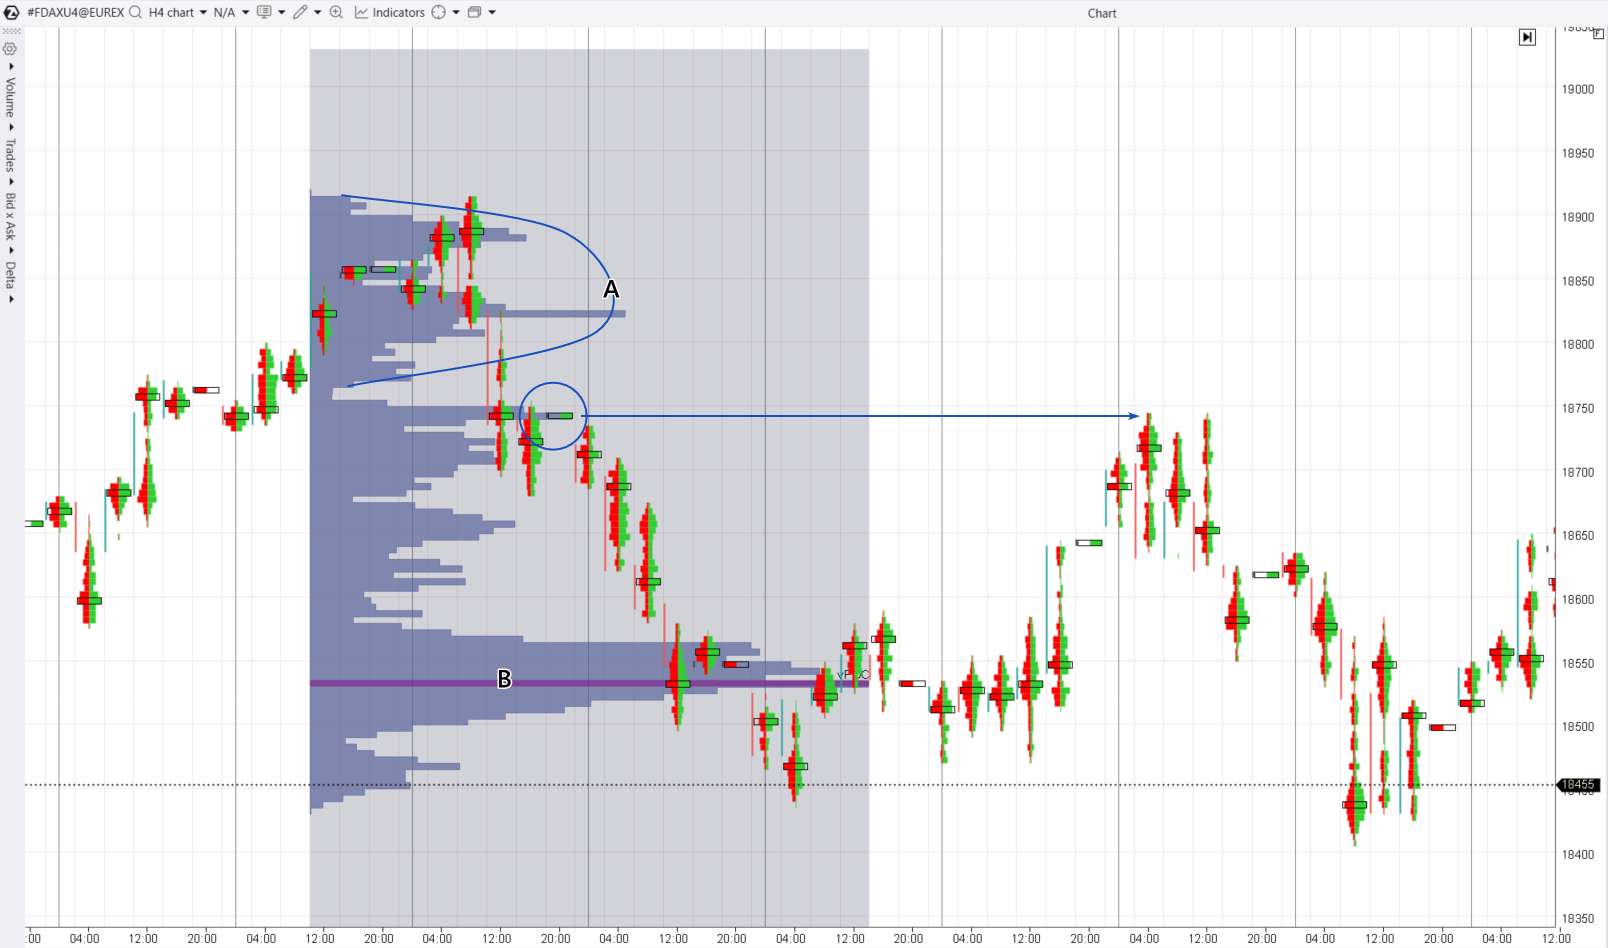
This time, the mini-POC testing reached a key level without much deviation, allowing for a precise entry into a short position at the market peak.
Here is how confirmation could have been achieved on the morning of June 3, 2024:
- Use a range chart.
- Use a delta indicator.
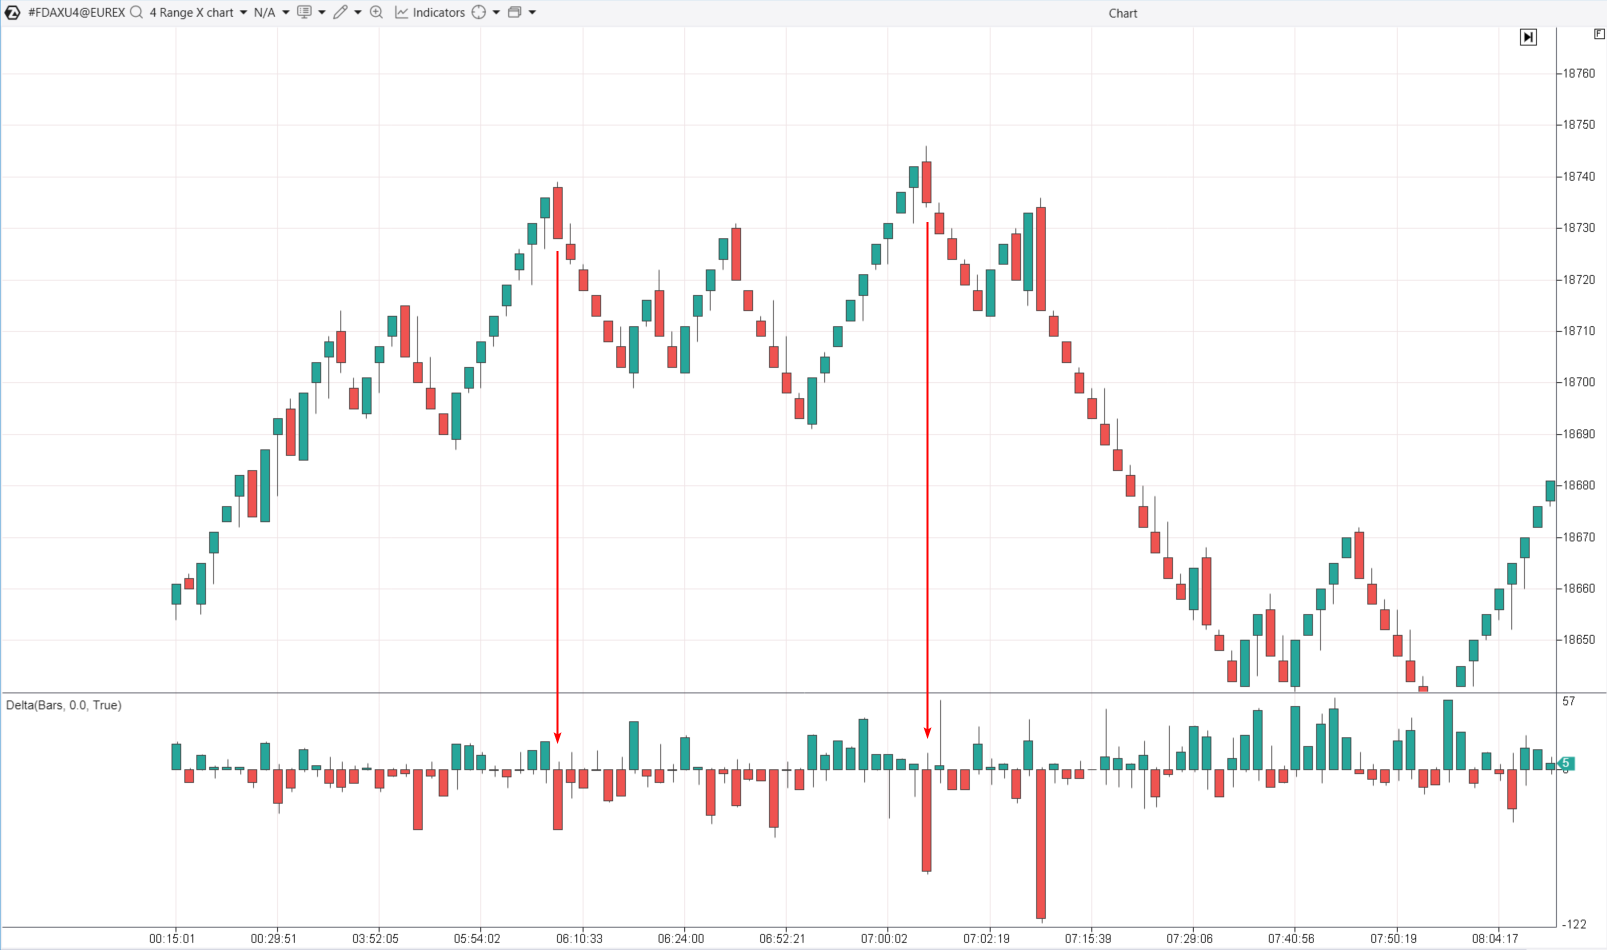
A bearish reversal (engulfing) range with a spike in negative delta (arrows indicating 2 instances) – a sign of market selling becoming more active and a reason to open a short position near the mini-POC just below 18,750.
Strategy Rules. How to Trade Mini-POC Level Tests
A basic plan for building a more detailed strategy for trading mini-POC levels can look like this:
1. Use the market profile to find the transition of supply and demand balance from zone A to zone B.
2. Identify mini-POC along the price path from A to B. This can be subjective based on the profile shape. Ideally, the mini-POC should be clearly defined, narrow, and distinct.
3. Wait for the testing moment. There are no guarantees that the test will occur, so to avoid wasting time monitoring, we recommend using alerts. This also helps track multiple markets.
4. Get confirmation. This can be done using the Delta indicator on a lower timeframe or other tools.
5. Enter the position, setting stop-loss and take-profit levels according to your personal preferences.
After that, manage the position by analyzing chart signals and the fundamental background, and monitoring the situation’s development.
In general, there are two possible outcomes:
Positive outcome – the price surpasses the previous extremum in the direction of the main trend. In this case, you can take profit on half of the position and let the other half run for a longer-term gain.
Negative outcome – the price goes through the mini-POC level with only a minimal bounce. If the bounce is not enough to move the position to breakeven, it should be closed at the stop-loss.
Pros and Cons
Like any trading strategy, the “Mini-POC Test” does not guarantee profits and has its strengths and weaknesses.
Pros of the Strategy
✔ Offers a straightforward and easy-to-understand approach, focusing on trend trading at the end of a pullback (correction).
✔ The profile accurately highlights levels where the correction might conclude.
✔ Effective across various timeframes and markets, including crypto, stocks, and futures.
✔ Allows for the use of confirming signals (e.g., analyzing the Delta indicator on lower timeframes).
✔ Supports various risk management strategies.
✔ Uses the harsh market’s nature to cause maximum pain to the majority of its participants (though this assertion can be debated).
Cons of the Strategy
✘ When testing the mini-POC level, the price may “undershoot” or “overshoot.” Sometimes, a reversal occurs precisely from the mini-POC level.
✘ There is no guarantee that the main trend will resume after the test.
✘ “Ideal” setups are less frequent than desired, particularly in currency markets.
✘ Analyzing POC levels involves subjective assessment.
How to Learn Trading with Mini-POC Level Tests
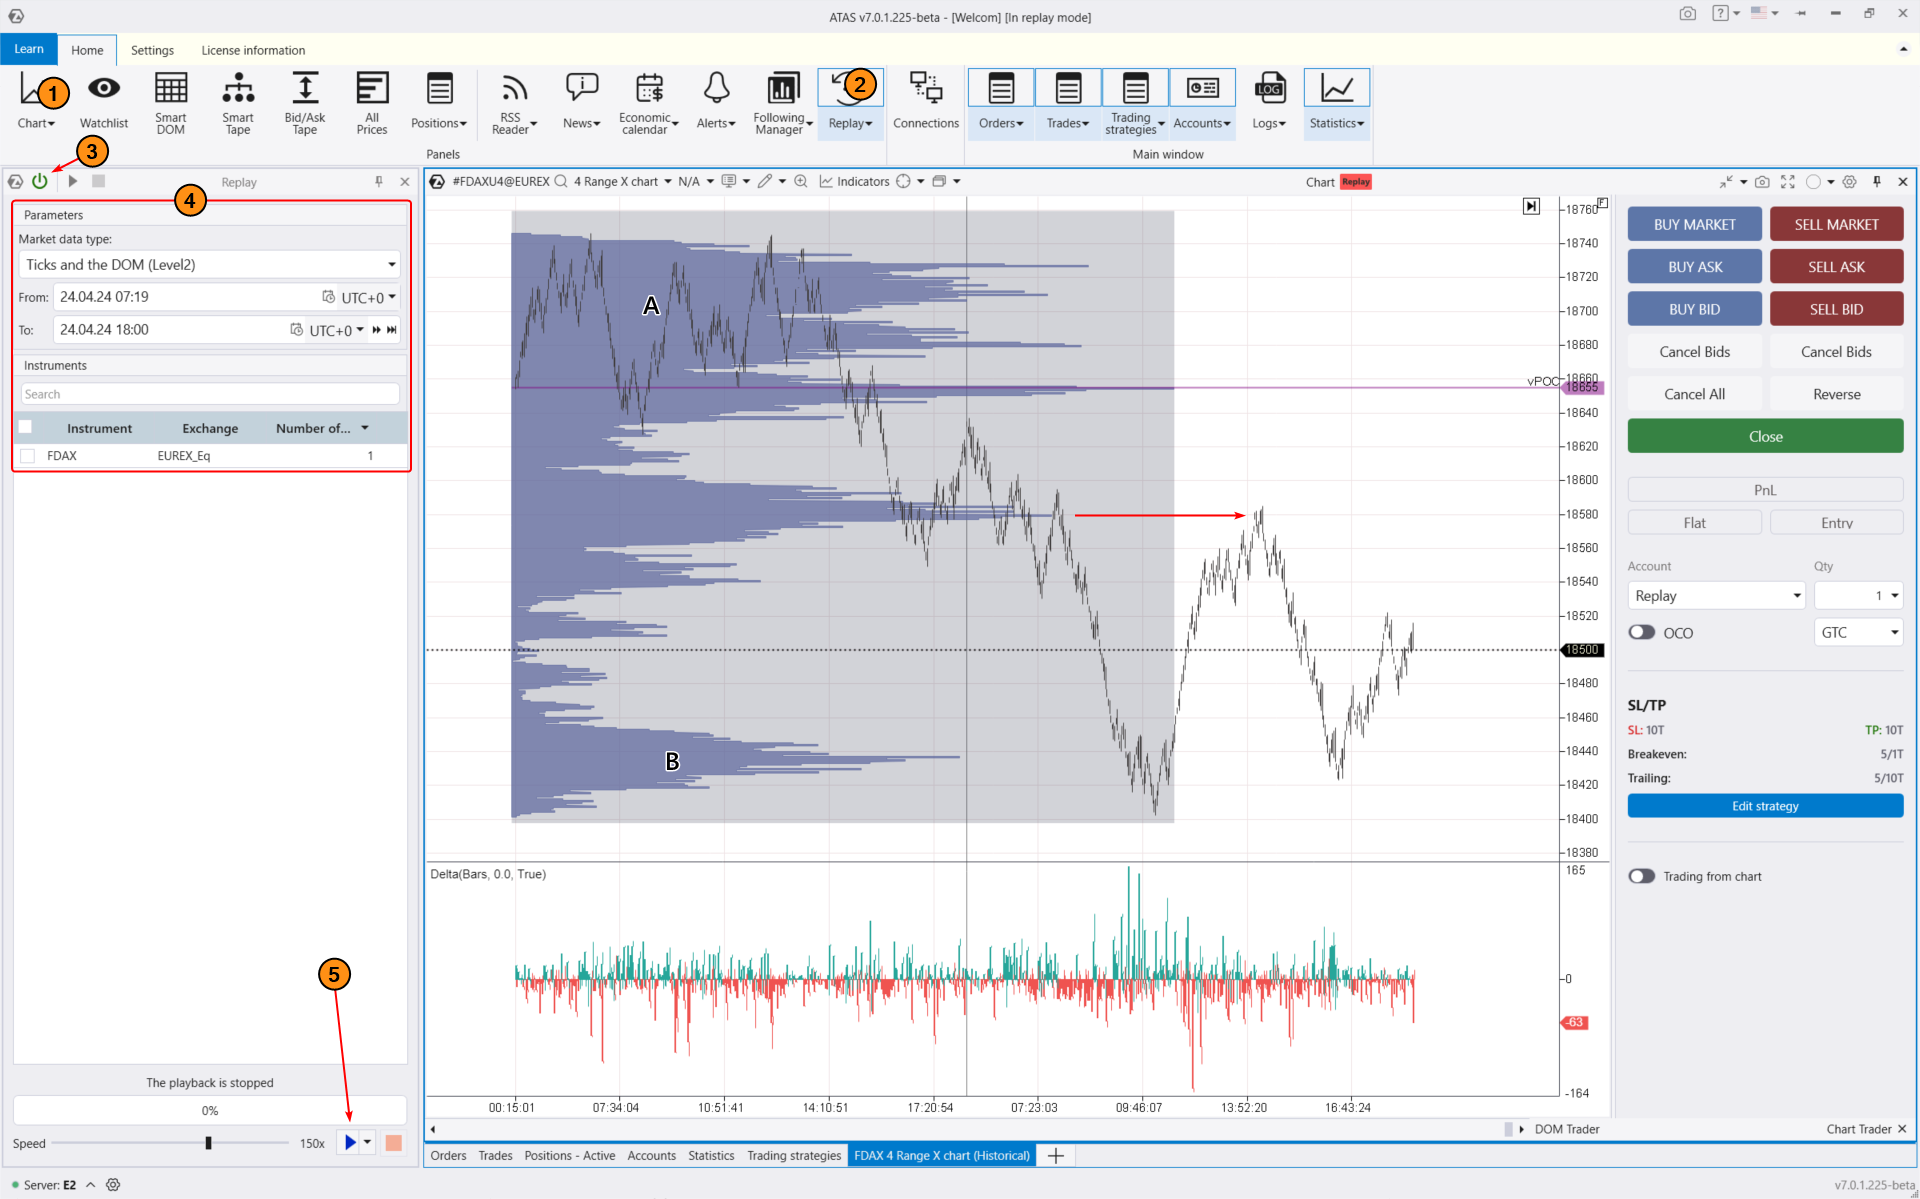
To reduce risks when learning to trade using the mini-POC level testing strategy, use the ATAS Market Replay simulator. This platform module uses historical data to create optimal learning conditions. Beginners can trade with any strategy (including POC tests) as if it were happening in real time.
To try the simulator, download the ATAS platform for free, install, and launch it, and then:
- Open the chart of the market you are interested in.
- Click on the Market Replay button in the main ATAS menu.
- Activate the Replay mode (the icon should turn green).
- Configure the settings (date, data type).
- Start playback and enhance your skills as a trader.
During your training in trading crypto using the Market Replay simulator, you can:
- adjust the playback speed, and pause;
- track market profile signals, delta, and other indicators (more than 400 available in ATAS);
- of course, use Chart Trader and other features to trade on the built-in demo Replay account and then analyze your performance;
- use drawing objects, for example, mark support and resistance levels, trend channels;
- use various chart types (e.g., non-standard Range XV);
- use exit strategies;
- analyze volumes in the Level II order book, for instance, using the DOM Levels indicator;
- do much more to learn trading corrections and following trends.
ATAS enables you to download tick (!) history from different markets (futures, stocks, cryptocurrencies), providing a comprehensive and highly accurate database for identifying patterns in price and volume interactions.
Conclusions
Market movements follow a cyclical pattern:
balance zone (flat) and convexity in the profile →
→ imbalance zone (trend) and a thinner profile →
balance zone (flat) and convexity in the profile →
→ imbalance zone (trend) and a thinner profile → and so on.
Balance zones represent the consensus among market participants regarding the fairness of a quote, reflecting the asset’s intrinsic value.
When external factors shift the balance of forces, the price enters a trend to seek a new, refined balance. During this process, mini-POC levels may form on the profile, testing which could provide favorable opportunities for entering positions with defined risk and high-profit potential.
Download ATAS. It is free. Once you install the platform, you will automatically get the free START plan, which includes cryptocurrency trading and basic features. You can use this plan for as long as you like before deciding to upgrade to a more advanced plan for additional ATAS tools. You can also activate the Free Trial at any time, giving you 14 days of full access to all the platform’s features. This trial allows you to explore the benefits of higher-tier plans and make a well-informed decision about purchasing.
Do not miss the next article on our blog. Subscribe to our YouTube channel, follow us on Facebook, Instagram, Telegram or X, where we publish the latest ATAS news. Share life hacks and seek advice from other traders in the Telegram group @ATAS_Discussions.
Information in this article cannot be perceived as a call for investing or buying/selling of any asset on the exchange. All situations, discussed in the article, are provided with the purpose of getting acquainted with the functionality and advantages of the ATAS platform.


