Clear visualization of order flow
Smart Tape, ATAS’s unique order aggregation tool, processes raw exchange data and presents actual trade volumes (Time and Sales) in a clear and readable format:
- get information on the real size of aggressive market trades;
- filter trades by volume to track actions of players with different capital levels;
- analyze market imbalances with the buy/sell strength indicator;
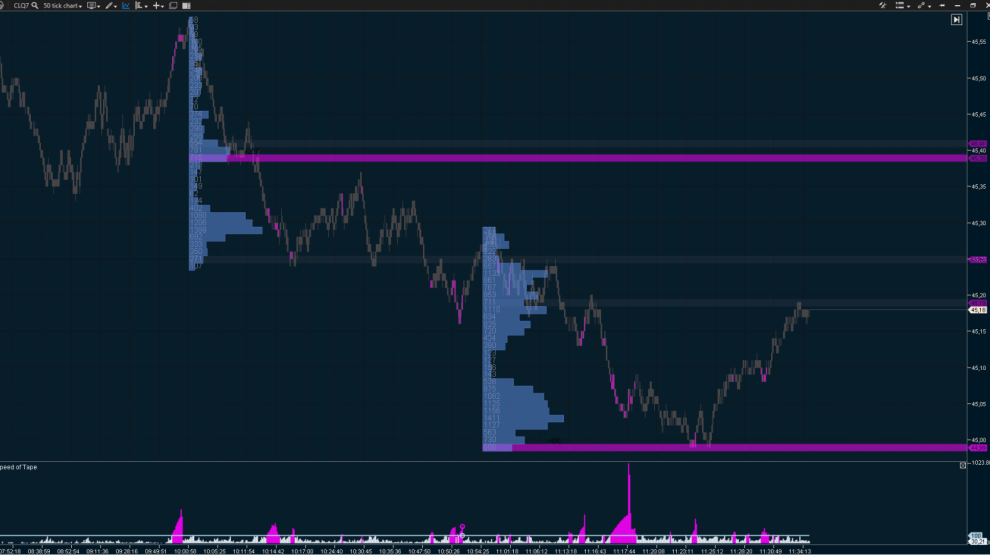
- monitor activity spikes using the speed of tape indicator;
- track UpTick & DownTick movements with + and – markers;
- capture market inflows and outflows with Open Interest (OI);
- analyze trade flow for any time frame with the History mode;
- pause the tape to ensure you don’t miss critical details.
Spread tape
Bid/Ask Tape is a simplified version of Smart Tape, displaying volume distribution within each spread:
- track the exact time, price, and volume of market buys and sells, along with the delta for every trade;
- analyze the balance between buyers and sellers to see who’s driving the market.
Volume filtering for Best Bid/Best Ask
Customize your tape display by filtering trades based on order volumes at the best price levels:
- set your own minimum and maximum volume thresholds for Best Bid and Best Ask;
- track the most relevant changes in the DOM for your strategy;
- focus on trades with specific liquidity levels.
Horizontal volumes
The All Prices module provides horizontal volume data for a selected time frame, adjusted to price levels. These insights can reveal strong support and resistance zones.
- track the number of contracts traded at a specific level during your chosen period;
- monitor the total number of trades executed at precise price levels;
- analyze market buy and sell volumes, including their delta.
Detailed tape view
Smart Tape, by default, consolidates a large number of ticks (individual prints) into clear, aggregated market orders. If you prefer a more detailed view, you can disable this aggregation to see all individual prints:
- analyze exchange activity under a ‘microscope’;
- filter individual prints within a specified range to identify large executed limit orders.
Detecting abnormal activity
Buys above Best Ask and sells Best Bid can provide valuable insights for your strategy:
- easily identify trades with abnormal activity using a color-coded marker;
- quickly respond to shifts in market sentiment.