
Tick volume is one of the volume indicators that provides a deep understanding of market dynamics, giving a competitive advantage in the market.
This article delves into the nuances of using tick volume and tick charts within the ATAS platform.
Read more:
What Are Tick Volumes in Forex?
This question typically arises among beginner traders who are getting acquainted with the currency markets using the popular MetaTrader 4 terminal.
Below is a screenshot of hourly charts from the MetaTrader 4 terminal (EUR/USD market, data provided by the broker) and the ATAS platform (6E futures market, data from the CME exchange).
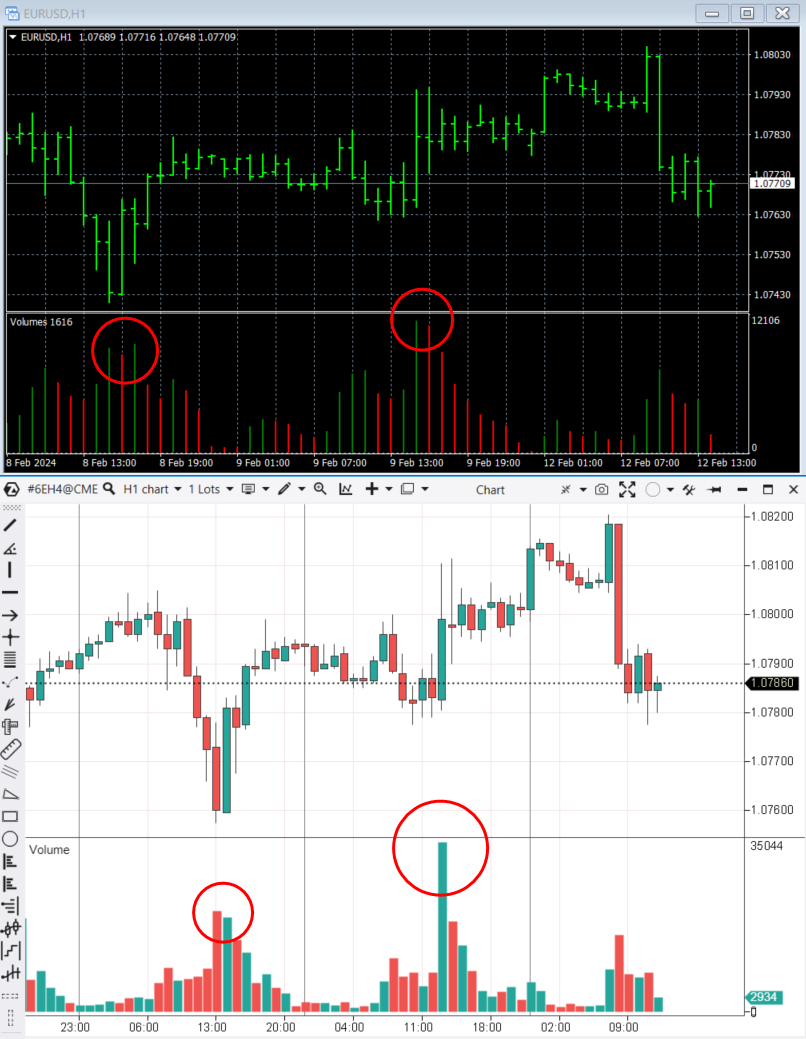
Forex brokers provide what are known as tick volumes to the platforms they support, including MT4 (top chart). Put simply, they count the number of price changes within a time unit.
Real volumes (bottom chart), on the other hand, represent the number of traded contracts involving real money.
While tick volumes and real volumes are related, they have only a minor similarity. Upon closer examination, the difference between them becomes apparent (marked with circles on the charts).
Cons of tick volume in the standard forex terminal:
- It is not reliable. Tick volumes can vary between different brokers. This is especially true for the forex market which is decentralized by nature. There is no single terminal from which volume data is sourced, leading to potential discrepancies and data manipulation.
- It is not that valuable. Tick volumes do not provide insight into the actual trading volume, measured in terms of shares or futures contracts. It carries less value for analysis and do not accurately indicate the strength/weakness of the market and the current sentiments of traders.
Nevertheless, tick volumes do offer a slight advantage in Forex – they enable traders to make simple judgments about market activity. However, you need actual trading volumes provided by the exchange for more accurate volume analysis.
Tick Volume Indicator in the ATAS Platform
The volume indicator in the ATAS platform has 4 modes:
- Volume – the standard representation of volumes, indicating the number of assets traded (such as futures contracts) per time unit.
- Tick – the number of trades per time unit.
- Ask – the number of assets (contracts) bought, i.e. the volume of market buys.
- Bid – the number of trades executed at the bid price, i.e. the volume of market sells of exchange assets (contracts).
The difference between the first two modes is visible in the screenshot below. This is a Euro futures contract and an independent time chart of the Volume (1000) type, where each new candle opens when 1000 contracts are traded in the market.
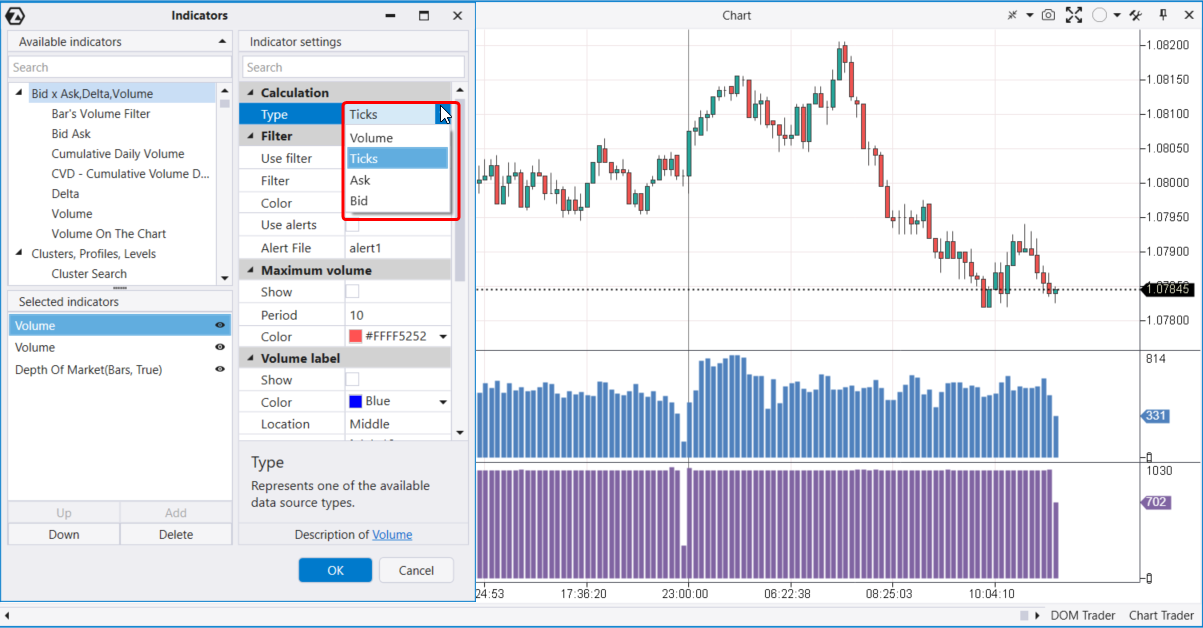
Two volume indicators in different modes have been added to the indicator section:
- a purple one, at the bottom – the actual ATAS volume that shows the number of trades in one candle. Here, the volumes look neatly aligned. Their values fluctuate around ≈ 1000, reflecting the core aspect of the Volume chart.
- a blue one, at the top – the ATAS tick volume that shows the number of trades in one candle. Here, the bars fluctuate on the histogram and show varying actual volumes of executed trades.
What Is a Tick Chart?
Let’s switch the same chart from the Volume (1000) type to the Tick (1000) type.
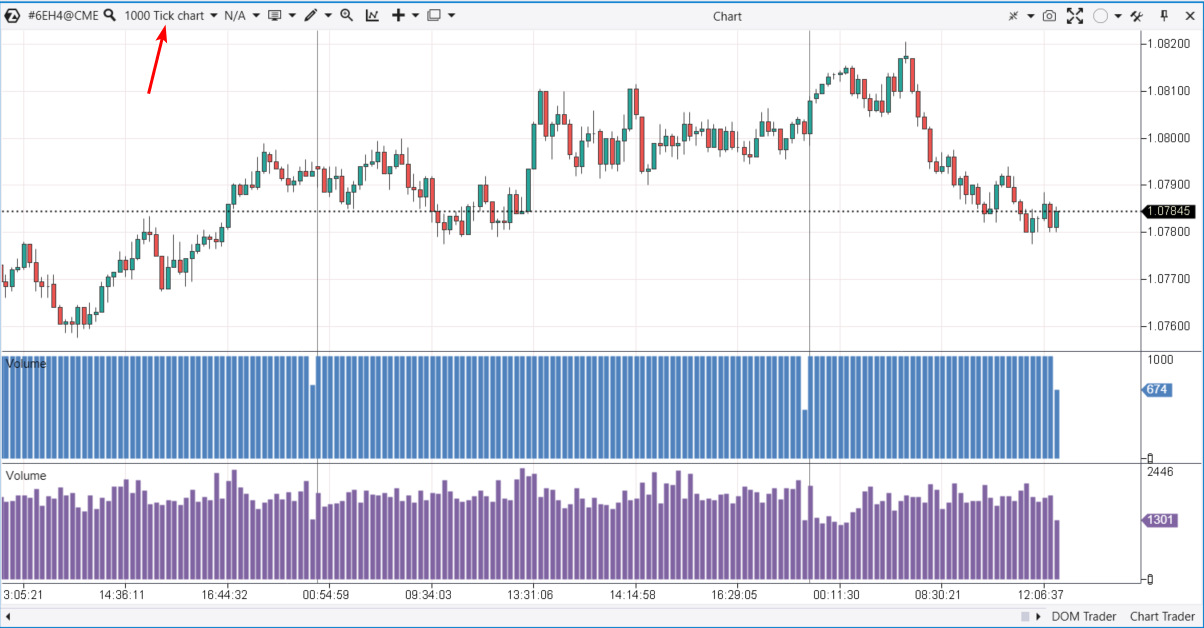
As you can see, the situation has changed. Now:
- a purple one, at the bottom – the actual ATAS volume that fluctuates.
- a blue one, at the top – the ATAS tick volume that appears more aligned. Each new candle opens after 1000 trades have been executed in the market.
The main advantage of time-independent charts (Tick Chart and Volume Chart) is that they enable you to view the chart from a different perspective. You can pay less attention to areas with low volatility (such as the Asian session) and focus more on areas with high volatility (such as the American session). Additionally, a tick chart enhances visualization and simplifies the construction of technical analysis chart patterns.
FAQ
What are tick volumes in Forex?
Tick volume represents the quantitative price change within a time frame unit. One tick is equal to one price fluctuation. This is how the tick volume indicator operates in MetaTrader 4, a widely used trading terminal for forex trading.
What is a tick in the ATAS platform?
In the ATAS platform, a tick can represent:
- One trade. Hence, the Tick Chart (1000) – a chart where one candle corresponds to 1000 trades. The price does not necessarily have to change. If there are 3 trades made at the same price, there will be 3 ticks.
- The minimum possible change in the instrument’s price, i.e. the increment on the price scale. For example, in the oil market, 1 tick is equal to 1 cent per barrel.
How to add the tick volume indicator to the chart?
- Download ATAS, install, and launch the platform.
- Open the chart of the desired instrument (click the ‘Chart’ button in the main window) and press Ctrl+I to open the indicator manager (you can also click the corresponding icon in the top panel of the chart or use the context menu).
- In the indicator manager, select ‘Volumes’ (the indicator for vertical volumes). In the indicator settings, choose the ‘Tick’ mode, then click ‘Add’, and OK.
In the ATAS platform, the indicator will display the number of trades within one candle.
What is the difference between real and tick volumes?
Real volumes represent the actual number of traded exchange assets: futures contracts, stocks, coins in the cryptocurrency market.
Tick volumes, on the other hand, can be defined as:
- either the number of price changes within a candle as shown in the Metatrader 4 terminal;
- or the number of trades within a candle as displayed by the Volume indicator in Tick mode in the ATAS platform.
Can I use tick volumes in forex trading?
Yes, if they help you trade profitably. However, to increase analysis accuracy and trading efficiency, consider incorporating exchange data on real volumes, as well as using professional indicators provided by the ATAS platform and designed to work with them.
Useful Links
You can find more practical information about tick volumes and volume analysis indicators in trading at the following links:
How to Analyze Volumes on the Stock Exchange
To analyze volumes on the stock exchange, you will need quality software, theoretical knowledge, and practical skills. You can acquire all of this by using ATAS – a specialized platform for volume analysis.
Get acquainted with the theory. In the ATAS blog, the built-in Learn section within the platform, on the YouTube channel, and in the Knowledge Base, you will discover examples of exchange volume analysis, strategy-building insights, indicator applications, and other valuable information. Additionally, platform users can count on responsive support from ATAS.
Develop practical skills with Market Replay – a built-in simulator for traders. Learn to interpret tick volume and other indicators on historical data without risk, as if trading were happening in real time. And all this without risking your real capital.
Use professional tools from ATAS. Try combining vertical volumes (regular Volumes, tick volumes, Bid Ask, Delta) with other indicators to gain a more comprehensive understanding of the market. Experiment with:
- the footprint (or cluster charts);
- the Cluster Search, Big Trades, Speed of Tape, Stacked Imbalances indicators;
- the Smart Tape;
- the tools for working with the order book like Smart DOM, DOM levels.
Tips for Beginners
- Pay attention to volume spikes. High volume levels may indicate interest from large players, while low volumes may signal a lack of buyers or sellers.
- Compare effort and results. If the price fails to rise (no result) despite buyer activity (effort), this could be an important bearish signal.
Conclusions
Tick volumes are a foundational concept in trading, but misunderstandings and confusion can arise due to the varied meanings of the term ‘tick’ in different contexts. This article aims to prevent such confusion by explaining the nuances of using tick volumes, particularly within the ATAS platform.
Download ATAS, professional software for working with market volumes. It is free. During the trial period, you will get full access to the platform’s tools to experiment with tick and other volumes. Moreover, you can continue using the program for free even after the 14-day trial period is over, whether it is for cryptocurrency trading and/or learning, conducting market analysis.
Do not miss the next article on our blog. Subscribe to our YouTube channel, follow us on Facebook, Instagram, Telegram, or X, where we publish the latest ATAS news.
Information in this article cannot be perceived as a call for investing or buying/selling of any asset on the exchange. All situations, discussed in the article, are provided with the purpose of getting acquainted with the functionality and advantages of the ATAS platform.


