
Wave analysis of the market is founded on the concept that price movements follow certain patterns or “waves”. In trading, such analysis is often associated with Elliott Wave Theory, but it can encompass other approaches and techniques, including David Weiss’s wave and volume analysis.
Read more:
Types of Wave Analysis of the Market
Elliott Wave Theory, created by Ralph Nelson Elliott in the 1930s, is the most well-known theory of wave analysis in trading. It is based on the assumption that market prices evolve in repeating cycles that reflect the collective psychological state of market participants.
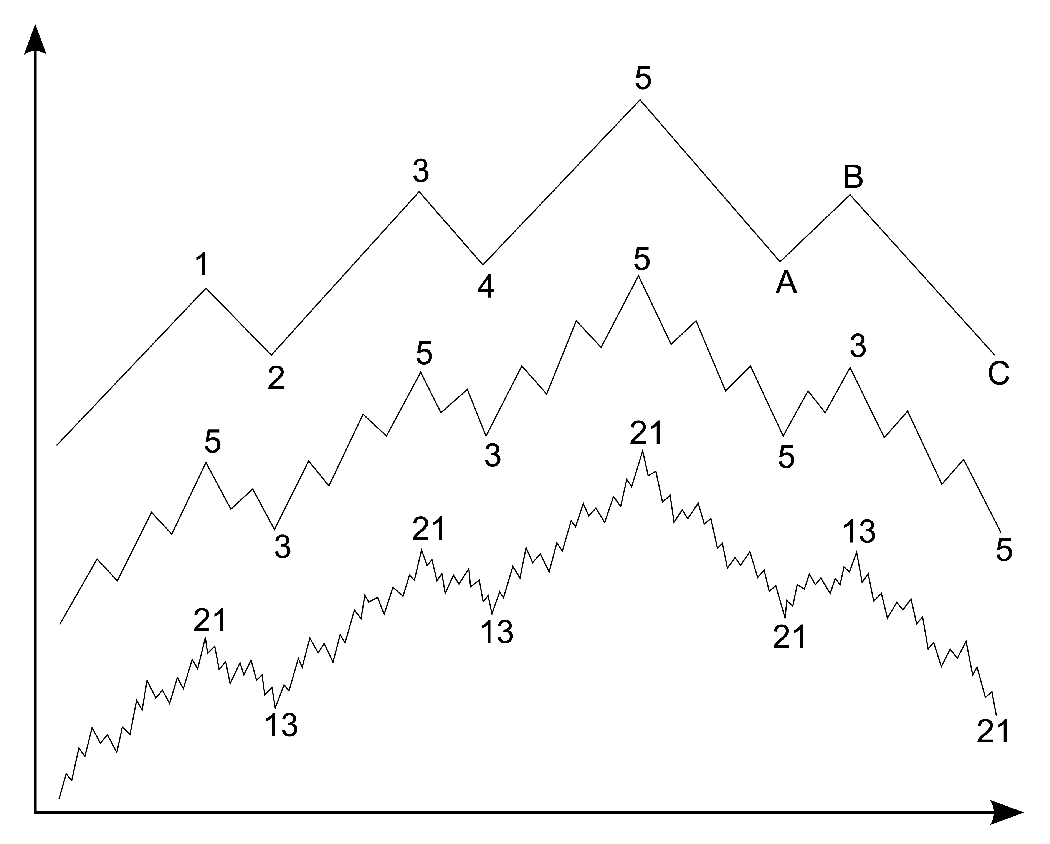
According to the theory, price movements in financial markets form patterns known as “waves,” which adhere to a specific structure. Five waves in the direction of the main trend (impulse waves 1-2-3-4-5) and three corrective waves (A-B-C) together form an eight-wave cycle. This wave structure aligns with the concept of fractality (self-similarity) and Fibonacci ratios, common features in various wave analysis methodologies.
Wolfe Waves – this market analysis method is based on identifying specific geometric formations on the price chart. Traders search for patterns consisting of five wave sequences, which reflect the natural rhythm of market prices and forecast future price equilibrium.
Kondratiev Waves (or K-Waves) focus on long-term economic cycles identified by Nikolai Kondratiev. They are more commonly used in economic analysis than in everyday trading. However, some traders use these cycles to understand broader market trends.
Weis Waves – a modification of traditional wave analysis developed by David Weis, a renowned expert in Richard Wyckoff’s trading method. The main goal of the method is to simplify the process of understanding market trends and trading volumes by combining them into logical wave movements. This helps to better understand the true intentions of the market and the actions of major players.
Let’s delve into the basics of wave analysis according to the Weis method using the tools available on the ATAS platform.
Wave and Volume Analysis Using the Weis Method
Weis Waves focuses on trading volume and price movements, combining them to visually illustrate how volume is distributed throughout price fluctuations. Wave analysis of the market according to the Weis method does not consider each price move separately. It combines price movements into waves until there is a shift in direction, then it compares the overall trading volume with these aggregated movements.
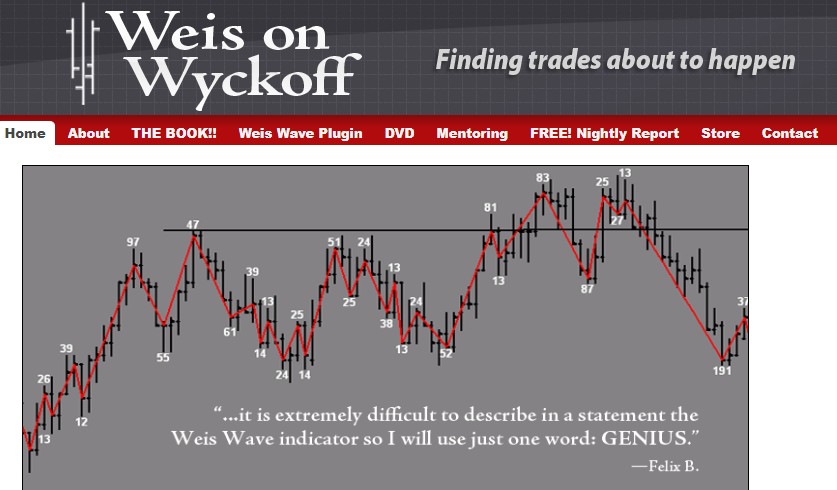
Above is a chart from David Weiss’s website, showing:
- price bars in black color;
- a red line indicating waves. All up bars are summed up into ascending waves, while all down bars are summed up into descending waves;
- white numbers displaying the total volume on the bars within each wave.
The basics of wave analysis according to the Weis method involve examining upward and downward waves taking into account trading volume. For example:
- if an upward wave has cumulatively high volume, it may indicate strong buying interest and the potential continuation of an uptrend;
- if a corrective wave has low volume amid a bullish market, it might indicate the potential for the uptrend to resume.
Thus, by analyzing changes in volume and the direction of waves, traders can forecast future price movements, considering the volume ratios of waves. This allows for more informed trading decisions.
Wave Analysis. Examples on the Chart
Here are examples of wave analysis. To get charts like these:
- download ATAS, install, and launch the platform;
- open a chart using the tool manager;
- switch the chart to a non-standard timeframe mode, we recommend using RangeXV, as it provides a clearer view of wave structure and is not distorted by varying trading activity throughout the day;
- add the WeisWave wave analysis indicator. In ATAS, it appears as a histogram below the price area. While bullish candles appear on the chart, the indicator sums their volumes (following the cumulative principle) into a green histogram. It works the same for bearish candles.
Example. Wave analysis of the dollar
Let’s conduct an analysis of the futures market on the dollar index using the Wyckoff method. Open the chart using “DX” – the ticker for the dollar index futures.
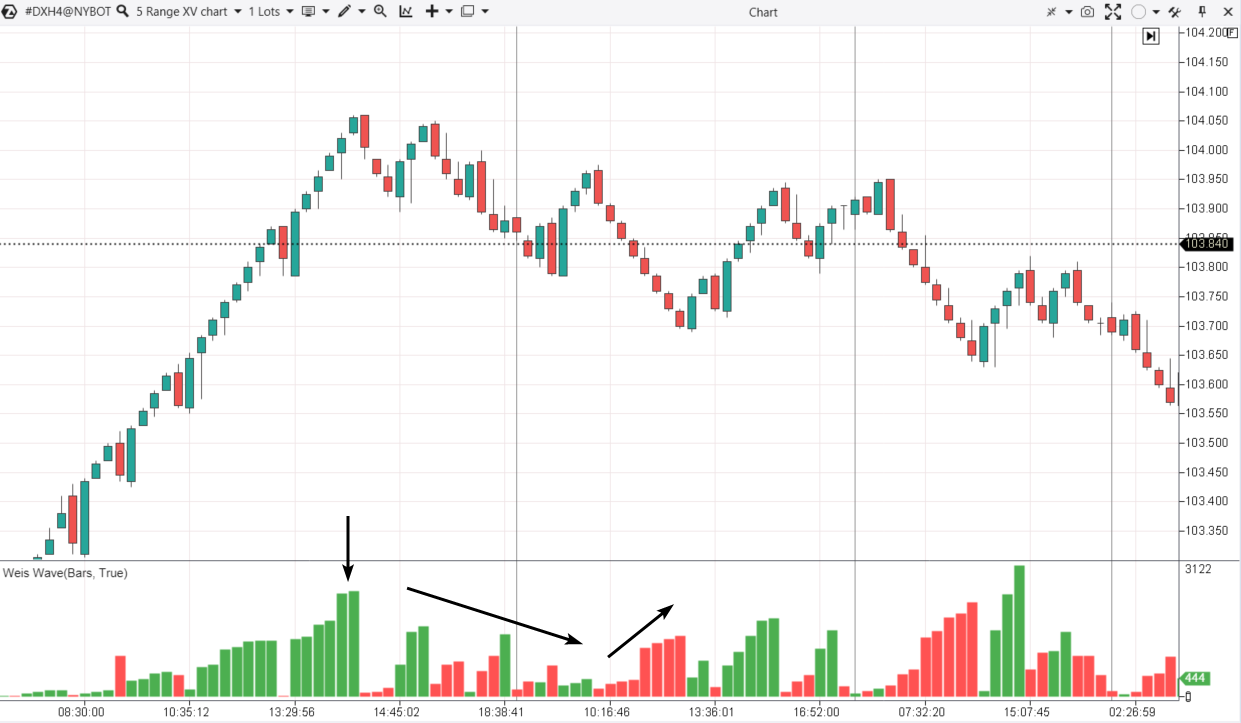
How to analyze Weis waves?
In this case, the analyst’s subjective reasoning might look like this:
- The first arrow indicates a sharp volume spike, which might be a culmination of an uptrend surpassing the 104.00 psychological level.
- The second arrow suggests that volumes on the uptrend waves are gradually decreasing. Despite weak activity during the Asian session, this could signal a demand exhaustion.
- The third arrow highlights a volume spike on the downtrend wave. Perhaps, sellers are attempting to seize initiative amid diminishing demand. This implies resistance at the 104 level.
This is how a trader decides whether it is worth to short-sell. They focus on local bearish reversals, resistance tests, and/or breakthroughs of minor supports.
Example. Wave analysis of USD/JPY
Another example is wave analysis of the futures market for the Japanese yen. To open it in the instrument manager, enter the 6J ticker.
Below is a chart where the Scale parameter is set to 5, giving us a wider view that includes February 2024 and the beginning of March.
The ZigZag Pro indicator has also been added to the chart. It provides statistics (volume, time, price) for each line (which is a wave). While not a classic wave analysis indicator, ZigZag Pro helps assess waves using the Weis method, capturing broader price movements on the chart.
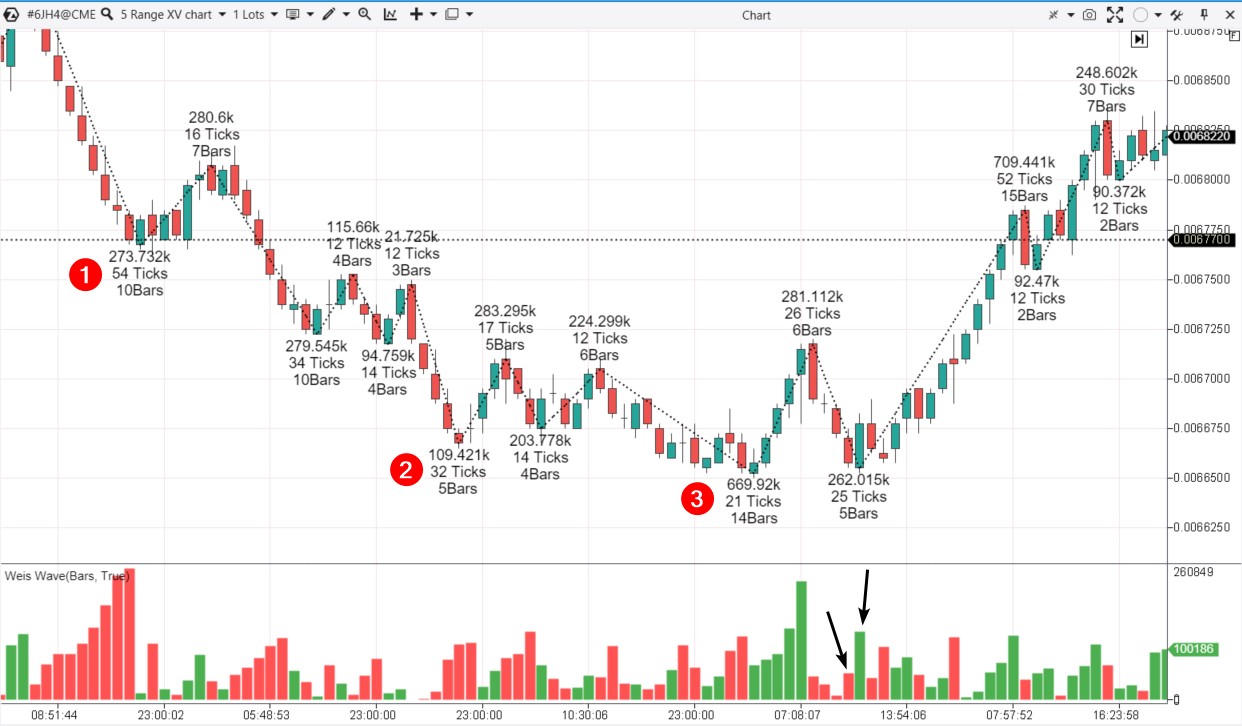
Wave analysis helps traders track the chronology of a bullish reversal.
Number 1 – a downtrend wave. The volume of 273,000 contracts has dropped the price by 54 ticks.
Number 2 – a downtrend wave. The volume of 109,000 contracts has dropped the price by 32 ticks.
Between them, there is another downtrend wave, with 279,000 contracts and a decrease of 34 ticks – it fits the proportions of the downtrend. While the wave number 3 does not. The indicator shows a large volume of 669,000 contracts and only a 21-tick decrease. Which means that the bearish pressure has exhausted.
Next, we observe a sudden influx of buyers – indicated by the highest green bar on the Weis Wave indicator. The price responds swiftly, moving up by 26 ticks.
It is followed by a minor wave of selling (indicated by the first black arrow) and another surge in buyer activity (shown by the second black arrow).
Considering the price and volume movements on the waves depicted using the ZigZag Pro indicator, a trader has enough evidence (selling exhaustion and increased buying activity) suggesting a potential increase in contract prices.
Example. Wave analysis of cryptocurrencies
Let’s conduct a wave analysis of the Bitcoin market. We will use data from the Bitfinex exchange as it loads faster. We will keep the RangeXV mode and set the Scale parameter to 100 to analyze the waves within the day.
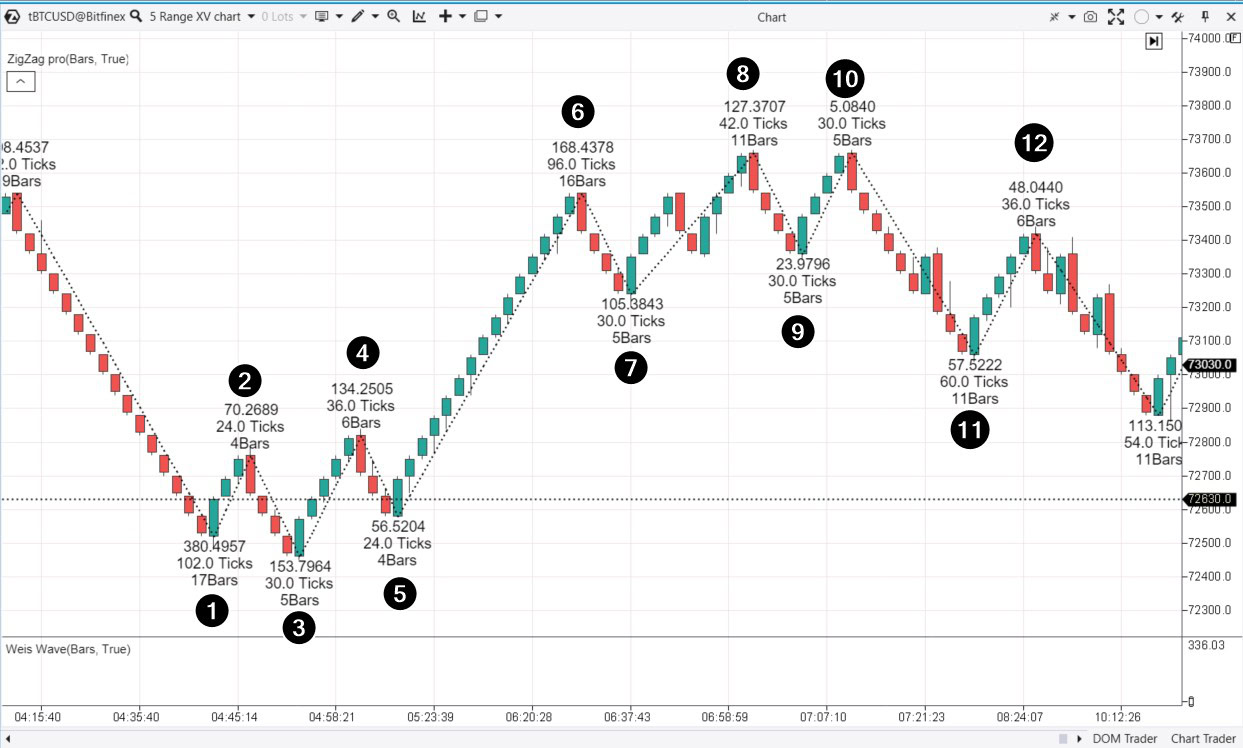
01. A downward wave. Significant volume, substantial progress (in ticks and duration of the wave). Sellers are dominating the market.
02. An upward wave. Ascending correction.
03. A downward wave. Volume and progress have decreased. Has selling pressure been exhausted?
04. An upward wave. There is confirmation of a shift in sentiment, as buying pressure has increased, which is noticeable both in the volume increase (compared to wave 02) and in progress.
05. A downward wave. Once again, both volume and progress are decreasing compared to previous waves. This decline appears to be a downward correction following the upward impulse from 03 to 04. Resuming the impulse after the correction signals an entry point at the beginning of the trend. In this case, it is the start of the upward wave 06.
06. An upward wave. Significant volume, substantial progress (in ticks and duration of the wave). Now the buyers have taken the lead.
07. A downward wave. Significant volume is observed. Sellers seem to be more active, although the progress is minor, and the wave appears to be a correction after the upward impulse.
08. An upward wave. It has an interim correction marked by 2 red candles. The decrease in volume and progress should raise concerns. Especially following the evidence of seller activity on wave 06→07.
09. A downward wave. It significantly (by 30 ticks) offsets the achievements of buyers on the previous wave (by 42 ticks).
10. An upward wave. Volume and progress suggest a weakening demand.
11. Downward wave, signaling that sellers have seized the initiative.
12. An upward wave. It looks like a 50% bullish correction from the bearish impulse 10→11. Similar to the reversal at point 5, the resumption of the impulse after the correction signals an entry at the beginning of the trend. In this case, it is the start of the downward wave.
The wave analysis provided above covers the events of March 14, 2024.
More information about this wave analysis method can be found in the following articles:
Wave Analysis in Trading. Pros and Cons
Pros of wave analysis:
- Comprehensive approach. Wave analysis considers market cycles, participant psychology, self-similarity principles, Fibonacci ratios, and other key concepts.
- Identification of Entry and Exit Points. Wave patterns help identify potential market reversal points and make timely decisions: whether to enter a position or close it.
- Applicability across different time frames. Wave analysis can be applied across various time frames, making it useful for both long-term investors and day traders.
- Compatibility. This method can be combined with volume analysis and other trading approaches to increase overall effectiveness.
Cons of wave analysis:
- Subjectivity. Analysts may interpret wave structures differently, leading to varying forecasts and trading decisions.
- Complexity. Wave analysis requires a lot of time and practice to master. Beginner traders often struggle to correctly identify and apply wave patterns, especially in markets experiencing consolidation phases.
- Uncertainty. Even experienced analysts encounter uncertainty when using wave analysis, as the market does not always follow expected patterns. External events, like news or shifts in economic policy, can also unpredictably influence the market and disrupt wave patterns.
FAQ on Wave Analysis
How to identify waves on a chart?
If we consider Elliott waves, chart labeling begins with identifying the larger trend and subsequently tracking the wave patterns of impulses 1-2-3-4-5 and corrections A-B-C. It is crucial to follow proportions and rules, such as (for an uptrend):
- Wave 2 should never go below the start of wave 1.
- Wave 3 cannot be the shortest of the three impulse waves (1, 3, 5).
- Wave 4 should not overlap with the price territory of wave 1.
For a simpler breakdown of price movements into waves, you can use indicators like ZigZag, Weis Wave, or others.
Which financial markets can wave analysis be applied to?
To all of them. Wave analysis is applicable across various financial markets, including stocks, commodities, currencies, cryptocurrencies, and stock indices. The effectiveness of the analysis may vary depending on the market, timeframe, and adherence to market conditions, but most importantly, it depends on the analyst’s expertise.
How to combine wave analysis with other trading tools?
Wave analysis of the market integrates smoothly with other approaches of technical analysis, such as support and resistance levels, trend indicators, and volume analysis. Related approaches help confirm wave patterns and increase the likelihood of successful trading operations.
What to read about wave analysis?
- The Elliott Wave Principle: Key to Market Behavior by Robert R. Prechter Jr. and A.J. Frost. This classic guide on Elliott wave analysis is a must-read for anyone interested in the topic.
- Nature’s Law: The Secret of the Universe by R.N. Elliott. This foundational work was written by the founder of the theory, Ralph Nelson Elliott himself. In this original work, he lays out his wave theory.
- Trading Chaos: Maximize Profits with Proven Technical Techniques by Bill Williams. In this book, Williams introduces the concept of “Trading Chaos,” which includes the use of fractals, market energy, and other aspects to understand and predict market behavior. While not solely focused on wave analysis, the author developed his own theory of market waves, which complements and expands Elliott’s ideas.
- Trades About to Happen: A Modern Adaptation of the Wyckoff Method by David H. Weis. While Weis’s book only partially focuses on wave analysis, with its primary emphasis on the Wyckoff method, it contains valuable information for understanding market structures and the interaction of price and volume, which is also important when using wave analysis.
How to Start Trading Using Wave Analysis
Step 1. Learn the basics of wave analysis
Start with the fundamental aspects of this theory: learn about the types of waves, formations, and labeling rules. Read books and articles, watch educational videos to understand how to apply wave analysis in trading.
Step 2. Historical data analysis
Start with the market you are interested in (stocks, futures, cryptocurrencies). Use historical charts to learn how to identify wave patterns and structures.
Study the behavior of price and volume during important breakouts and reversals. Find patterns and develop your unique trading plan.
Step 3. Practice Using a Simulator for Traders
Use the Market Replay simulator. Practice wave analysis and trading to develop skills without risking any money.
Evaluate your performance. Analyze your trades to understand what strategies are effective and which ones are not.
Step 4. Applying Additional Indicators
Choose complementary indicators. Incorporate additional tools into your analysis, such as market profiles, footprint charts, DOM Levels indicator, and other advanced developments.
Learn to use volume analysis tools together with wave analysis to create well-founded trading strategies.
Step 5. Trading on a Demo Account
Practice trading on a demo account to test your strategies in real market conditions without any risk. Stick to your trading strategy, keep risk management in mind, and develop discipline.
Conclusions
One crucial aspect of wave analysis is its subjectivity. This makes wave analysis in trading both powerful and potentially vulnerable. Despite the subjective nature of this method, its effectiveness can be significantly enhanced by using professional volume analysis indicators, footprint charts, and the DOM.
The ATAS platform:
- provides you with a powerful toolkit for comprehensive analysis of futures, stocks, and cryptocurrency markets. The range of available tools expands with each platform update.
- enables you to load tick data history from futures, stocks, and cryptocurrency markets, providing you with a comprehensive foundation for studying patterns of wave analysis;
- offers many other benefits for traders who integrate advanced cluster charts, useful indicators, and the fundamentals of wave analysis into their trading approach.
Use waves together with other analytical tools to make informed trading decisions.
Download ATAS. It is free. During the trial period, you will have full access to the platform’s tools. Moreover, you can continue using the program for free even after the 14-day trial period is over, whether it is for cryptocurrency trading or volume and wave analysis.
Do not miss the next article on our blog. Subscribe to our YouTube channel, follow us on Facebook, Instagram, Telegram or X, where we publish the latest ATAS news.
Share life hacks and seek advice from other traders in the Telegram group @ATAS_Discussions.
Information in this article cannot be perceived as a call for investing or buying/selling of any asset on the exchange. All situations, discussed in the article, are provided with the purpose of getting acquainted with the functionality and advantages of the ATAS platform.


