
To put it simply, a gap is an interval in price on a chart. In English “gap” literally means “an unfilled space” or “interval”.
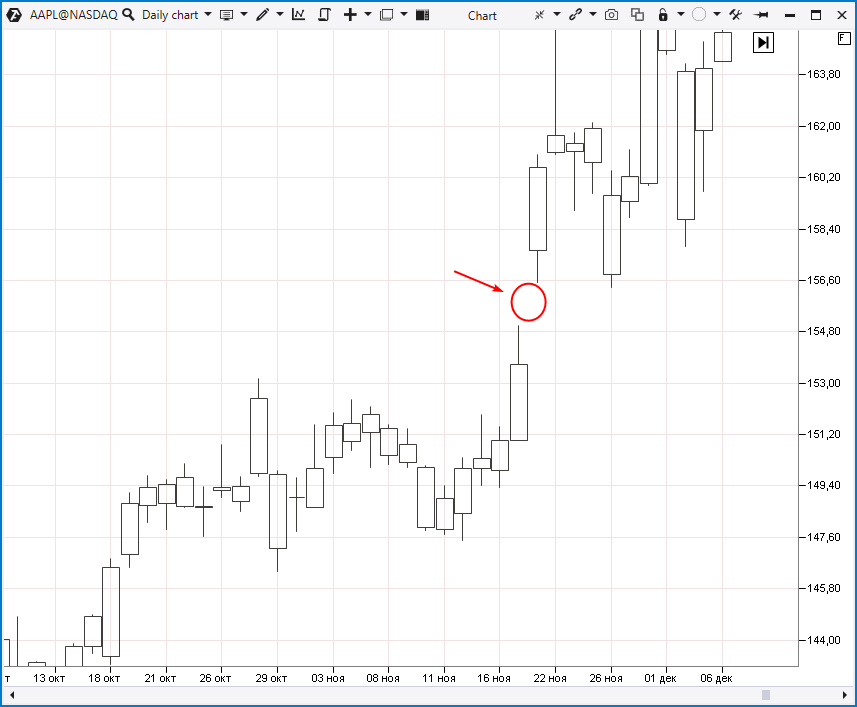
This is how ↑ the gap looks like on the AAPL chart (actually, there are many more gaps, we have highlighted only the most noticeable one for demonstration purposes).
In this article about gaps you will find out:
The article is written in simple words so even beginners will be able to understand it, but it also provides useful information for experienced traders.
What is a gap in trading?
As we have already mentioned, a gap in trading is an interval on the price chart.
A gap-up occurs when the opening price of a new candle is significantly higher than the closing price and the high of the previous candle.
Similarly, a gap-down occurs when the opening price of a new candle is well below the previous candle’s closing price and its low.
Why do gaps occur?
There are two main reasons why gaps occur:
- Stock markets are closed
- An increase in trading activity due to the release of important news.
Let’s take a closer look at both reasons for gap occurrence.
Gaps can occur when stock markets are closed
Each market has its own schedule:
- forex and futures are traded almost 24 hours a day on weekdays, their schedule is close to 24/5;
- cryptocurrencies are traded non-stop, 24/7;
- stock trading, ETFs (what is ETF?) and some other assets are available during the 6-8 hour working day.
When the markets are closed, some events can occur that will affect the price when the exchange opens again. There is an example of a gap on the S&P-500 E-mini futures chart below.
These contracts are traded on the CME Group which introduced the Globex system in 1992 to enable near-24-hour weekday trading.
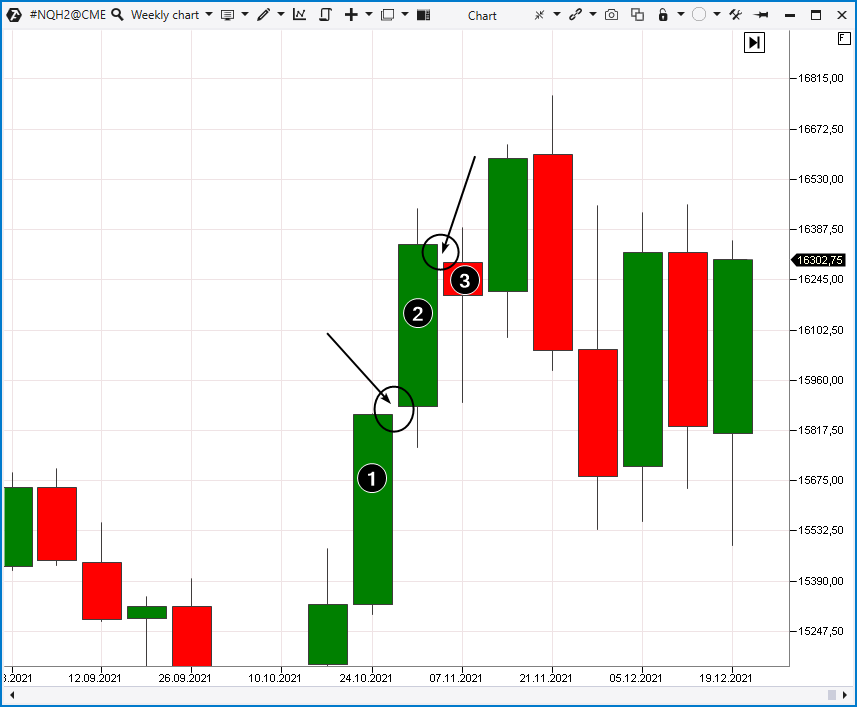
This is a daily period, number 1 indicates a Friday’s candle. Number 2 indicates a Monday’s candle. Friday was optimistic and during the weekend investors’ optimism grew, therefore, a gap formed between candle number 1 and the opening of candle number 2.
After the trading session on Monday, trading was stopped for clearing. At the opening of Tuesday’s candle (number 3) we also see the formation of a significant gap which is not very typical for S&P-500 futures during the week. Small gaps often occur during the week when trading resumes after a short break at night.
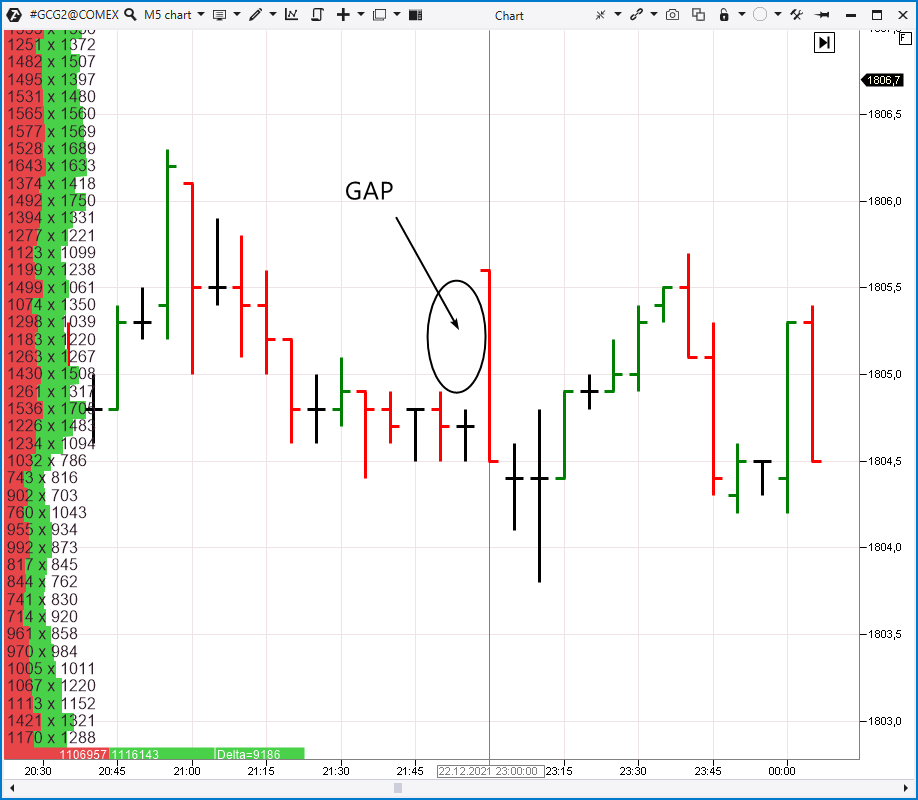
The chart above shows a gap in the gold futures market. It occured when the COMEX exchange suspended trading for 1 hour at night according to its schedule.
Gaps can occur due to increase in trading activity
Trading in financial assets is closely associated with fundamental information, such as:
- decisions of central banks, financial regulators;
- publication of economic statistics;
- politicians’ statements.
As a result, gaps may occur due to a sharp shift in the balance of supply and demand. How does it happen? Read in the following section.
Gap analysis on the chart with Depth of Market indicator
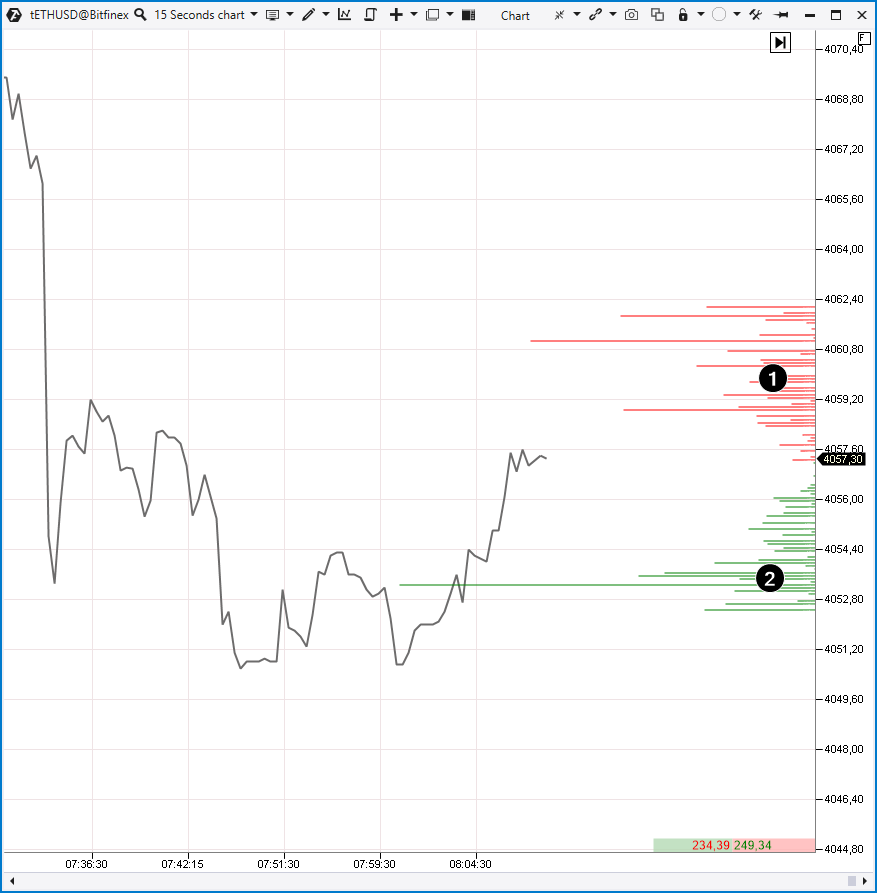
This is ↑ a chart from a cryptocurrency exchange, but this makes no difference, since the process of trading different assets on different exchanges is organized in the same way.
The Depth of Market indicator shows sell limit orders (1) and buy limit orders (2). For example, something happens and in the news it is considered a strong bullish impulse. Therefore, sellers cancel their orders in a hurry. The red bars disappear but the amount of buyers is increasing.
We can see a supply shortage. Buyers quickly execute trades using those offers that are still available.
The dialogue looks like this:
Buyer:Are there any contracts for 100?
Exchange: No. The lowest offer price is 103.
Buyer: I’ll take 100 contracts for 103.
Exchange: There are only 50 contracts for 103. 50 contracts for 103 and 50 contracts for 105 have been sold to you.
As a result, the price jumps up skipping levels. It is like running up the stairs and jumping over the steps.
If you look at the daily timeframe, you will not notice intraday gaps. However, if you choose seconds after the news was released, there will be chances to see gaps.
Tip. If you want to learn more about the exchange trading mechanics, read the following articles:
Specific features of gaps in different markets
Each market has its own characteristics which can lead to gap occurrence.
Futures market. Popular futures are very saturated markets. Some traders speculate, others hedge (what is hedging?). Futures market trading is possible almost 24/7 on centralized exchanges. Gaps in the futures markets usually appear after a short break at night when the number of traders is reduced. You can see an example on the chart above, a gap in the gold futures market.
Cryptocurrency market. The cryptocurrency market operates 24 hours a day, seven days a week, but this does not mean that there are no gaps there. There are two main reasons why gaps occur:
- some exotic instruments have low liquidity. Orders are not posted at all levels due to the small number of buyers and sellers, so the price seems to “jump” on these levels, forming gaps.
- too small price step. For example, on some exchanges the price step for bitcoin is 1 dollar (or a few cents), while the price of bitcoin is tens of thousands of dollars. Therefore, orders in the bitcoin markets and other popular instruments are not placed at all levels, which leads to the occurrence of gaps that can only be seen if you zoom in the price scale very close.
By the way, the ATAS platform has a useful tool that can automatically choose the price step. It is number 1 in the chart below.
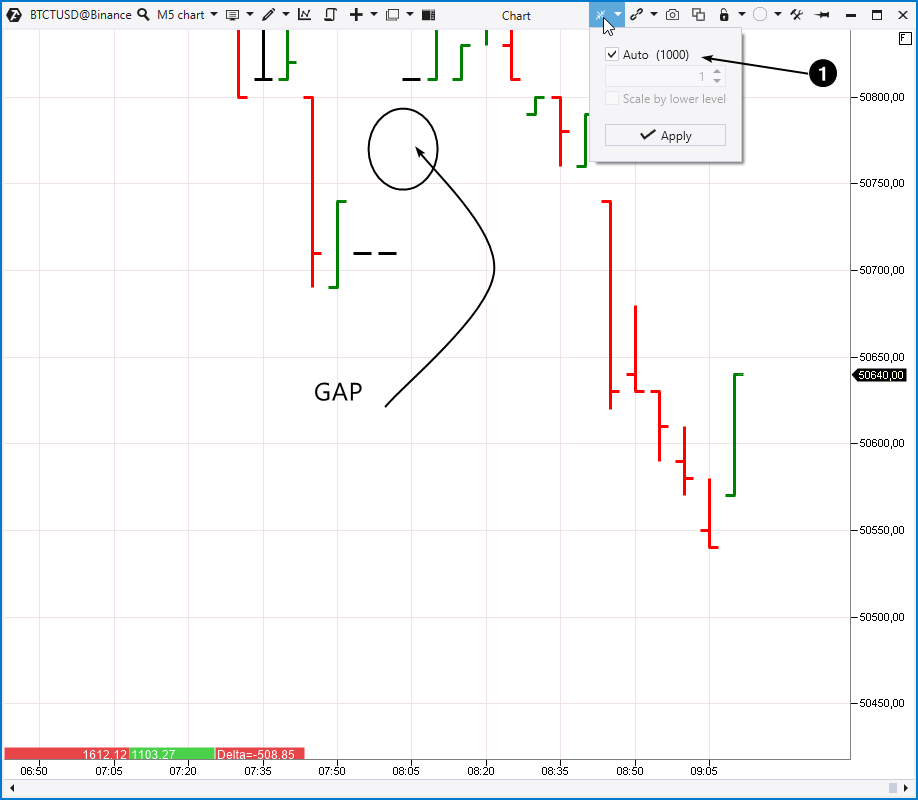
Number 2 shows the gap that occured in the spot market (the data was taken from the Binance exchange) where bitcoins are actually traded. In the derivative futures market, which is much more liquid, there is no such gap.
Stock market. Gaps often occur in the stock market. Usually, there are price gaps between the previous day’s closing and the new day’s opening.
Tom Williams, the founder of VSA strategy, said that major players sometimes use gaps to exploit their premarket advantage and “jump” over a resistance level instead of absorbing massive sell orders near it. We recommend that you read a series of articles about Volume Spread Analysis here.
Dividend gap
As for the stock market, you should pay close attention to the dividend gap. It occurs when the shares fall in price, taking into account the amount of dividends paid.
Gap trading strategies
Here are 3 gap trading strategies:
- a breakaway gap;
- gap closing (filling);
- a gap candlestick pattern.
This is not an exhaustive list, gaps can be used in various strategies.
Breakaway gap
When a stock opens with a gap that breaks the previous day’s resistance, you have a potential buy setup.
You can see an example on the TSLA stock chart.
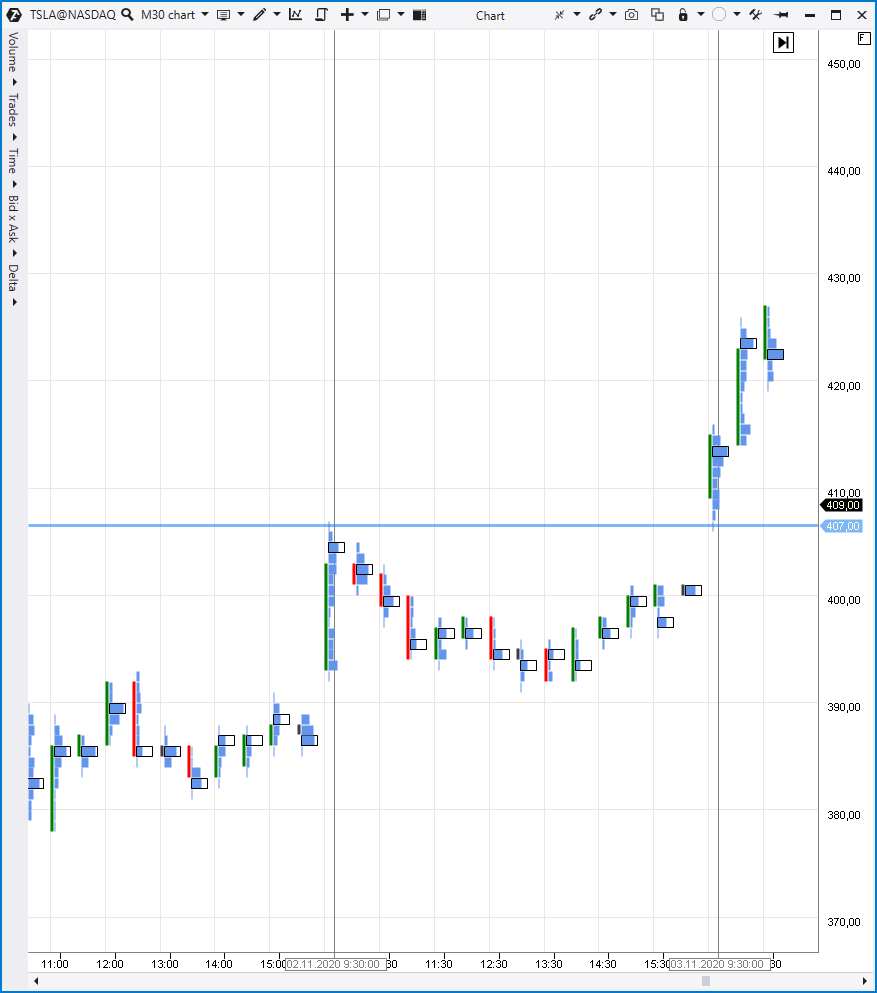
The price seems to have jumped over the 407 level. Perhaps, significant interest is trying to push the stock to higher peaks, and the 407 level gap cuts off the buyers and saves money to overcome the resistance of the sellers.
When you see such a gap, you can switch to short-term time-frames to trade intraday expecting that the uptrend will gain strength.
For example, the 30-second chart shows a simple setup to enter a long position after a gap-up at the opening.
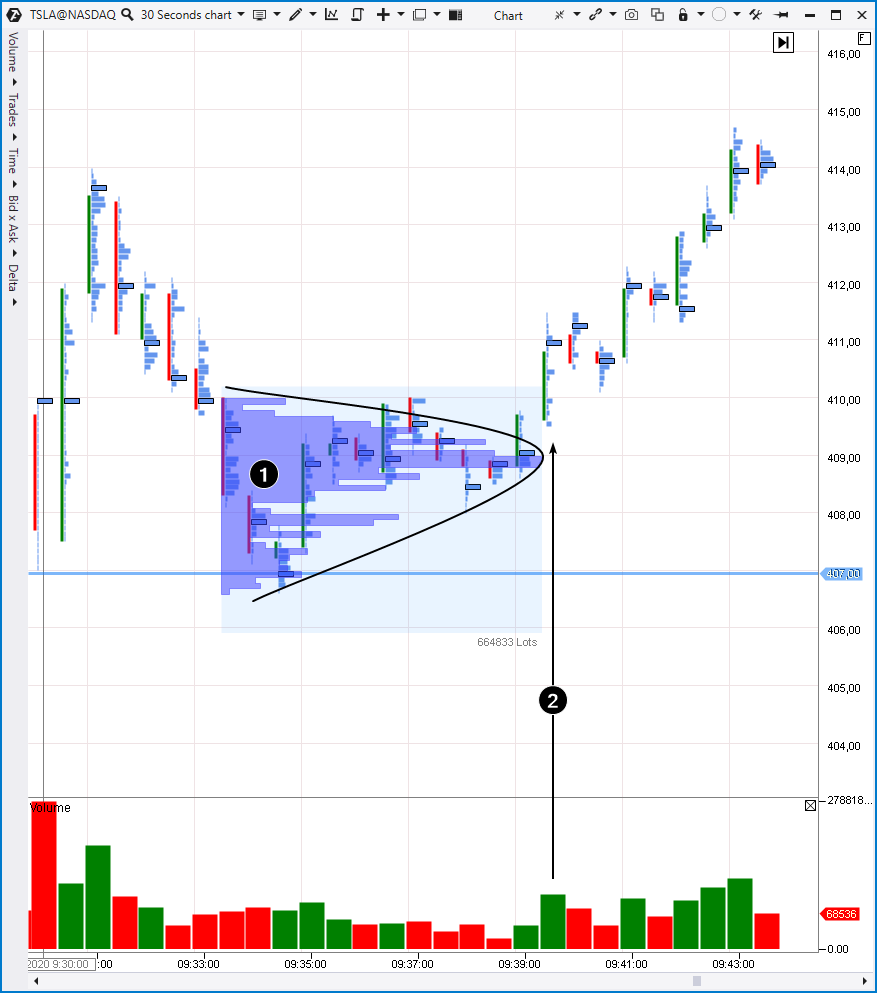
The numbers show:
- a short-term balance after opening with a gap. It was identified with a tool for drawing an arbitrary profile in the ATAS platform.
- the buyers’ effort to break through the short-term balance (a rising price with an increase in volume). If you decide to enter for buying at the closing of this candle, your choice will be justified.
Gap closing (filling)
When a gap has occurred, it is believed that later (but not always) the price will move back to the gap and this is how the gap gets filled.
As a rule, a gap is considered closed (filled) when the price moves back to the original pre-gap level but this is not a strict rule. There are charts like the one below.
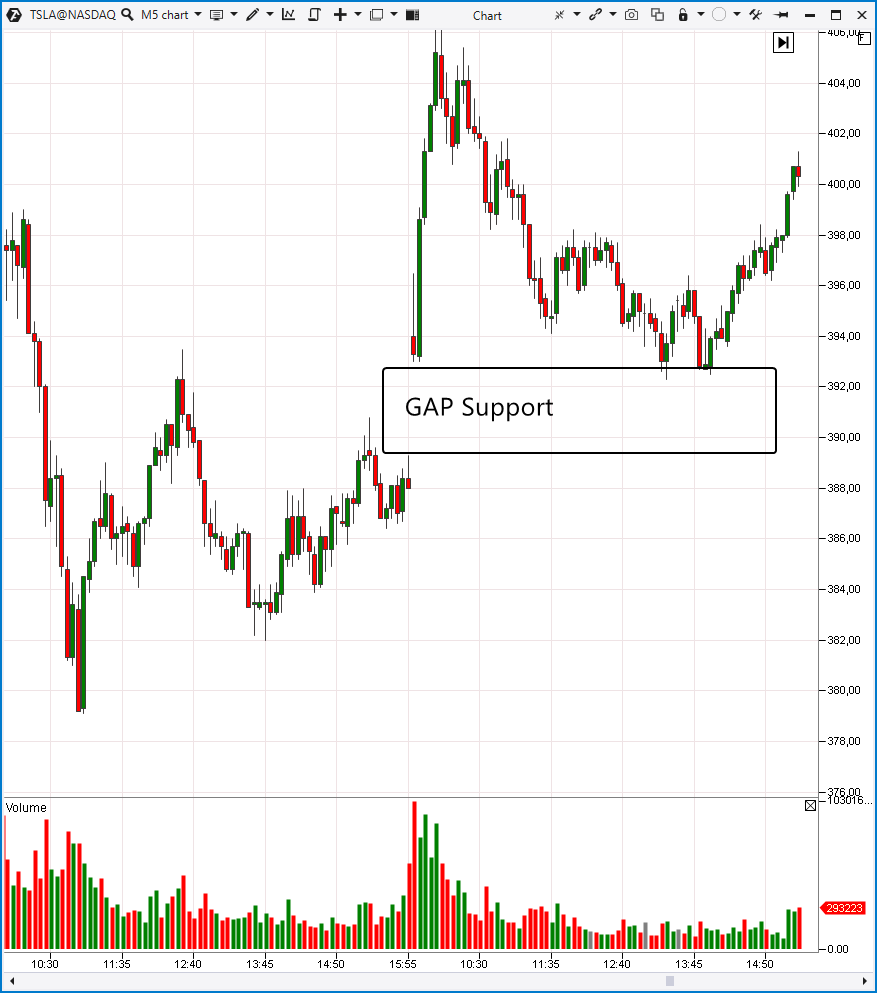
At the opening of trading, the price of TSLA gapped up, later this gap acted as a support zone. Buying from this zone is a kind of trading at the gap closing.
Gap candlestick pattern
There are several articles about candlestick patterns in our blog:
- Candlestick patterns. How to increase accuracy of candlestick patterns
- Searching candles patterns and clusters at m5 chart
- 5 simple and working reversal patterns
In this article we will have a look at the Morning Star candlestick pattern.
An example is on the weekly Tesla stock chart.
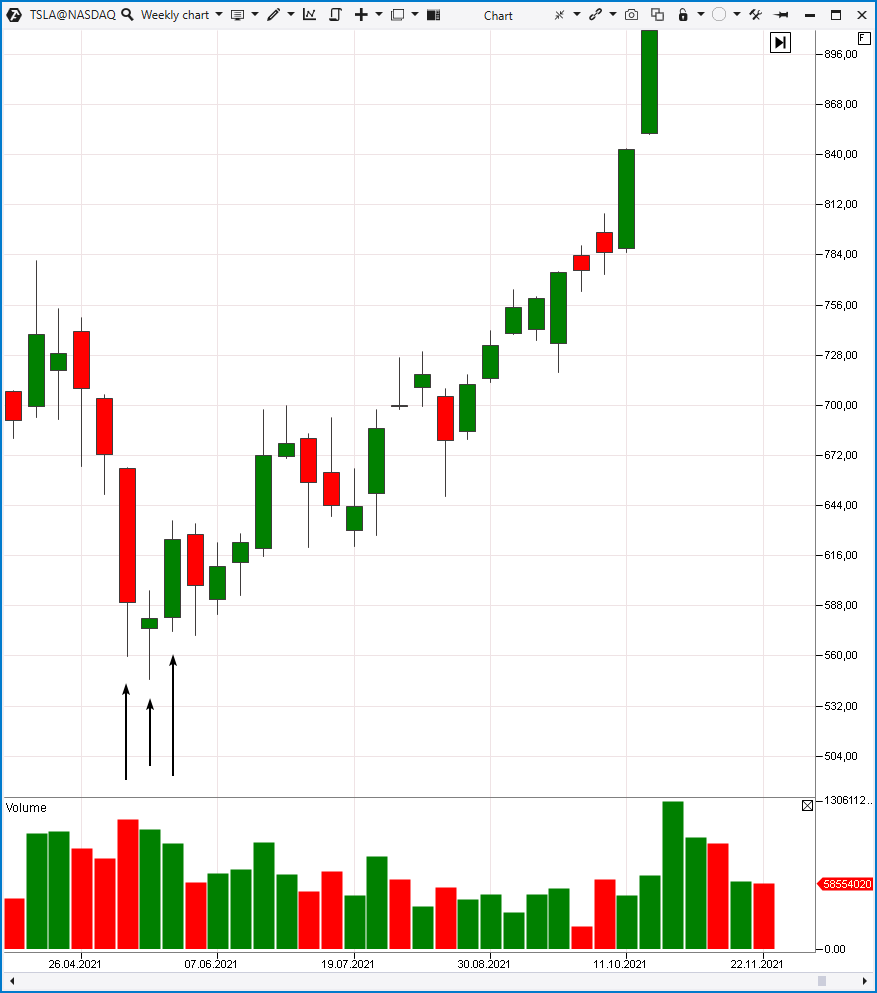
This is a bullish reversal pattern that consists of three candlesticks. According to the rules of this pattern, three candles should be in the following order:
- The first candle shows an intense price drop.
- The second candle should open lower with a gap. The rate of the price drop should decrease.
- The third candle is a wide bullish candle. The opening price should be located above the body of the second candle. Some sources do not require a gap between the bodies of the second and third candles.
It is important that you see a downward trend before the Morning Star candlestick pattern has appeared. The appearance of this pattern indicates a change in the nature of the market. The bearish trend is “crossed out” (for example, by important bullish news), and you can expect price gain.
Analysts from Candlescanner conducted research to monitor the Morning Star pattern on the daily charts of stocks included in the S&P 500 index from 01/07/1995 to 30/06/2015. They discovered 1861 patterns.
Within 10 days after the Morning Star pattern had occurred the stock price decline appeared in 20% of cases, a small price increase appeared in 19% of cases, a modest price increase appeared in 14% of cases, and a major price increase appeared in 47% of cases.
Disadvantages of gap trading
Of course, gaps are not the Holy Grail that can predict market behavior with 100% accuracy.
The disadvantage of gaps is that each gap can be interpreted in its own way:
- A gap that occurs at the beginning of a trend.
- A gap that occurs at the end of a trend.
- A random gap.
To interpret a gap correctly, one must look at the big picture of the market and really understand the context in which the gap occurs and what it is likely to mean. It takes a significant amount of time to develop gap assessment skills.
The second disadvantage is the emotional stress and increased risk. As a rule, gaps mean that trading is going to speed up and traders will have to make decisions quickly, which may be unacceptable for beginners.
Warning. If you want to play the gap, choose candlesticks or bars because other chart types (for example, lines or Renko) will hide gaps.
Gap trading recommendations
Analyze volumes. Gaps can be interpreted in different ways, volumes will help to confirm/refute the move.
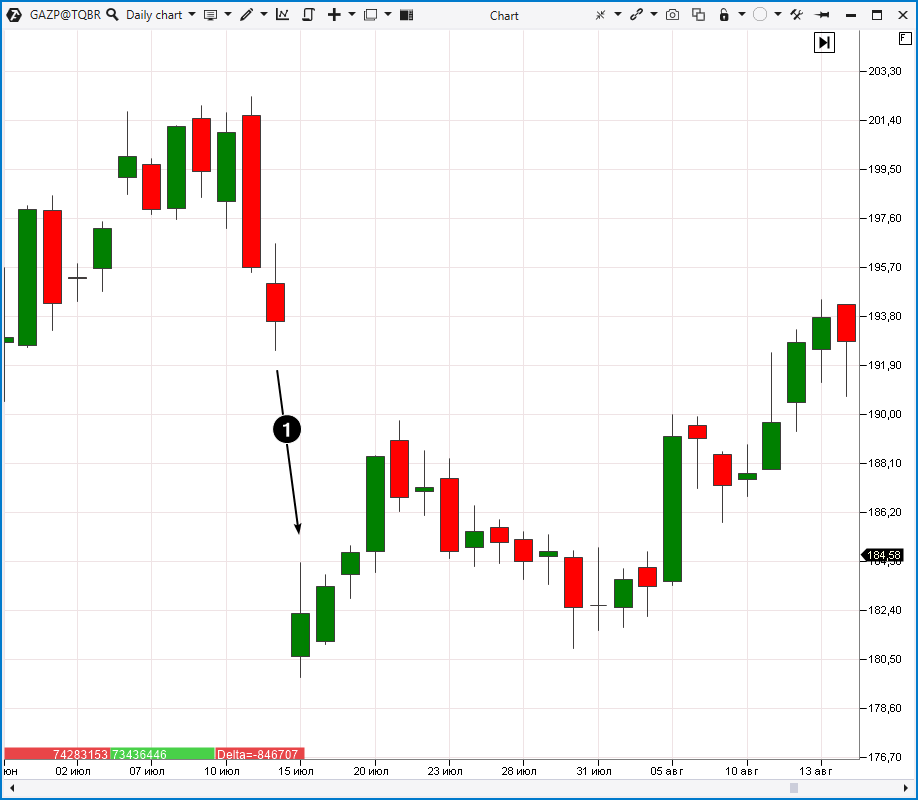
For example, SBER shares opened with a gap-up (1). This means that level (2) can be used as support in intraday trading.
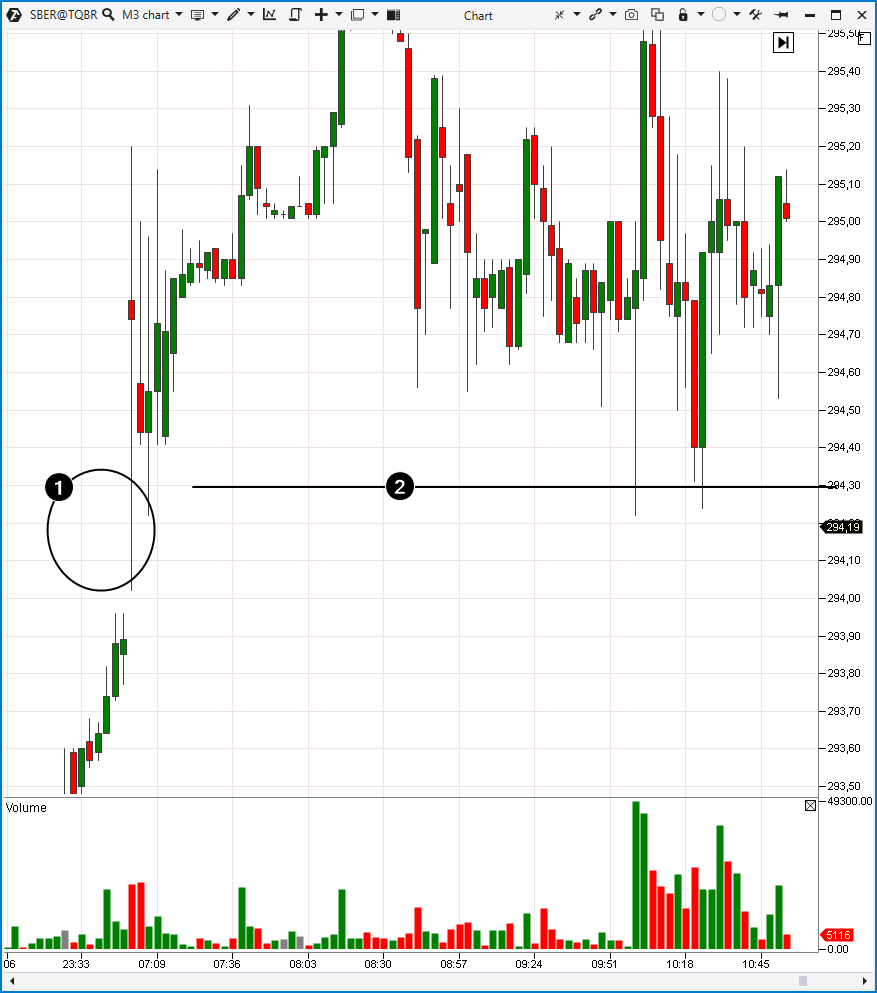
Let’s have a look at the moment when the stock enters the expected support zone provided by the gap-up.
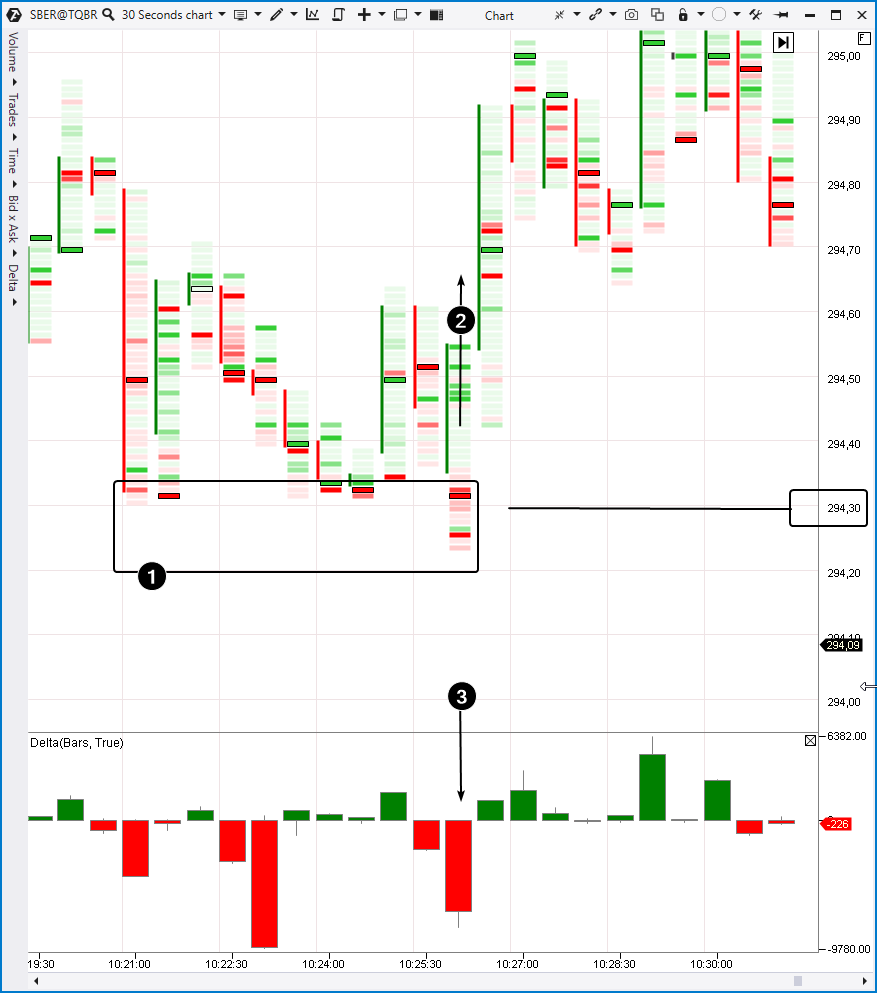
The cluster chart shows that the market was trading around 294.30 (shown in the red clusters). However, the price was not falling down. Moreover, it even increased significantly (2) after a surge in sales (3) on an attempt at a bearish breakout of the 294.30 level.
The upward momentum (2), which appeared after the gap-up opening, gave enough reason to enter a long position.
How to trade like a Pro?
We hope that the information presented in the article was useful for you, and you are interested in applying divergence and cluster analysis for conducting trading operations in financial markets on your own.
Download ATAS. There are four good reasons for that:
- It’s free and you can continue using the program even after the 14-day trial period.
- You will be able to analyze divergences in the stock, futures and crypto markets.
- There is a demo account built into the ATAS platform, so you can practice trading without risking your real capital.
- The platform offers many benefits for traders who want to trade with easy-to-use cluster charts and useful indicators.
Read our blog and subscribe to our YouTube channel.
Conclusions
Gaps are areas where the opening price of a candlestick is far above or below the previous closing price. Gaps usually occur at the opening of the stock market. Therefore, gap trading is perfect for intraday traders who track trends in the stock market.
Do not think that gaps are simple and can make you rich without much time and effort. What will really help you achieve your goals when trading in the financial markets is cluster chart analysis, discipline and self-improvement.
Try to trade on the demo account before you decide to trade gaps and put real money at risk. Download the free version of ATAS right now! Try a powerful cluster chart analysis tool for stock, futures and crypto markets.
Information in this article cannot be perceived as a call for investing or buying/selling of any asset on the exchange. All situations, discussed in the article, are provided with the purpose of getting acquainted with the functionality and advantages of the ATAS platform


