Charts without limits
Unmatched flexibility in chart analysis:
- 400+ cluster chart configurations based on Volume, Delta, Trades, and Bid x Ask data;
- line and candlestick charts in classic or transparent styles.
Analyze charts in real time or use historical data to uncover market dynamics hidden from other traders: trading speed and volume, buyer-seller imbalances, trade concentration, and the activity of major players.
A unique set of time frames
14 customizable time frames with flexible settings and filters:
- standard time frames:
seconds, minutes, hours, weekly, and monthly;
- unique time frames for reducing market noise: Range, Range X, Range XV, Range Z, Range US, Renko, and Reversal;
- volume-based time frames: Order Flow, Cumulative Trades, Volume, Delta, and Tick;
- custom time frames: create unique time frames with any desired period.
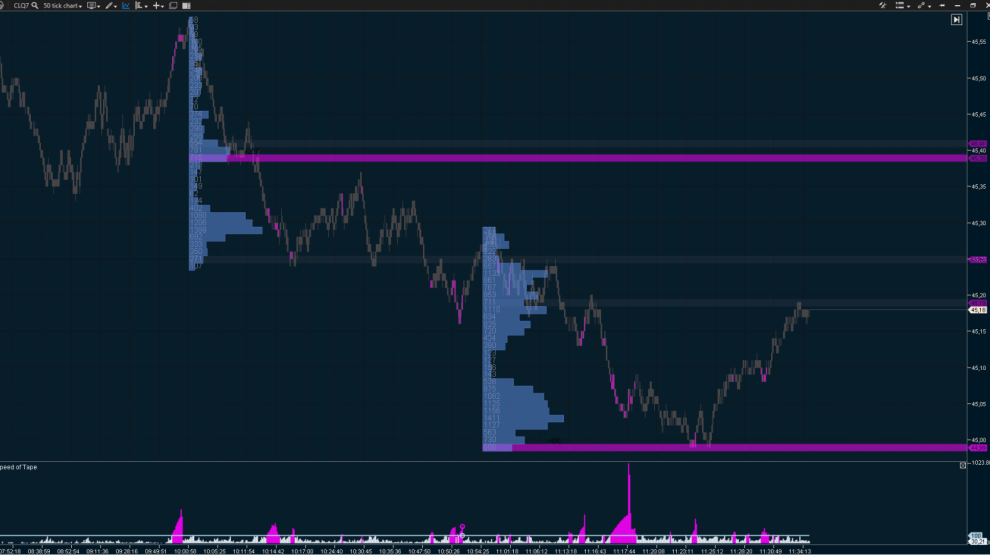
Versatile profile
- Market Profile provides a new perspective on the market. Trends and ranges will help you identify fair value zones, overbought and oversold areas, and key support and resistance levels.
- Market Profile is built on Time Price Opportunity (TPO) analysis. Each TPO block shows when and at what price an asset was traded.
- Volume Profile displays volume distribution across price levels, making it easy to identify high-activity zones and pinpoint key areas of significant shifts in supply-demand balance.
Powerful technical analysis tools
- 20+ lines, channels and other classic drawing objects;
- chart tools for in-depth analysis, such as Anchored VWAP, Dynamic POC, CVD Correlation, Market Profile and TPO, and Long/Short Position;
- global objects enable you to add shapes with a single click and manage them across all charts using the same instrument.
Ready-to-use settings for any tool
Speed up your chart setup with prebuilt or custom templates. Save your favorite configurations and apply them to any tool in just a couple of clicks:
- time frame settings;
- indicator sets with predefined parameters;
- chart designs and color schemes;
- drawing objects.
Maximum customization
Tailor the platform to suit your workflow and display essential data in a clear, user-friendly format:
- chart analysis settings and visual styles for charts, clusters, and heatmaps;
- order settings processed by your connected exchange or broker;
- alerts, notifications, and news feeds;
- template management;
- hotkeys;
- time zone and interface language adjustments.
User-friendly modular architecture
Analyze data from various exchanges and tools easily, keeping your workspace clutter-free!
- Workspaces enable you to maintain perfect order and switch between tools effortlessly.
- Layouts: use separate layers for charts, Smart Tape, the DOM, and switch between them without delays or data reloads.
- Manage elements with your mouse—move, combine, and resize windows to make the most of your screen space.