
Volume analysis is an important tool in a trader’s arsenal, but it requires a deep understanding of how to interpret volume dynamics in relation to price.
If you are a beginner trader and have not yet tried volume analysis, this article will help you decide whether you should study it (spoiler: definitely yes).
What do volumes mean in trading?
Beginning traders usually analyze the market in two dimensions: price and time. They can mark different things on a chart that displays price changes over a certain period of time, for example:
- support and resistance lines;
- trading channels;
- various shapes, such as triangles;
- candle patterns;
- Fibonacci levels.
But by adding a volume indicator to the existing data (usually it is displayed at the bottom of the chart in the form of a histogram), you get the opportunity to analyze the market in three dimensions: time, price and trading volume.
After adding volumes, you gain an unequivocal advantage — an additional source of information. However, there is also a downside, because more information means more workload — an additional factor that can lead to making the wrong decision.
Should you then add volume analysis to your strategy?
When you use volumes, you work with supply and demand. In the screenshot below, you will find a graphical representation of the supply and demand law. These curves are expressed in terms of the price P and the quantity of goods Q (which represents the trading volume).
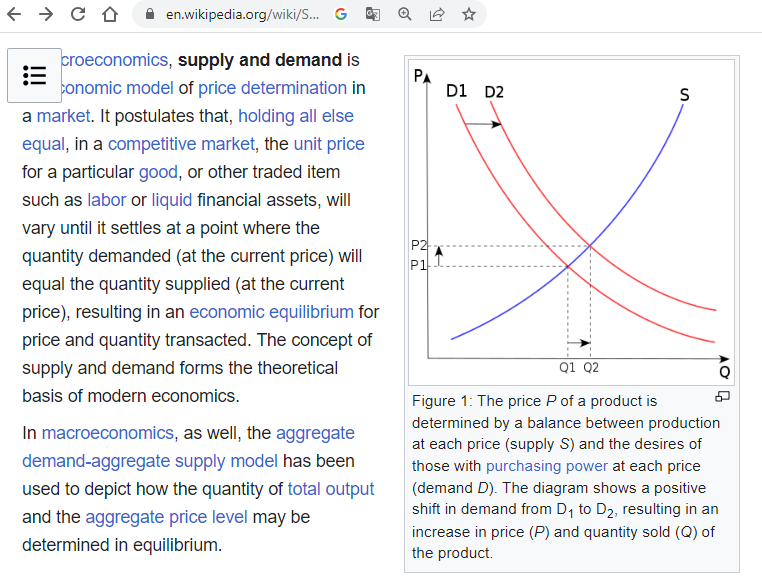
By analyzing the volume dynamics in relation to price and time, you form your own opinion on which force dominates the market – demand or supply.
How to analyse volumes?
It is believed that in a bull market:
- the price rises on increasing volumes;
- the price falls on decreasing volumes.
The opposite is true for a bear market:
- the price falls on increasing volumes;
- the price rises on decreasing volumes.
However, it is important to note that high volumes usually appear during market reversals. In this case, the previous rules work, but if the price rises on excessively high volumes (twice the average), this may be a sign of the culmination of a growing trend. If the price falls on excessively high volumes, this can be a panic and a sign of the culmination of a downtrend.
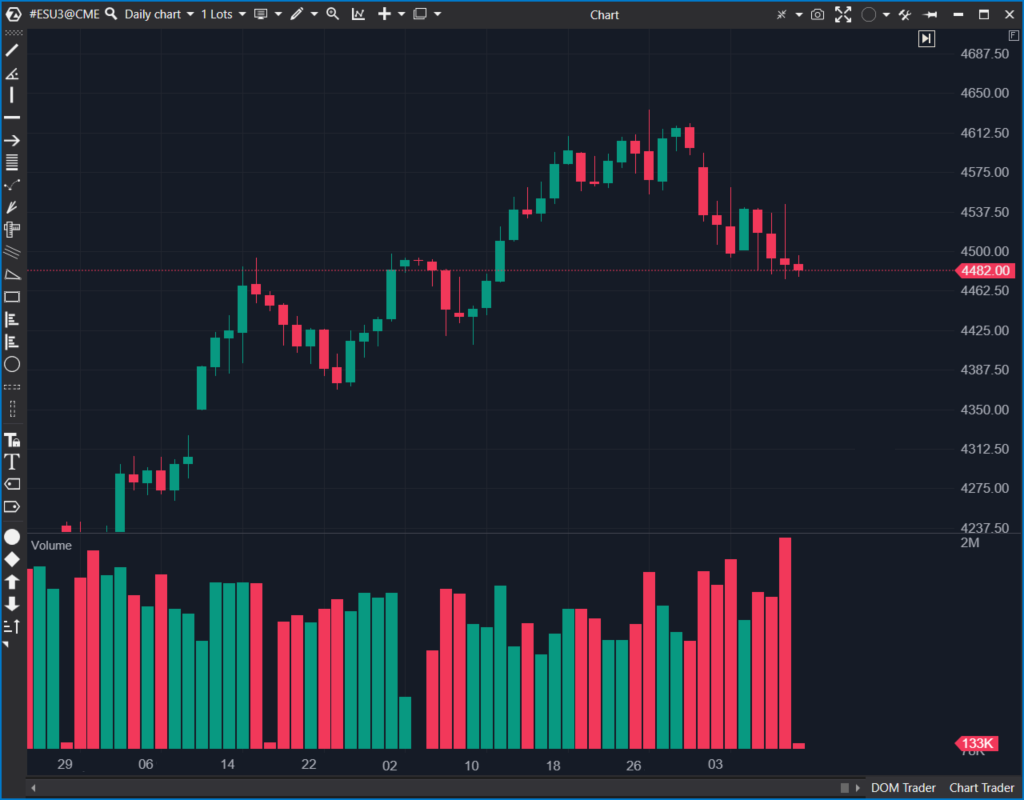
A simple example. Let’s take a closer look at the chart below — the daily period, the S&P 500 futures market, August 2023.
Numbers indicate:
- The price growth on volumes below average. This is a sign of weak demand. New highs are achieved with difficulty. The bullish momentum is exhausted.
- A long upper tail on high volumes indicates intraday selling pressure.
- Bulls make another attempt to push the price up, but the volumes are low. As indicated by the law of supply and demand, this could be caused by a shortage of buyers willing to pay such money for the contract.
- It is logical that the market opens with a bearish gap and declines on increasing volumes.
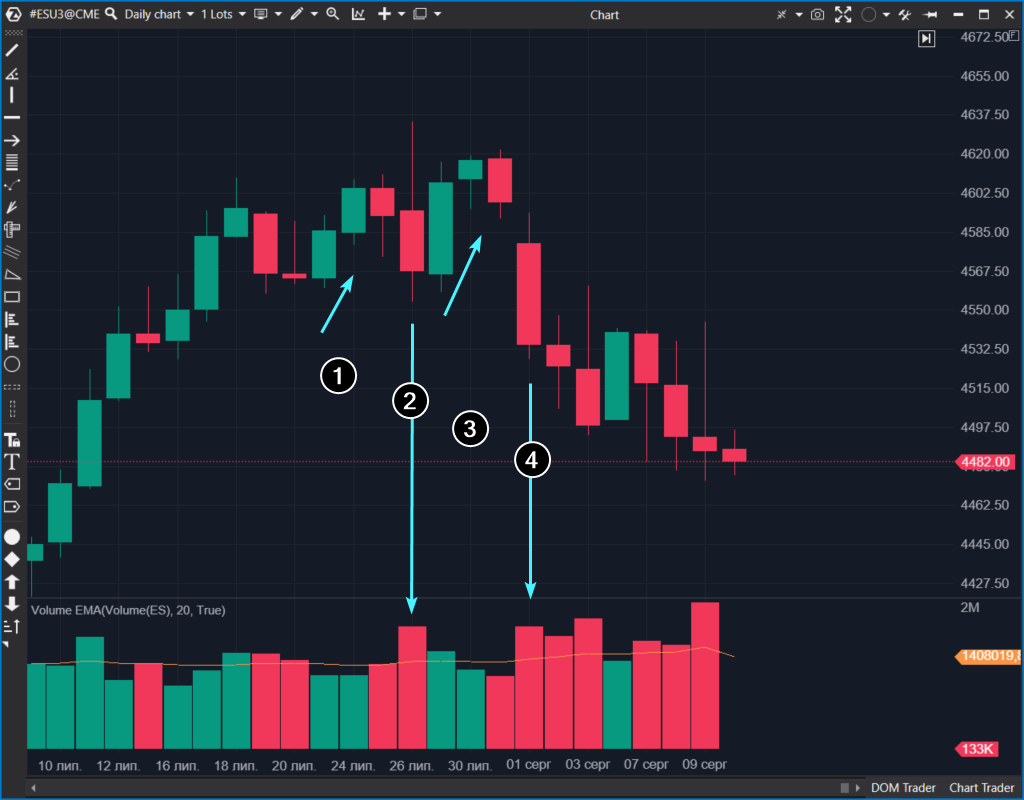
Another example. This time euro futures, also a daily chart.
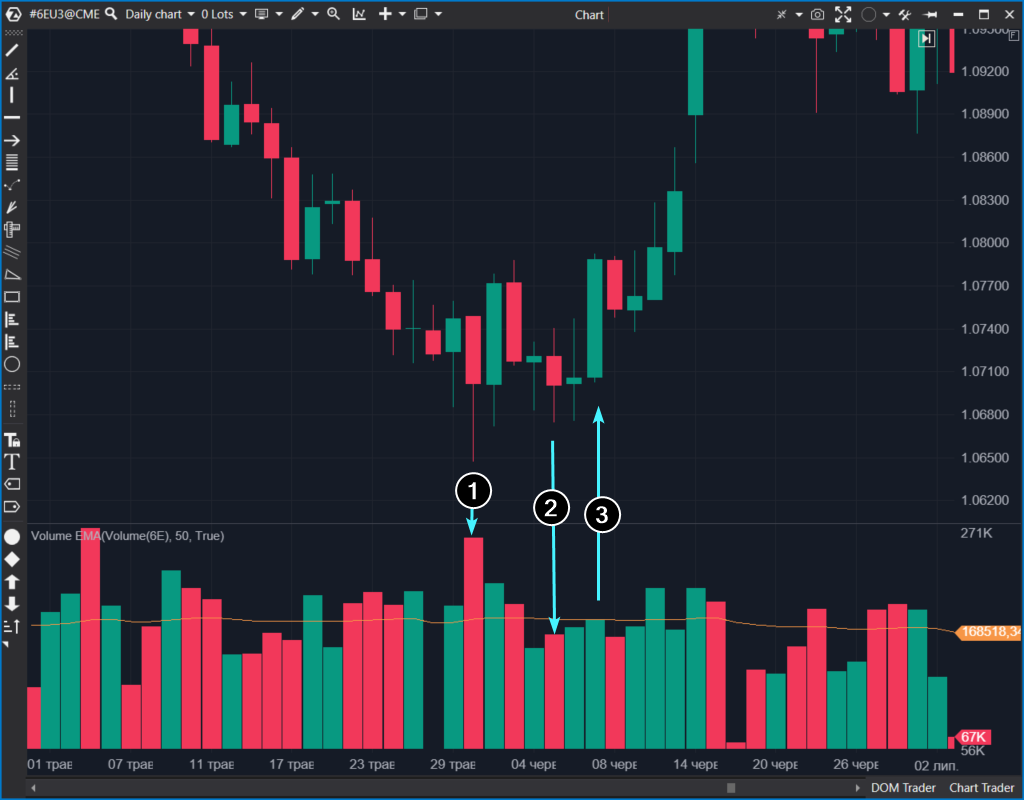
Numbers indicate:
- Excessively high volume during the price fall. There is probably a selling climax. The long lower shadow confirms this hypothesis. The next candle is bullish, another confirmation.
- The price decreases on volumes below average. A sign of a shortage of sellers.
- Sudden rise with a closing at the upper point, accompanied by volumes higher than those of previous days and around the average range, potentially indicating an increase in buyers’ activity.
Thanks to volume analysis, you can gain insight into the changing balance of supply and demand without delay in order to make informed decisions. Before signals are received from classic RSI, CCI or moving average indicators.
Pros of volume trading
- An independent source of information. Volumes are the flow of actual data from the exchange. It is objective, real-time, and remain consistent.
- It is applicable to various trading strategies. You can get trend confirmations, identify trend shifts, identify key levels, and receive signals for entry and exit.
- It enables you to track the activity of major players, who can significantly affect the price with their volumes. When analyzing volumes, you work with the causes of price movement — balances and imbalances in supply and demand.
- You can anticipate the intentions of market participants, as volumes in the DOM (Level II) provide more valuable information.
- You have access to a whole arsenal of advanced indicators: market profile, DOM levels, Cluster Search, Big Trades and others. Moreover, a special type of charts, the footprint, has been created to analyze volumes.
Cons of volume trading
- The information is limited. Volumes may be incomplete or distorted in low liquid markets, making them difficult to analyze. You can analyze currency futures on the CME exchange, but you cannot analyze forex volumes. If you analyze trading volumes of Bitcoin on Binance, you cannot analyze the total trading volumes on Binance and other exchanges (actually you can, but finding a simple solution for this task is unlikely).
- Difficult to interpret. Analyzing volumes requires a good understanding of the market context and experience for the accurate interpretation of the interplay between price and volume indicators in a specific situation.
- Fake signals, susceptibility to manipulation. Sometimes, a large volume can be the result of market manipulations or false movements intended to deliberately mislead traders.
- The dynamics of volume and price can greatly differ depending on the market. For example, for E-mini futures on the S&P 500 index, there is a spike in volume at the opening minutes of the stock exchange and in the last minutes before its closing. This is quite distinct from cryptocurrency markets, which operate 24/7.
It is worth mentioning separately that a volume indicator is not a magic wand that provides guaranteed accurate profitable signals in any market. There are no such holy grails.
How to configure a chart for volume trading?
Download ATAS. Launch the platform. Open the chart (Chart module in the main window) and select the tool you are interested in.
Press Ctrl+I or click on the corresponding icon on the top panel of the module — in the indicator manager window that opens, add the indicator to the chart by clicking the Add button.
Example 1. Below is a cluster chart. To switch to the footprint (cluster chart) mode, press Shift+K, or drag the timeline with the mouse. Bright white colors indicate high volume within each candle.
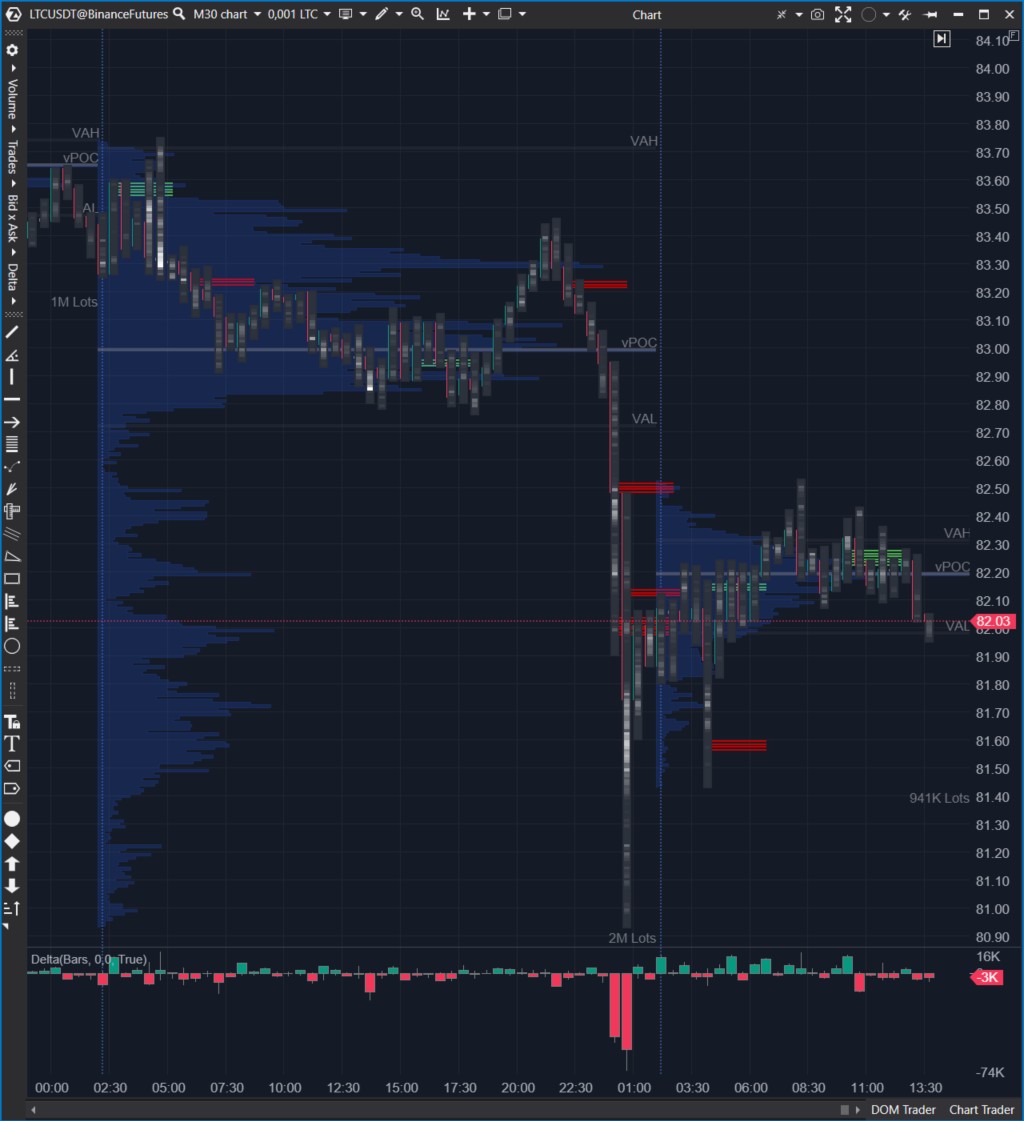
The following things have been added to the chart:
- The Delta indicator (histogram at the bottom) — shows the difference between market buys and sells;
- The Imbalance indicator (red and green horizontal strokes on the chart) — shows the imbalance of market sells and buys at several levels in a row;
- The Market Profile (dark blue histogram) — shows the trading activity for each level.
All indicators have many options for customization in terms of colors, modes, timeframe and other parameters.
Example 2. Below is a line chart with a heat map based on large levels in the DOM.
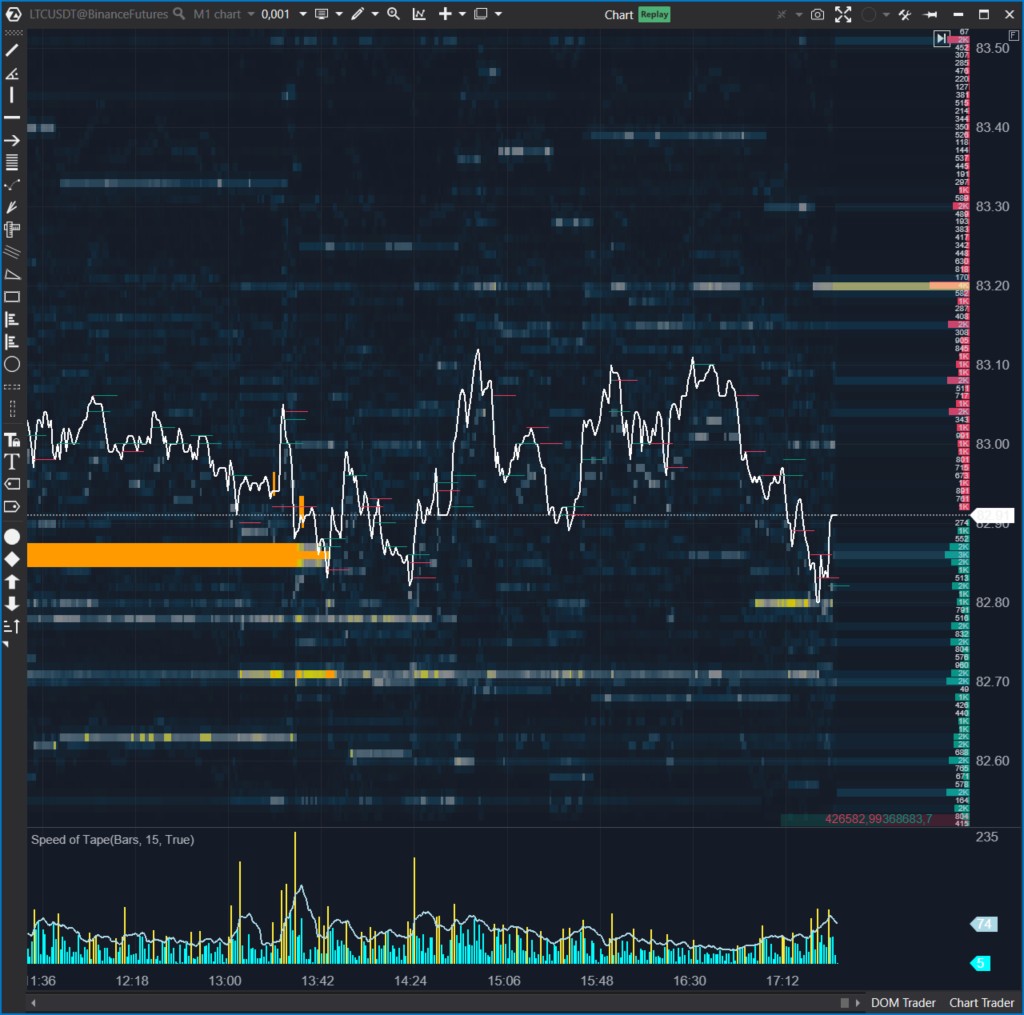
The following things have been added to the chart:
- The DOM Levels indicator, which is actually the heat map. The brighter the level, the larger the amount of limit orders placed on it.
- The market depth indicator is a histogram on the right side.
- The tape speed indicator is a histogram at the bottom. It shows trading activity. You can set up the analysis of trades, bids, asks, deltas.
The examples provided above illustrate how volume analysis can improve your market assessment.
How to start learning volume analysis?
Download Free Trial ATAS. It is free. You will get full access to the platform’s tools during your free trial and will be able to appreciate all their benefits in order to make a purchase decision. Moreover, you will be able to continue using the program even after the 14-day trial period is over, but only for cryptocurrency trading.
And then follow these steps:
- Practice. Trade in the Market Replay simulator. Advance rapidly along the learning curve without the risk of losing your deposit. Replay history with the ability to trade, add advanced volume indicators to the chart.
- Analyze the results, correct mistakes.
- Go back to step 1 until you feel confident that you are ready to trade with real money. We recommend starting with small amounts that you can afford to lose.
Here are some tips for beginners:
- series of articles “Getting acquainted with ATAS”;
- a series of articles on volume analysis using the VSA methodology;
- also pay attention to the “Quick start” tab in the main window of the ATAS platform.
Conclusions
Trading is a highly competitive business, where easy money is nonexistent. Therefore, if you are willing to put in the effort to gain a competitive edge, volume analysis brings more benefits than drawbacks.
To enhance your trading skills, we recommend paying proper attention to understanding the dynamics between price and volume, based on the fundamental law of supply and demand.
ATAS provides powerful and user-friendly tools for effective volume analysis. These tools can serve various purposes, like tracking the behavior of “smart money” for trading in sync with it.
You can practice interpreting patterns in price and volume behavior using the Market Replay simulator of the ATAS platform.
That ATAS platform:
- enables you to download tick history from the futures, stocks, and crypto markets so that you can get a detailed picture of the market;
- provides many benefits for traders who want to combine bounce trading with user-friendly cluster charts and useful indicators.
Do not miss the next article on our blog. Subscribe to our YouTube channel, follow us on Facebook, Instagram, Telegram or Twitter where we publish the latest ATAS news.
Information in this article cannot be perceived as a call for investing or buying/selling of any asset on the exchange. All situations, discussed in the article, are provided with the purpose of getting acquainted with the functionality and advantages of the ATAS platform.


