
A bear trap is a market situation that can mislead inattentive traders. It consists of two movements:
- First, the asset price falls, creating the illusion of the beginning of a downtrend. Traders anticipating further decline rush to sell the asset, becoming bears.
- However, shortly after, the price begins to rise. This usually happens very rapidly, leaving those traders locked in losses.
In this article, we will take a closer look at how a bear trap works and how to avoid getting caught in one.
Read more:
What Is a Bear Trap in Trading and Why Does It Occur?
A bear trap in trading is a false downward move that tricks market participants (usually impulsive or less experienced) into opening short positions.
Bear traps in the stock market typically happen due to a combination of the following factors:
✔ Market sentiment. The urge to profit from falling prices, combined with the fear of losses and impulsive decisions, leads traders to sell their assets. These emotional trades often end up being unprofitable.
✔ Manipulation by major players. It is possible that market makers or large investors intentionally drive the price down to trigger mass selling by retail traders, only to buy the assets back at a lower price.
✔ Technical factors. False breakouts of support levels or misleading signals from indicators can trick traders into thinking a downtrend will continue.
✔ Fundamental factors. Short-term panic triggered by news or rumors can cause temporary drops, followed by a quick recovery once the news is fully absorbed.
Examples of a Bear Trap
Bear traps occur quite frequently in the stock market, both intraday and on higher timeframes.
Example 1: A bear trap in the e-mini S&P 500 futures market on a 3-minute timeframe:
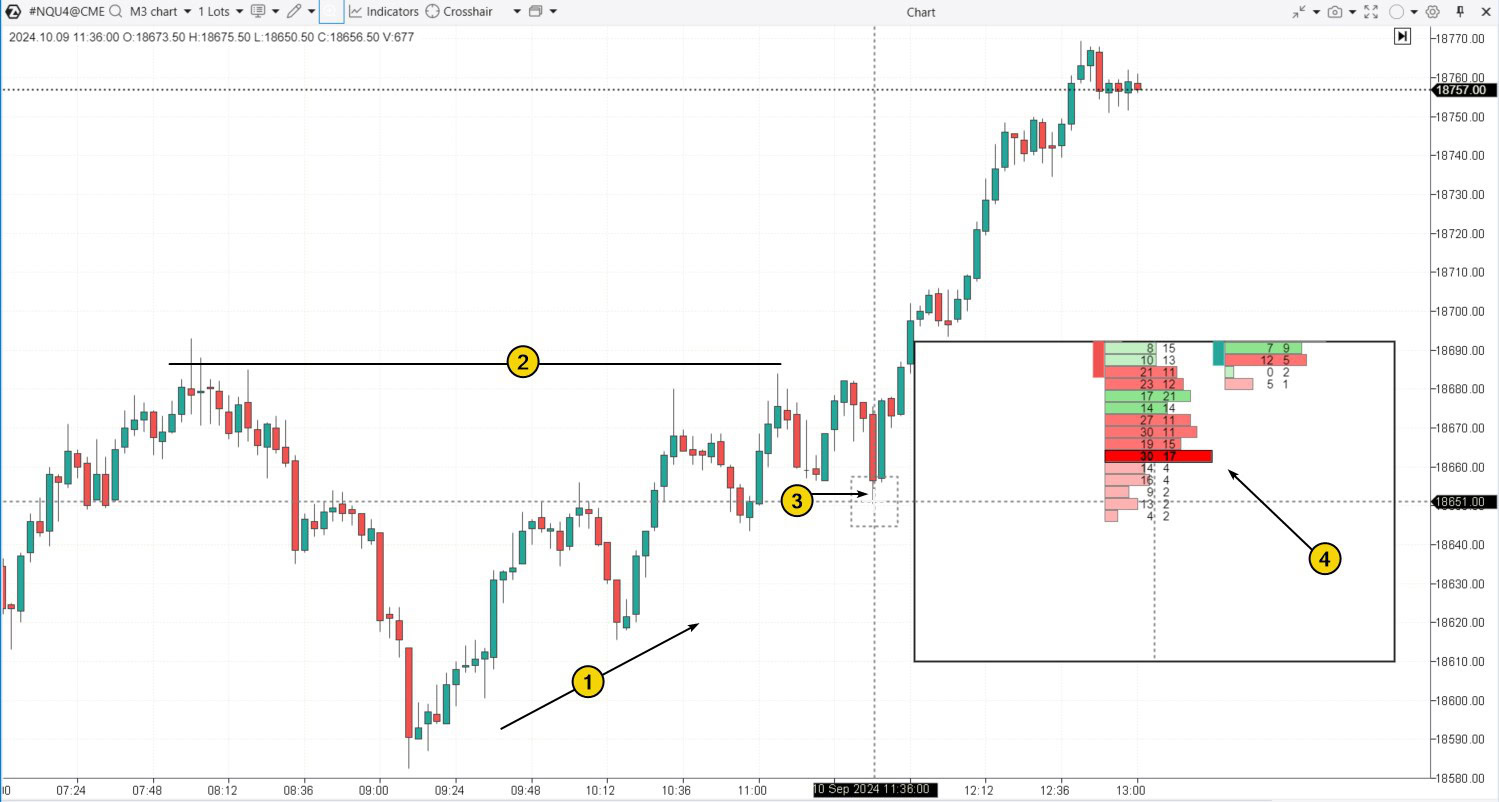
Starting at 9:00, market sentiment was positive (1), and the price moved upward, forming higher intraday lows and highs.
However, as the price approached a previous resistance level (2), the upward momentum slowed. At 11:36, the price dropped below the previous local low (3).
At this point, traders may have started selling contracts more aggressively, expecting a trend reversal. The bright red clusters on the footprint chart (4) show market sell orders being executed.
But then the price reversed upward and broke through the previous resistance level, trapping those who assumed the rally was over or who exited their long positions via stop-loss orders.
The bears, trapped in losing positions, were forced to cut their losses, which helped push the price through the resistance level (2), acting as “fuel” for the breakout.
Example 2. Bear trap crypto – a bear trap in the Bitcoin market.
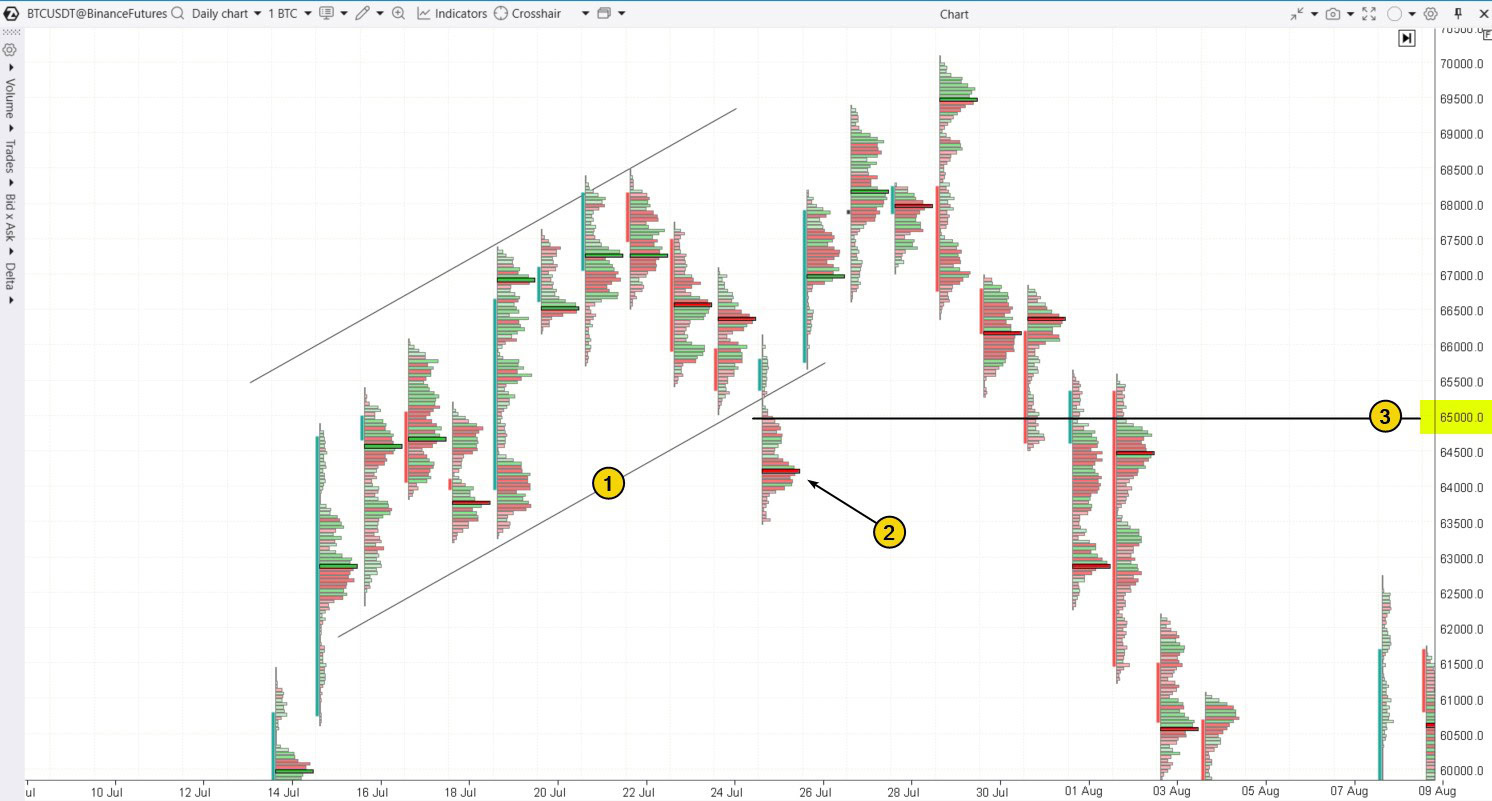
This is the daily chart of BTC/USDT from Binance Futures, showing a rally within an ascending channel (1).
However, the price began to decline, falling below the psychological level of $65k and breaking the lower boundary of the channel. Market participants started to worry that the upward trend was over and that the downward momentum might pick up. Their concerns led to market sell orders, as seen in the bright red cluster (2). The bulge on the profile indicates some balance, meaning there were enough opposing buy-limit orders, likely from professional traders, to counter the surge in market sell orders.
Despite this, the candle closed near the highs, significantly above the bright red cluster, leaving sellers in a vulnerable position. The price then went on to exceed the previous high, much to their disappointment.
The green clusters at the peak on July 29 suggest a bull trap, which caught buyers off guard when the price broke above the peak on July 27.
How to Spot a Bear Trap - Technical Analysis
A bear trap on the chart is usually identified by a breakout of a support level. This typically happens in the following way:
- Entering the bear trap. The price briefly drops below a clearly visible trendline, a previous low, or a psychological price level. This prompts market participants to open short positions( and close their long positions, either manually or through stop-loss orders).
- Closing the trap. Instead of continuing to fall, the price unexpectedly reverses and starts to rise. This often happens quickly to limit the chances for bears to exit without taking a loss.
By using advanced volume analysis tools — such as market profile indicators, cluster charts, and other methods — traders can more accurately confirm the formation of bear traps.
Bear Trap Patterns
A key element in trading bear traps is understanding the context. The most relevant situations for bear traps to form include:
- Breaking out of a notable range. In this scenario, traders who mistakenly believe a bearish breakout is genuine can easily fall into the trap.
- A false breakout of a psychological support level. Traders might think that if the price drops below $100, it will continue to slide down to $90 or at least to $95.
- A bear trap in an uptrend. This type of trap aims to create doubt among some traders about whether the price will keep rising, leading them to sell their positions. Often, these positions are then scooped up by more experienced and patient traders.
- Fundamental events. Volatility spikes that come with the release of important news can create ideal conditions for traps to form. During these times, it is hard for traders to objectively evaluate the credibility of rumors and the impact of new information, resulting in significant price movements.
Pattern #1. Slamming in the Gap
The example below illustrates how a bear trap is closed with a wide gap on the cluster chart for AAPL stock on a daily timeframe.
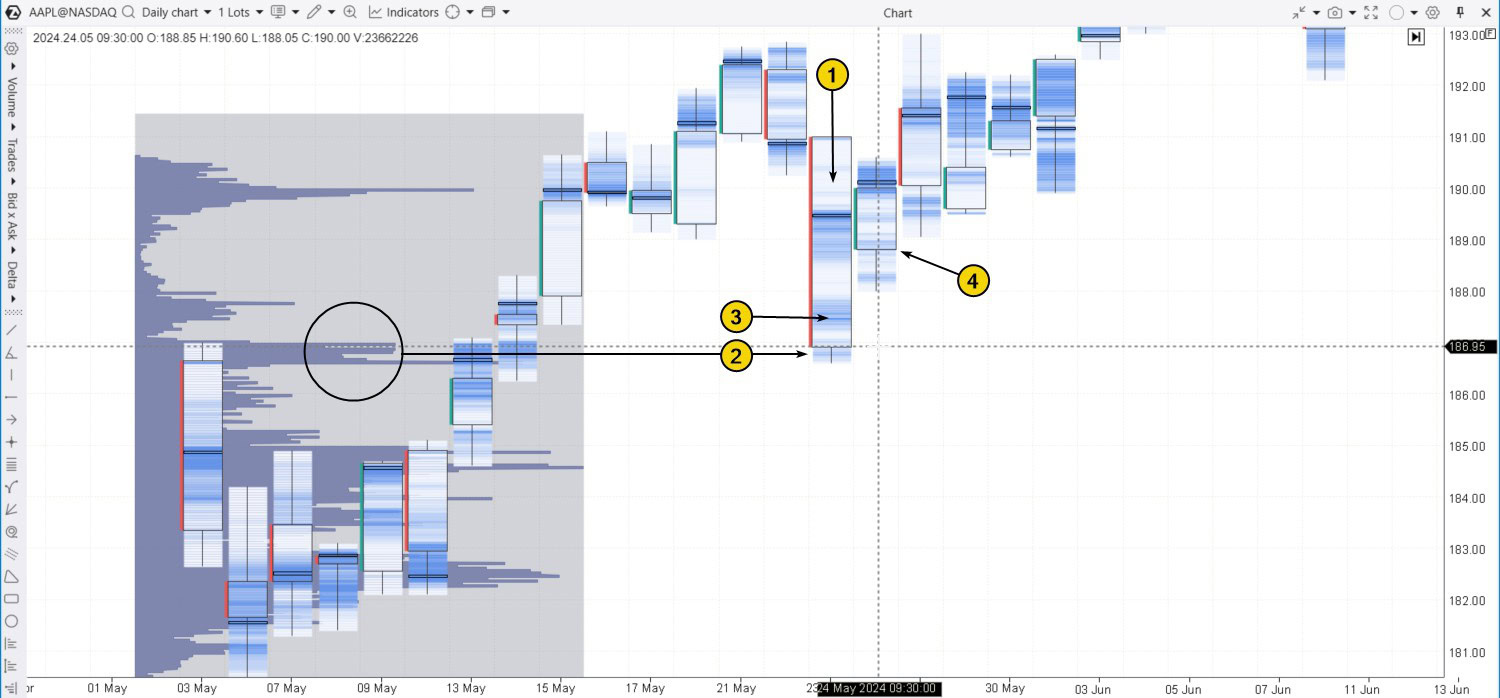
On May 23, 2024, the price of Apple (AAPL) stock sharply declined (1).
Traders using volume analysis noticed that this price drop tested the bulge on the profile (2).
However, without recognizing this crucial support, one might emotionally conclude that the stock was entering a downtrend, making the decision to sell seem justified. The activity marked by number 3 likely corresponds to market sell orders from traders motivated by this assumption.
In reality, after testing the bulge on the profile, trading opened the next day with a bullish gap, trapping sellers who had opened short positions around the low of May 23.
Pattern #2. False Breakout from a Range
When the price of a financial asset moves within a range, it creates a tricky situation for trend traders, who might mistakenly interpret a price movement as a breakout in one direction.
An example on the Litecoin chart, where the added Delta indicator helps confirm the market sell activity with spikes of negative values.
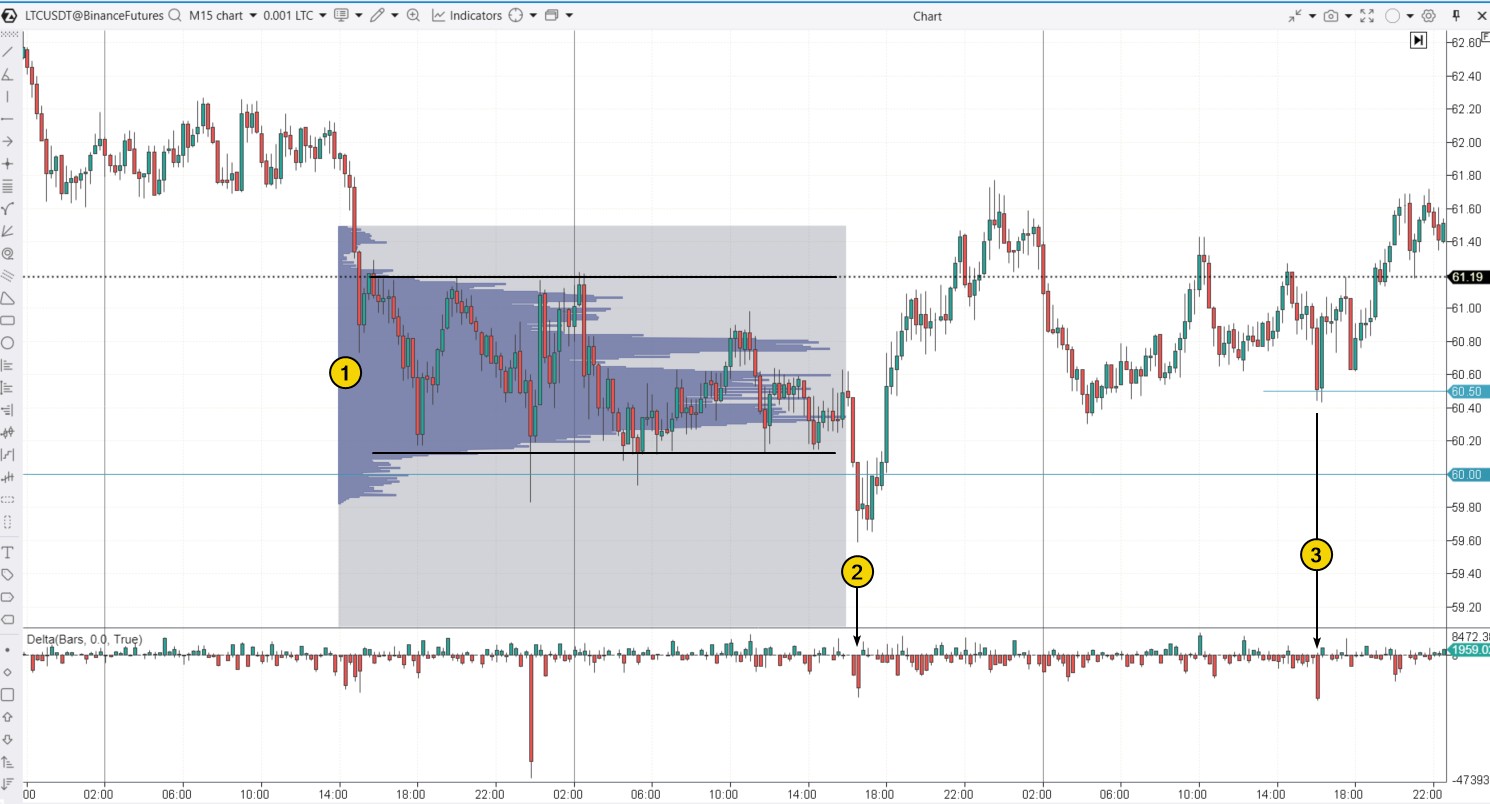
(1) The price moves within a range, rarely breaking outside the boundaries marked by black lines. Traders are waiting for a breakout.
(2) The price drops below the psychological level of $60 per Litecoin. This not only triggers stop-loss orders from buyers hidden behind this level but also entices emotional traders, tired of waiting, to open short positions.
However, the downward momentum does not continue. Instead, the price quickly returns to the range on a strong bullish candle, closing the trap for the bears.
(3) Another drop occurs, which could also be considered a bear trap. However, the move is so sharp that it seems more like a stop-loss hunting below $60.50. For bears to be properly caught in the trap, the price needs to pause at the lower part of the pattern.
Pattern #3. Bear Trap at the End of Accumulation
Accumulation, a term from Richard Wyckoff’s methodology,
refers to a phase (highlighted in purple below) when the market is sluggish, and large players are quietly accumulating assets at low prices, preparing for a future price rally. Wyckoff called bear traps at the end of accumulation phases terminal shakeouts.
Example. Microsoft (MSFT) Stock Chart
2022 was a tough year for the stock market, with rising inflation, recession fears, and other challenges. This is reflected in the direction of the 100-period Exponential Moving Average (EMA).
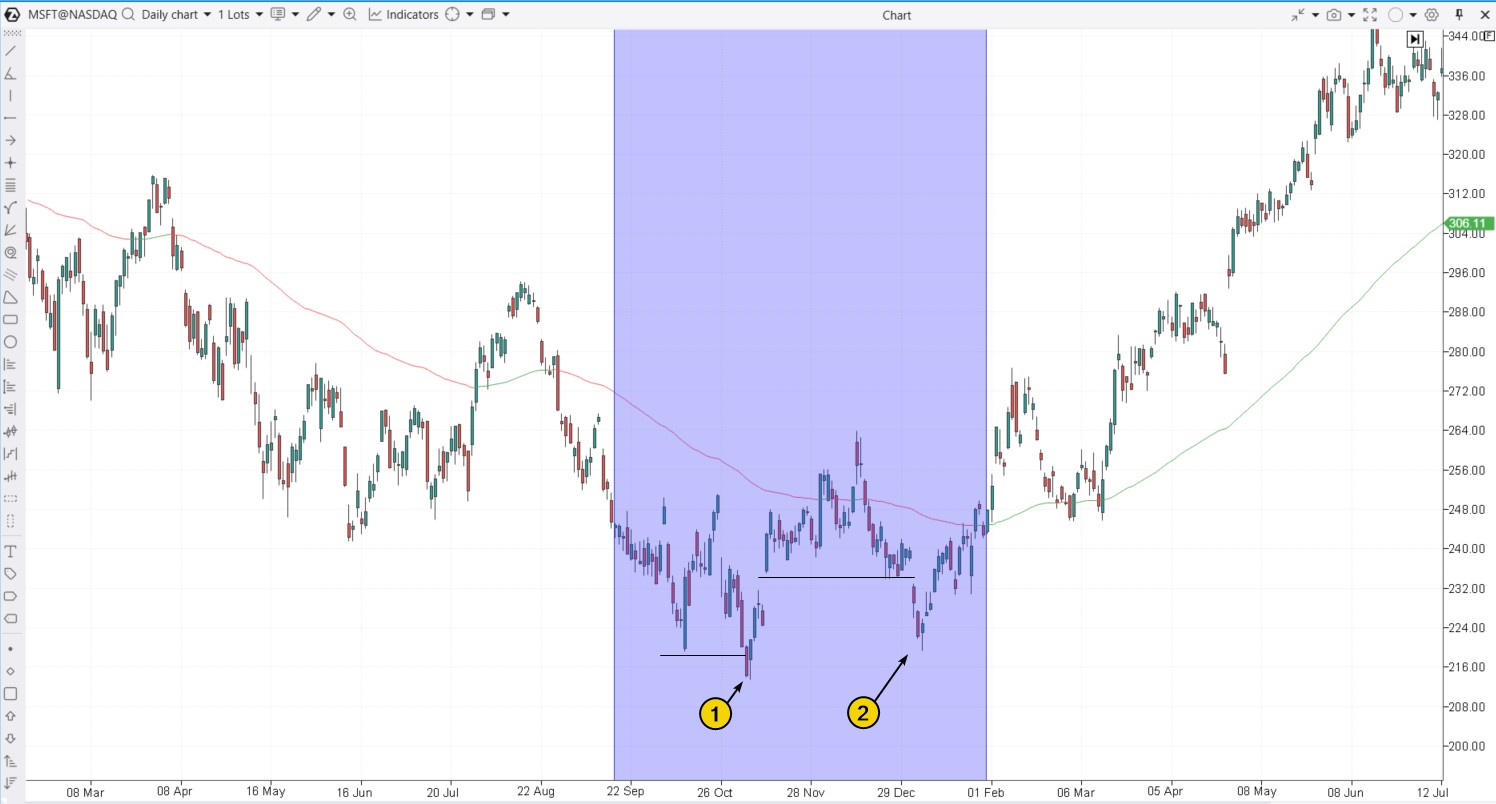
By December 2022, the market had somewhat stabilized. A key indicator was a bear trap (1): the price briefly dipped below the previous low but quickly rebounded — this can be seen as a sign that selling pressure had weakened. Given the ongoing bearish trend, it seemed more likely that the price would continue downward.
Around that time, there was talk in the market that the Federal Reserve’s actions could help prevent a recession and bring inflation under control. This optimism helped MSFT’s price hold above a bullish gap near the $233 level.
But what happened in the first days of 2023? The price took a sharp drop (3), influenced by lower market liquidity during the holiday season. This was a bear trap, as the market was preparing to shift into a growth phase in 2023, driven by news of falling inflation and excitement around AI.
Pattern #4. A Bear Trap In an Uptrend
In a rising market, bear traps often lead to a transfer of contracts from traders expecting a reversal to those betting on the continuation of the bullish trend.
Example. The chart below shows a cryptocurrency asset that, at the time of writing, was experiencing a wave of hype.
The green line in the lower right corner is the moving average, signaling the continuation of the uptrend as the price broke above the key psychological level of 0.19000.
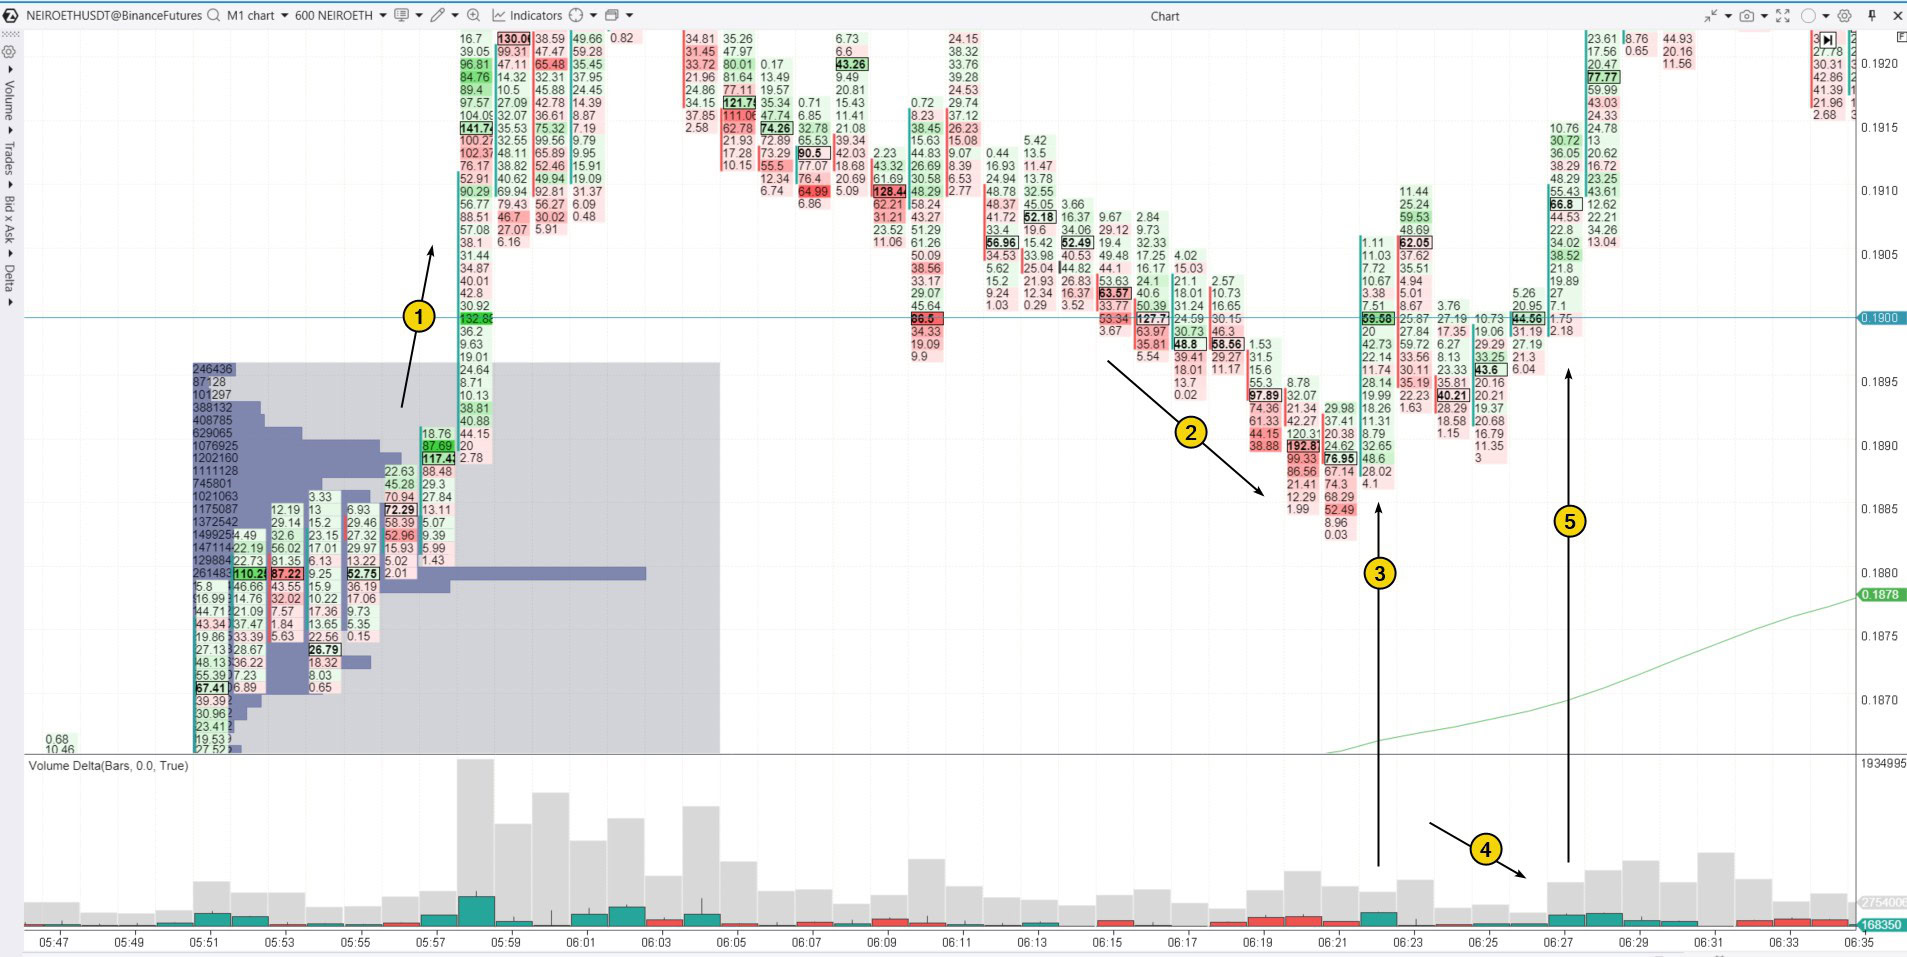
During a correction from the overbought zone, the price briefly dipped (2) back below 0.19000. As we can see from the delta and the red clusters, sellers were active:
- some traders thought the “pump” was over and a “dump” was about to begin;
- others were closing their long positions (for example, those who had bought around the profile bulge before the 0.19 breakout might have exited near breakeven).
Either way, the situation shows characteristics of a bear trap, especially considering how sharply it snapped shut (3). The subsequent low-volume price drop (4) indicated the exhaustion of selling pressure, which was confirmed by the next bullish surge (5).
Pattern #5. Bear Trap Driven by News
September 11, 2024, was a key day due to the release of the Consumer Price Index (CPI). Inflation was a hot topic at the time, as traders were anticipating a possible rate cut from the Federal Reserve.
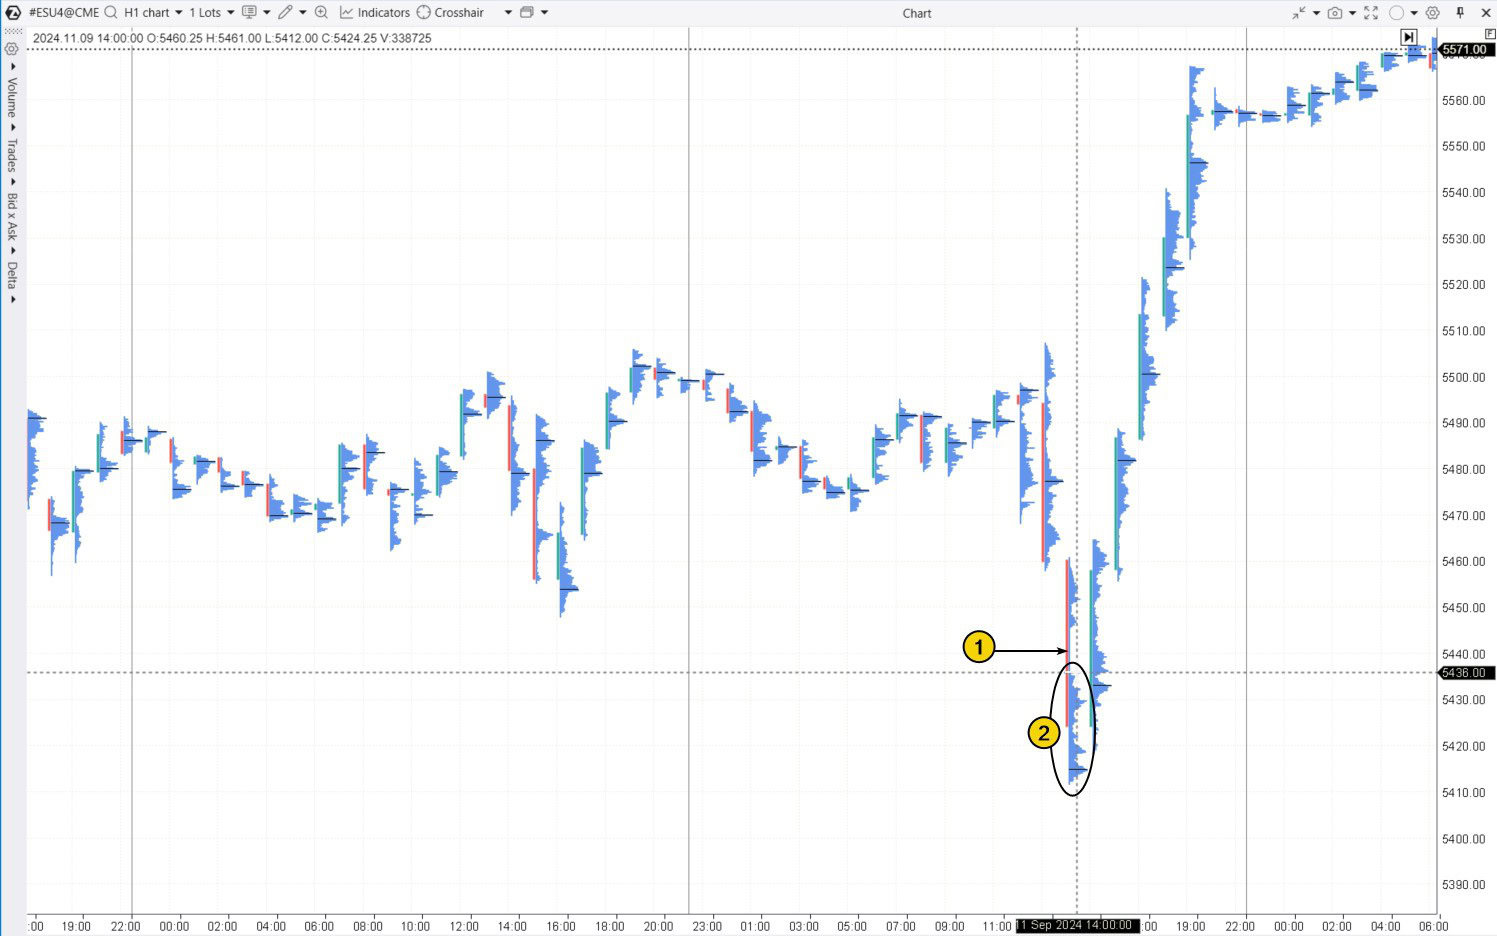
Before the 11th, the price had been trading within a 5450-5500 range, with traders closely watching for the news.
Here is what happened just before the release:
The price began to drop sharply (1). The thin profile indicated strong selling pressure.
This sudden decline attracted more sellers (2), who feared that the price would fall even further once the CPI was published.
But the opposite happened. Inflation came in slightly higher than expected, but the increase was minimal. The market’s reaction was a sharp rally, trapping the unfortunate bears who had bet on further declines.
Pattern #6. Bear Trap Near a Psychological Level
The cryptocurrency market is characterized not only by volatility but also by traders’ emotional reactions. Traps around round-number levels are noticeable on the daily charts of nearly any crypto asset.
Example. A daily footprint chart of Litecoin with the Round Numbers indicator added.
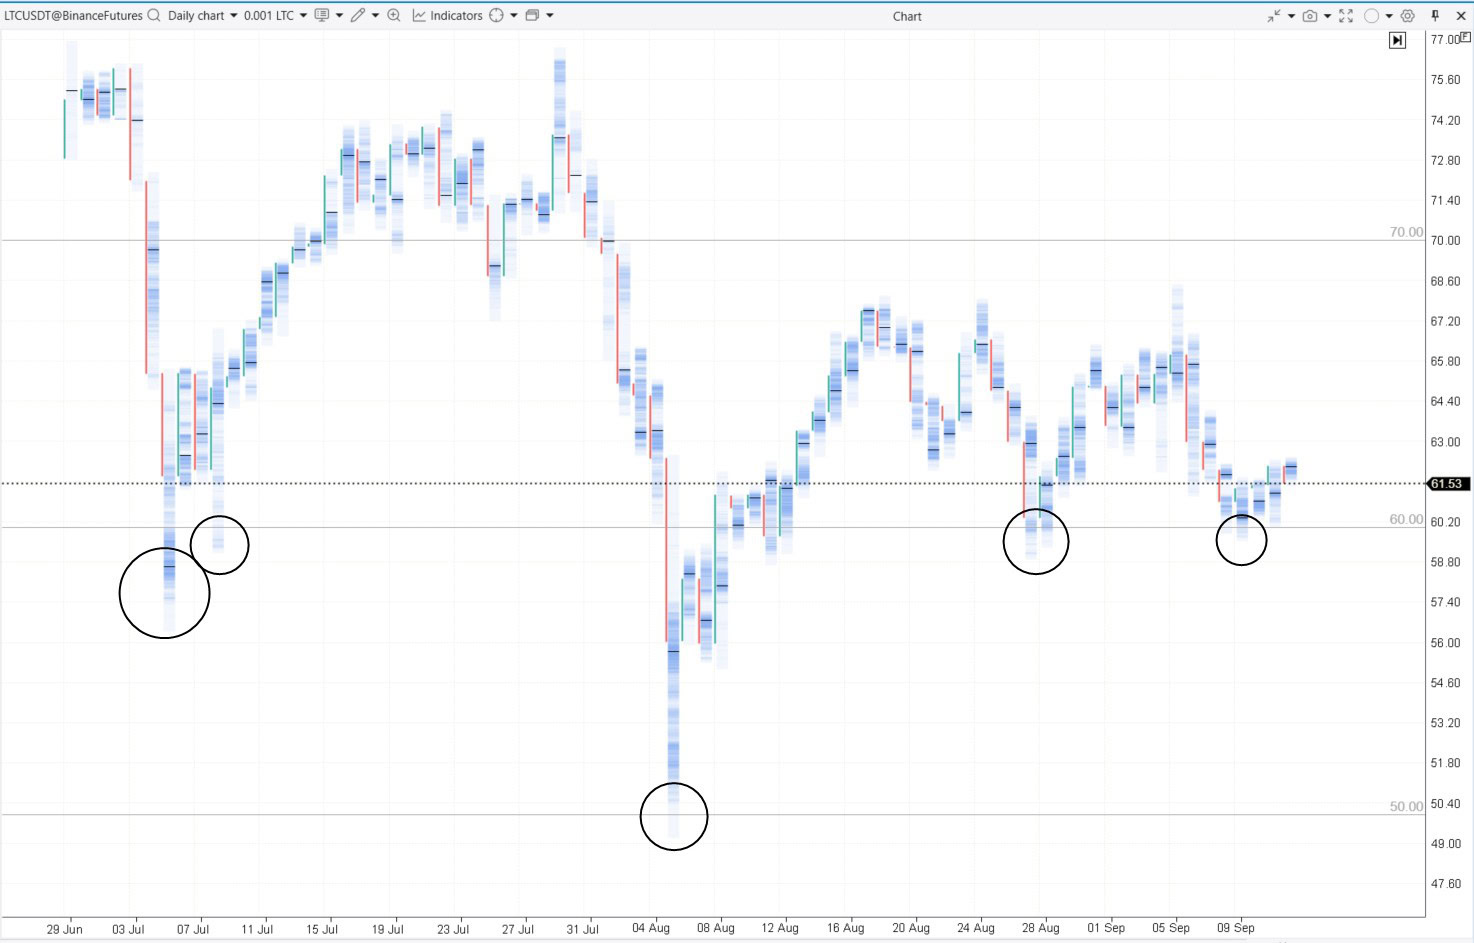
The circles highlight patterns that exhibit signs of bear traps. The formation process is similar to what has been described in previous examples.
How to Trade the Bear Trap Pattern: The Best Strategies
A bear trap is based on the principle of “one trader’s loss is another’s gain.” It prompts less experienced traders to sell off their assets during a deceptive price drop, creating opportunities for more skilled and informed participants to profit.
To effectively trade bear traps, it is important to understand how and at whose expense the profit is generated.
Strategy #1. Buying Above the Trap’s Bulge
Let’s say you have identified an important support level, and a false breakout of this level could lead to the formation of a bear trap in trading. What comes next? Let’s look at this more aggressive approach on the chart.
Example. Throughout the day, the price remained above the level (1), forming higher highs. But during a volatile U.S. session, it briefly dipped below, likely triggering a wave of sell orders. This, in turn, set the stage for a bear trap.
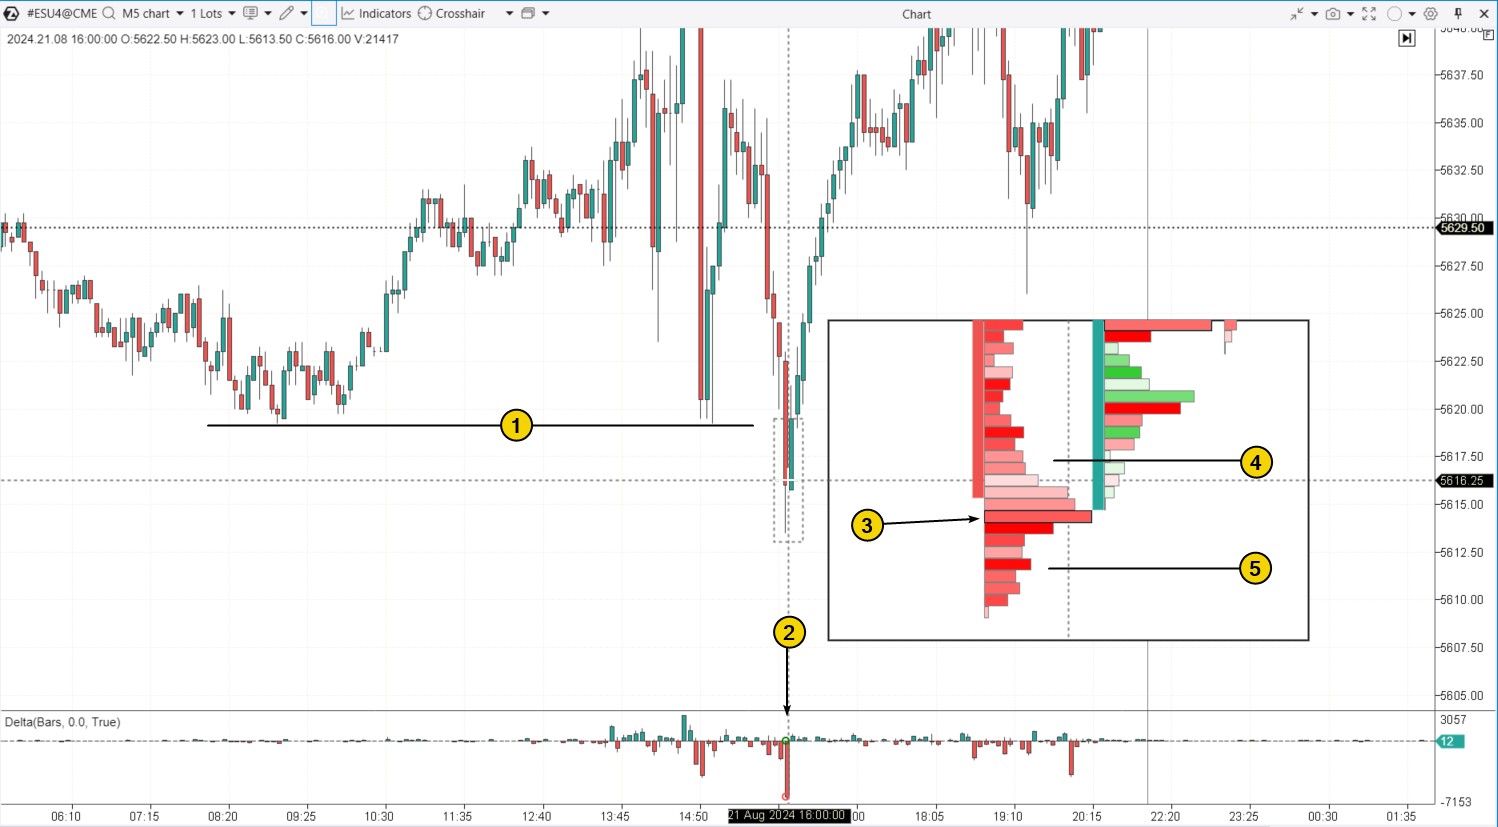
There are additional factors that can indicate a bear trap is forming:
- a surge in negative delta (2);
- a red-colored bulge on the profile (3), showing significant market sell orders;
- the price holding above this bulge. If these mass market-sell orders were causing real selling pressure, the price would likely fall below those large red clusters.
In this case, you might consider entering a long position above the bulge, for example, around level (4), and placing a stop-loss just below it, around level (5).
The downside of this strategy is that selling pressure could resume after a short pause.
Strategy #2. Trading on the Exit of the Trap
To implement this more conservative strategy, it is important to wait for buyers to step in and close the bear trap.
Example. This Bitcoin volume chart visually highlights the delta percentage within the total volume of each candle.
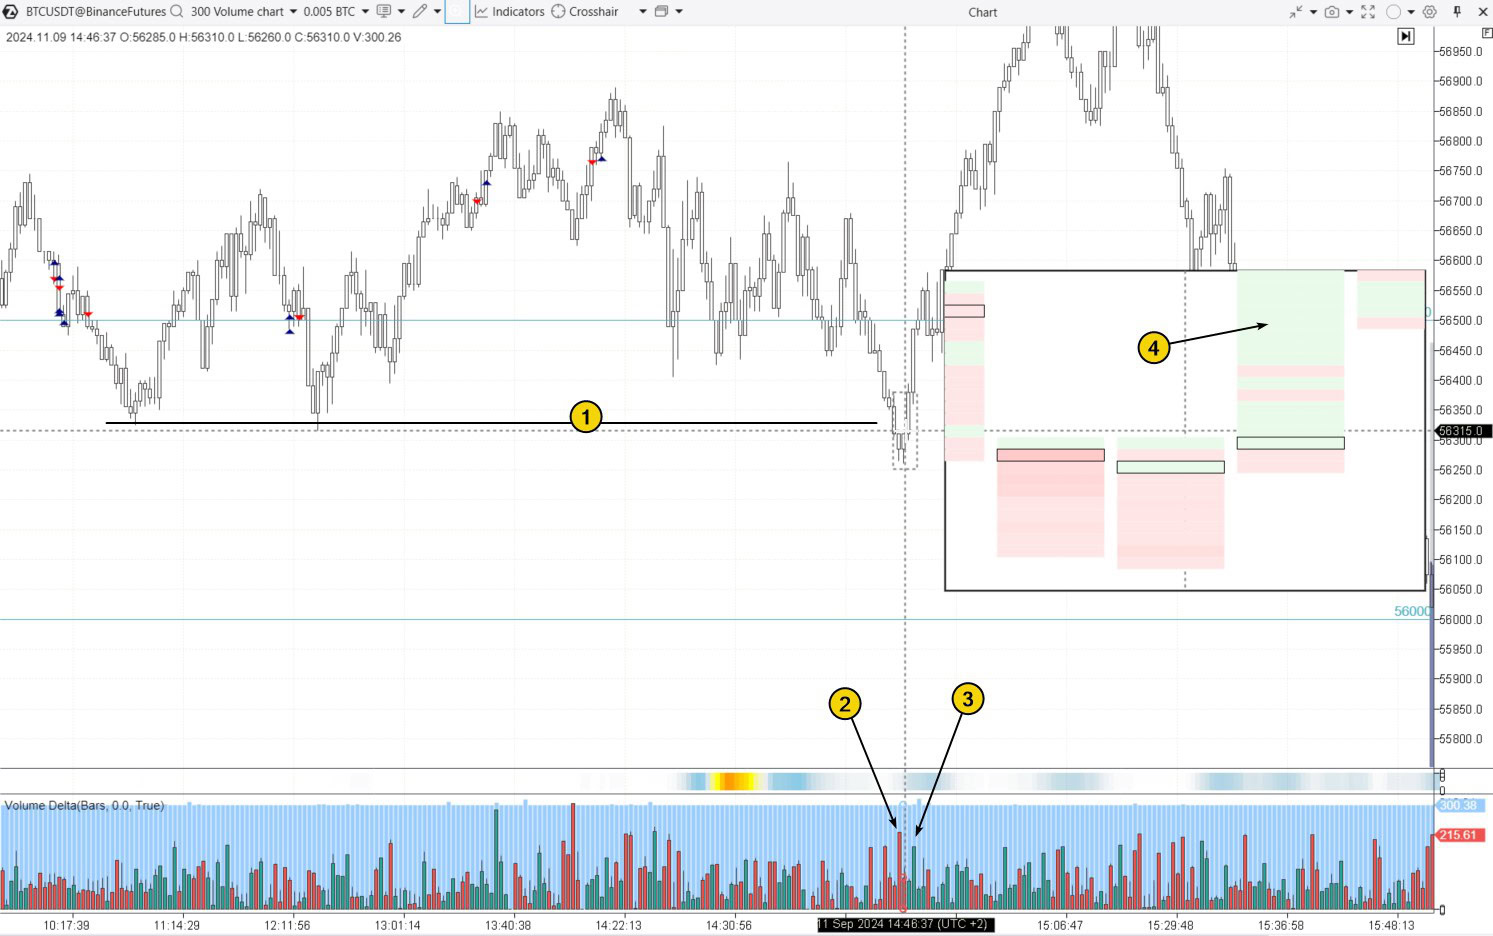
In this example, the price held above support (1) for a while, but eventually dipped below.
The spike in negative delta (2) confirms strong seller activity, but since the downward momentum did not continue, it suggests the formation of a bear trap.
When buyers appear and push the price back up, closing the trap, it provides a signal to open a long position. Key indicators include a spike in positive delta (3) or a series of green clusters, showing increased demand for the asset at a lower price.
While your stop-loss might be wider in this case, if you enter the trade at the right moment, it is likely to turn profitable quickly.
Why Do You Need to Avoid the Bear Trap and How Do You Do It?
It is important to avoid bear traps to prevent losses during a false breakout, when the price suddenly reverses upward after a short-term drop. Traders caught in such a trap may sell their assets at the low and experience psychological discomfort as they watch the price rise afterward.
There is no foolproof method to completely protect yourself from losses in trading, including losses from bear traps. Therefore, it is crucial to always manage risk: set reasonable stop-losses and avoid risking too much of your capital on a single trade.
Context Analysis
Monitor multiple timeframes, study the strength of trends, and identify key support and resistance levels to get a broader picture of the market. This will help you understand whether the current market situation is vulnerable to bears.
Analyzing Footprint Patterns
Avoid making impulsive decisions based on a single breakout. Seek additional confirmation through a retest of the level or advanced technical indicators, such as volume indicators (delta) or footprint chart patterns.
Become a Market Psychologist
Understanding that the majority of retail traders often act out of fear and greed can help you stay calm during short-term price drops. Traders who grasp how others react to false breakouts of support levels are able to make decisions with a cooler head.
How to Trade Bear Traps Profitably?
Use the Market Replay trading simulator. This module of the ATAS platform uses historical data to recreate real-time trading conditions.
You can enhance your trading skills, especially in identifying bear traps. The training simulates real-world conditions without financial risk, enabling you to learn how to use footprint charts.
To try the simulator, download the ATAS platform for free, install, and launch it, and then:
- Open a chart of a financial instrument.
- Click on the Market Replay button in the main ATAS menu.
- Activate the Replay mode (the icon should turn green).
- Adjust settings if necessary (date, data type).
- Start the replay and monitor the chart for signs of a false support breakout. Look for confirmation using footprint charts or indicators to make an informed decision on entering a long position.
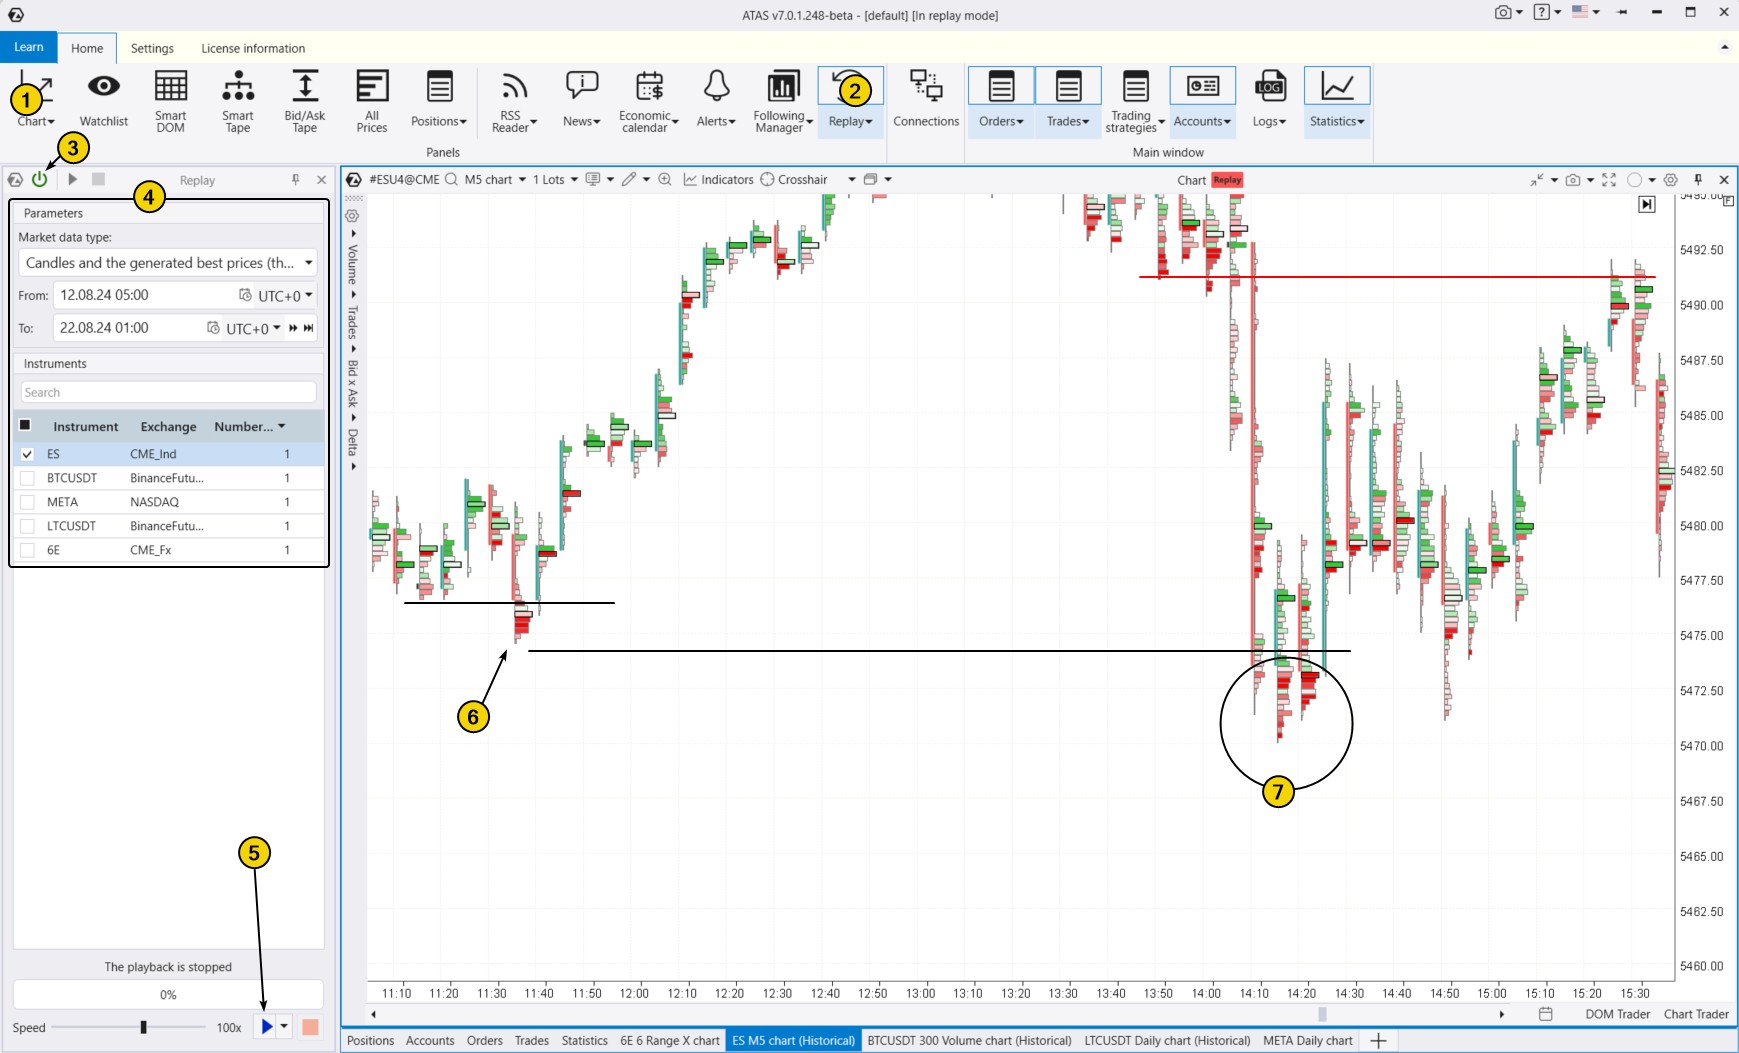
The chart of ES futures above shows two bear traps: one from a false bearish breakout (6) of support during the European session and a more volatile version (7) also during that session.
When practicing trading patterns in the Market Replay simulator, you can:
- use Chart Trader and other features to trade on the built-in demo Replay account and then analyze your performance;
- adjust the playback speed, and pause;
- analyze footprint charts;
- use more than 400 indicators;
- use drawing objects, for example, mark support and resistance levels;
- use various chart types (e.g., non-standard Range XV);
- use exit strategies;
- do much more to learn how to profit from situations where others make mistakes.
ATAS enables you to upload tick data history from cryptocurrency, stock, and futures markets, giving you a comprehensive base to find patterns in price-volume interactions and develop your own swing trading strategy.
Conclusions
Bear traps are a key feature of market trading, where most participants end up facing losses, as highlighted by reports from the European Securities and Markets Authority (ESMA).
These traps form due to common psychological patterns among retail investors, who often find themselves on the wrong side of the market. Their selling can inadvertently help professional traders establish long positions at market lows.
By using volume analysis tools such as cluster charts (footprint), the Delta indicator, the Market Profile indicator, and others, traders can spot moments when sellers are opening positions en masse during false price declines, making them vulnerable to sharp upward reversals.
Download ATAS. It is free. Once you install the platform, you will automatically get the free START plan, which includes cryptocurrency trading and basic features. You can use this plan for as long as you like before deciding to upgrade to a more advanced plan for additional ATAS tools. You can also activate the Free Trial at any time, giving you 14 days of full access to all the platform’s features. This trial allows you to explore the benefits of higher-tier plans and make a well-informed purchasing decision.
Do not miss the next article on our blog. Subscribe to our YouTube channel, follow us on Facebook, Instagram, Telegram or X, where we publish the latest ATAS news. Share life hacks and seek advice from other traders in the Telegram group @ATAS_Discussions.
Information in this article cannot be perceived as a call for investing or buying/selling of any asset on the exchange. All situations, discussed in the article, are provided with the purpose of getting acquainted with the functionality and advantages of the ATAS platform.


