
The megaphone pattern is a chart formation that looks like an expanding triangle. It appears on the charts of stocks, currency pairs, or other financial instruments, and is characterized by widening boundaries where the highs and lows move in opposite directions, forming a shape similar to a megaphone.
Read more:
What Does the Megaphone Pattern Look Like on a Chart?
The megaphone pattern usually becomes evident when the price touches the expanding triangle’s boundaries at least five times — three touches on one side and two on the other. However, in practice, the number of touches is not always limited to this sequence.
Example. Two instances of the megaphone pattern on a 5-minute gold futures chart:
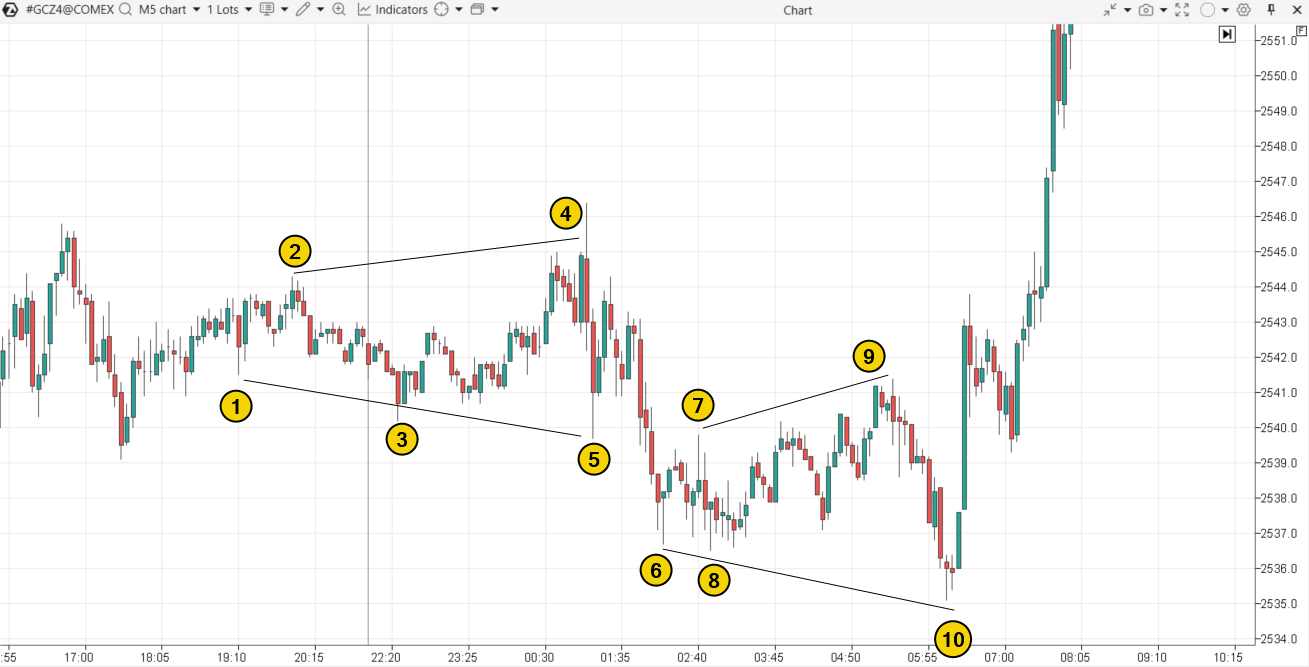
A common trait of all megaphone patterns is increased volatility.
The first instance on the chart 1–2–3–4–5 formed as the market was “waking up” during the Asian session.
The second instance 6–7–8–9–10 developed as market activity was increasing ahead of important economic news. Perhaps traders were trying to secure what they believed to be favorable positions.
What Is a Megaphone Pattern in Trading?
When interpreting the megaphone pattern, traders should consider various factors that can vary in each situation. These factors include:
- Increasing volatility. As the price moves within an expanding range, it often signals an intense battle between bulls and bears for control, particularly amid major economic news releases.
- Uncertainty about the future. The growing swings in price reflect uncertainty among market participants, making this pattern common when the market is unsure of its direction.
- Manipulative nature. In some cases, the megaphone pattern may result from manipulative actions by large players aiming to create the impression of a volatile market to lure traders into false breakouts. After several boundary expansions and false signals, large players might capitalize on the liquidity brought into the market to form their own positions in the desired direction, leaving most smaller participants in losing positions.
An example of such manipulation is seen at point 10 on the chart above. Large players could have used the day’s low to lure a mass of retail traders into short positions, only to establish long positions themselves before the release of new fundamental information.
How to Identify the Pattern
To identify the megaphone pattern, you can rely on the chart itself. However, using the following tools can make the process easier:
- ZigZag or Fractals indicators help make the extremes clearer;
- volatility indicators, for example, Bollinger Bands Bandwidth;
- other tools.
There is also a handy trick for those using the ATAS platform.
Simply open Range XV chart. The specific algorithm for creating this chart is kept secret, but this type of ATAS range chart makes it easier to spot expanding triangles (like the megaphone pattern) when you add the ATR indicator with a period of 1.
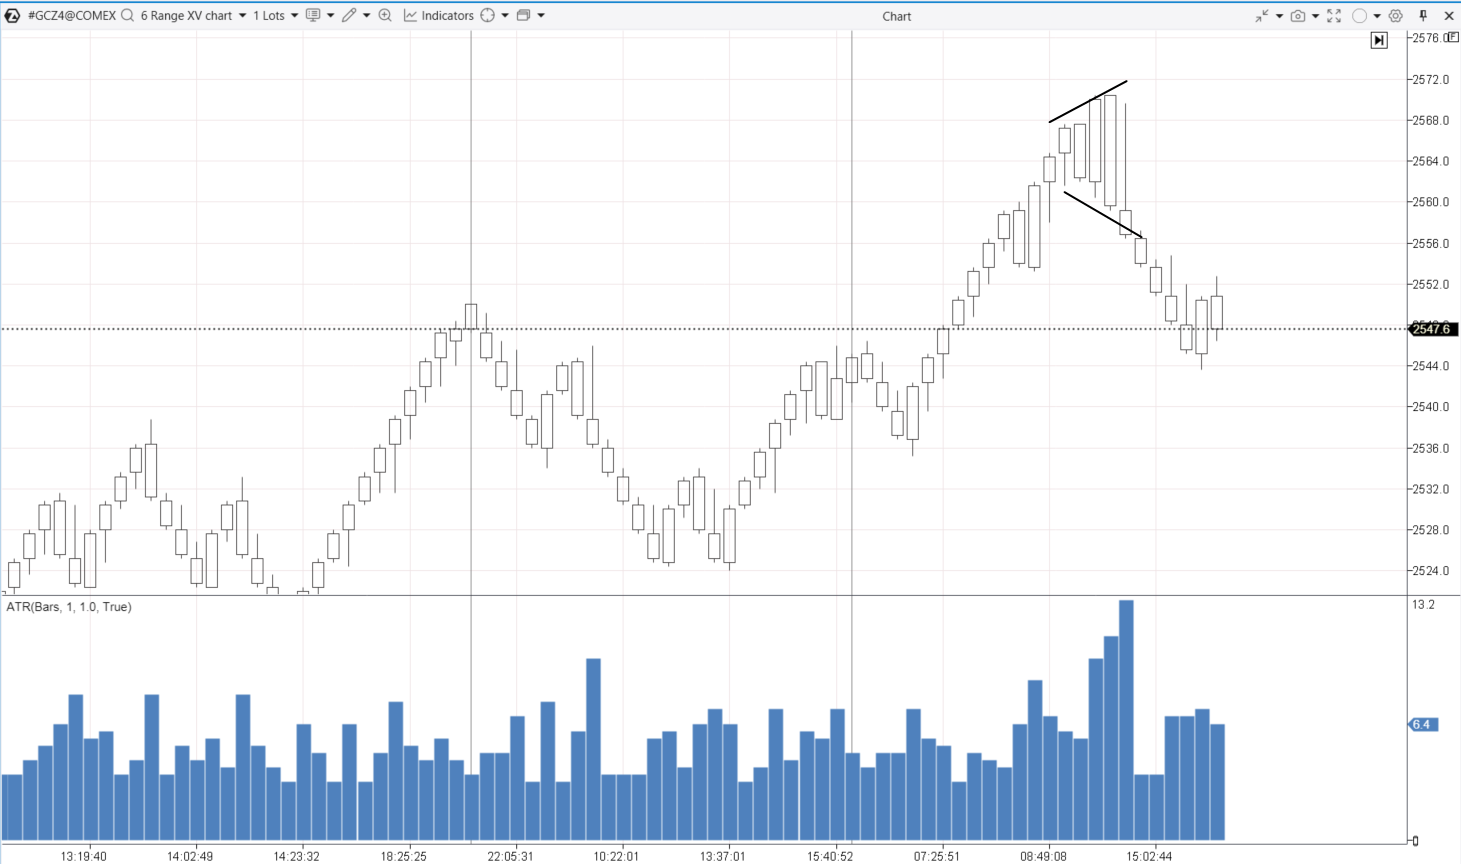
Example. The chart below shows gold futures data from the Comex exchange.
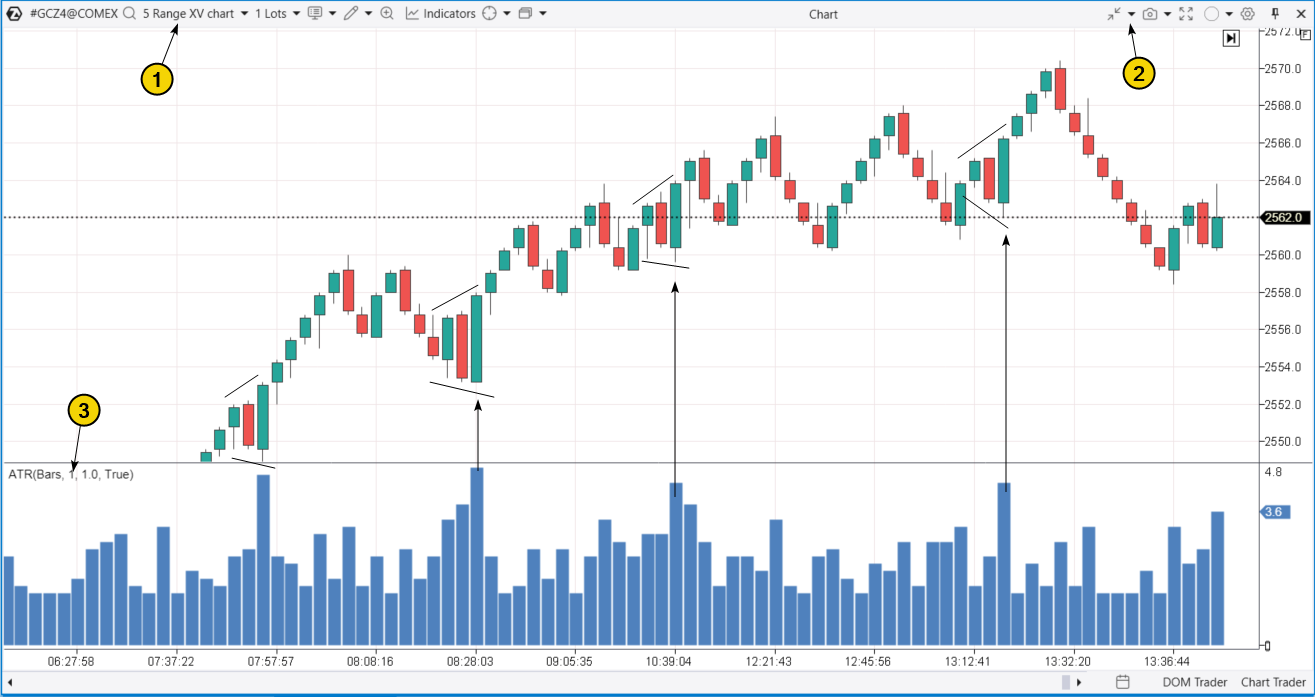
To open this chart:
- Switch the chart to Range XV mode;
- Adjust the Scale if needed (in this case, Scale = 2);
- Add the ATR indicator (Period = 1) and change the display from Line to Histogram.
The ATR spikes can help make detecting the megaphone pattern easier. This makes the Range XV chart a great tool for identifying these patterns. In the example above, the four biggest ATR bars on the chart show four megaphone patterns that formed throughout the day in the gold futures market.
Tip. You can draw a level in the area of the indicator where the peaks occur and add an alert at this level. This will enable you to receive signals from ATAS whenever a megaphone pattern with the specified amplitude appears on the chart.
The period shown on the chart above (the first half of August 20, 2024) was bullish. The price kept setting new highs with each peak, and in all four cases, the breakout from the megaphone pattern was bullish. Lower lows lured traders, who prematurely assumed the uptrend was over, into unfavorable short positions. We will revisit this chart later.
Trading Strategies for the Megaphone Pattern
As we have discussed, the megaphone pattern can indicate both market uncertainty and a strong battle between buyers and sellers. Will they be aggressive or restrained in their influence on the price? How can you predict when one side will take control?
When you spot a megaphone pattern, it is important to analyze the broader context (bullish or bearish) and the specific pattern itself to make informed decisions while managing risk.
In simpler terms, trading the megaphone pattern is similar to trading other chart patterns. Your options include:
- a reversal within the pattern,
- a breakout of the pattern (with or without a test),
- a false breakout of the pattern.
Let’s look at each strategy in detail with examples.
Reversal Trading Strategy for the Megaphone Pattern
A reversal within the pattern assumes that market indecision will persist and that neither side will take control just yet. To determine how accurate this hypothesis might be, use context analysis and additional indicators.
Example. The megaphone pattern on an E-mini S&P 500 futures chart:
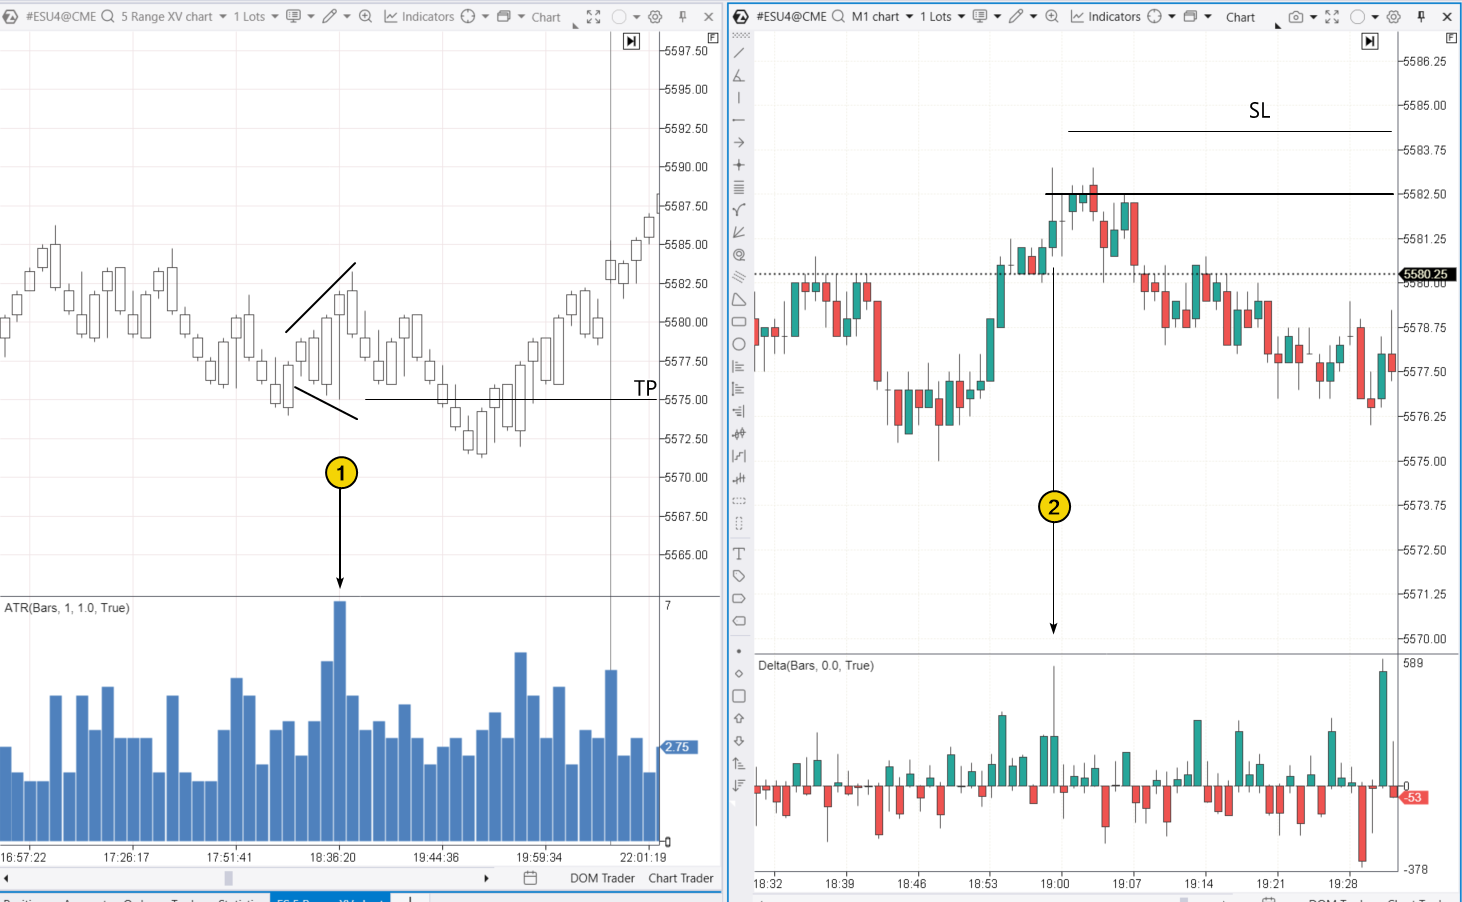
The megaphone is visible on the Range XV chart, marked by the number 1, with the ATR (1) indicator added. Let’s say a trader spots a spike in the ATR — what is the next move?
The reasoning for a sell trade (reversal within the pattern) can be found on a one-minute chart with the Delta indicator. As shown by the number 2, when a new high forms at the edge of the expanding triangle, there is an abnormal spike in positive Delta that is quickly absorbed by sellers. This could suggest the activation of sellers’ stop-losses, which is a bearish sign.
Based on this assumption, it makes sense to set the stop-loss just above the new peak and the take-profit near the lower boundary of the megaphone. In the example shown, the take-profit was eventually triggered, though not right away.
Trading Strategy for a Breakout of the Megaphone Pattern
This strategy assumes that the period of uncertainty has ended, with one side taking control and showing aggression while the other side backs down.
An example of a megaphone pattern on a cryptocurrency chart, using BTC/USD data from Binance Futures:
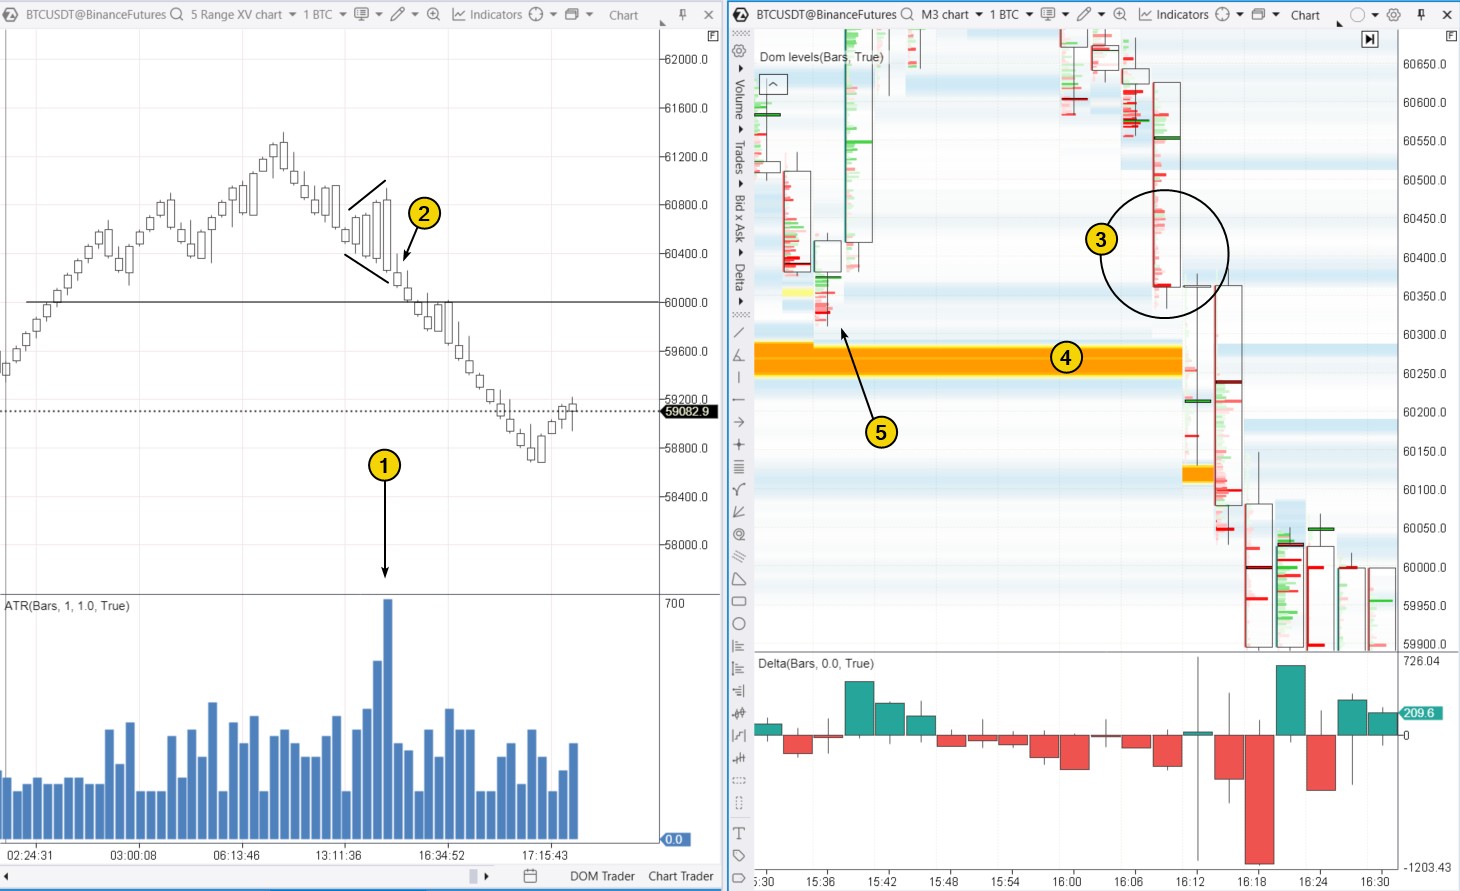
A spike (1) in the ATR indicator on the RangeXV chart highlights the presence of a megaphone pattern (2). Now the question is: should you sell on the breakout or buy in anticipation of the price returning within the pattern? To make a well-informed decision, consider the following:
- Context analysis. Notice that the megaphone pattern formed after Bitcoin’s price surpassed the psychological level of $60k. Many traders might have been optimistic about the next target being $70k. However, just because the price breaks a psychological level does not mean it will stay there.
- Indicator analysis on lower timeframes. The footprint chart on the right, with added DOM Levels and Delta indicators, shows seller aggression and buyer weakness (3) as the price approaches a significant buy limit order level (4). This level might have been removed, effectively “opening the door” for sellers to push prices lower. The move above $60k, accompanied by a large buy limit, might have been a strategy by smart money to lure retail traders into emotional buying, setting up a short position.
Let’s say you enter a short position around 60,200-60,300 on the candles between 16:12-16:18. You could place a stop-loss above 60,500 and aim for a take-profit below the breakout, at a distance at least as much as the height of the megaphone pattern.
Number (5) marks a sign of a reversal from the lower boundary of the megaphone. The footprint shows sellers getting trapped at the low of the candle that closed above the bright red clusters. It suggests the price was not quite ready to break through the large buy limit.
False Breakout Strategy for the Megaphone Pattern
The next example is from the Apple (AAPL) stock market. The chart below shows two megaphone patterns in a generally bullish market, as indicated by the moving average.
Number (1) highlights the volume profile within a candle, which has a normal distribution shape, suggesting a balance between supply and demand. In the following candle after (1), some traders seem to be trapped at the peak.
After this, the first megaphone pattern forms, with number (2) marking traders trapped at the lower boundary of the pattern — supporting the idea of an upward breakout.
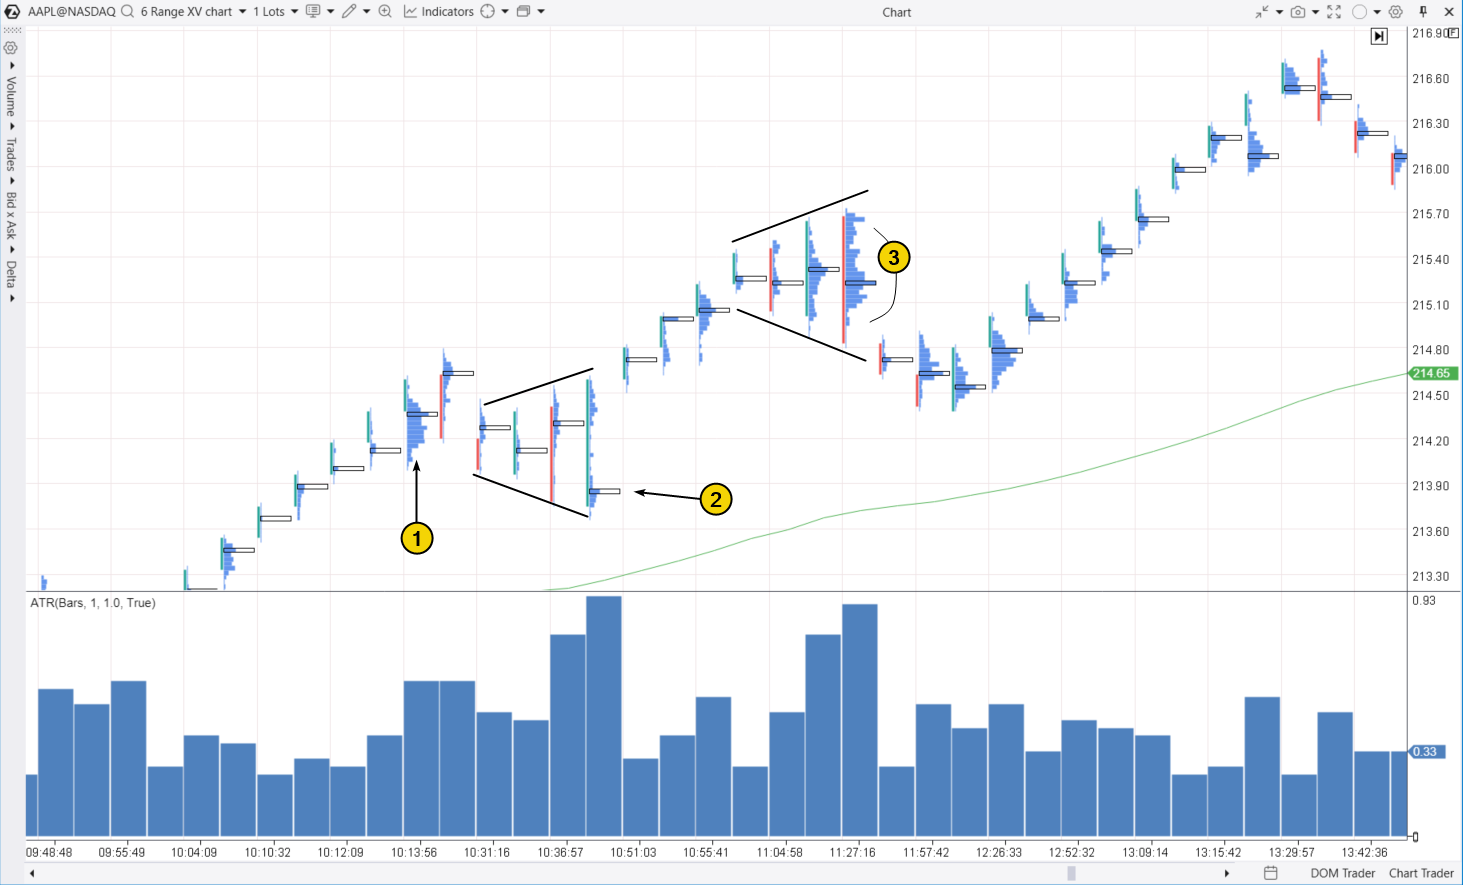
The second megaphone pattern is interesting because it also forms a profile that looks like a normal distribution, indicating agreement between buyers and sellers. Any move away from this balance might be minor.
Next, there is a bearish breakout of the second megaphone. Let’s assume a trader believes that, given the overall uptrend and the fact that the first megaphone broke upward, the bearish breakout of the second pattern might be a false one.
This assumption proves correct. The price tested a key volume level from candle (1) and then continued to rally throughout the day. Based on this logic, an ideal long entry would be at the low of the 12:26:33 candle, where the price tests the significant volume from the previous candle.
FAQ
What is a megaphone pattern in trading?
In trading, the megaphone pattern is identified on a chart by its widening price swings. This pattern is believed to indicate increasing volatility and potential market uncertainty.
Is the megaphone pattern bullish or bearish?
The megaphone can be either bullish or bearish, as it does not inherently suggest a specific market direction. It Is crucial to analyze the context and use additional tools, such as footprint analysis, to gain better insights into future price movements.
Is the megaphone a trend continuation or a reversal pattern?
The megaphone pattern can act as either a trend continuation or a reversal signal.
On the one hand, the uncertainty suggested by the pattern might be just a temporary correction within an ongoing trend, making the megaphone a continuation pattern. On the other hand, the megaphone often appears at market reversals, as seen in the earlier gold futures chart we discussed. The ATR shows increasing volatility, and the candlestick formations on the RangeXV chart outline the megaphone.
In this context, the pattern reflects increased price swings, signaling a broad and active market where smart money aims to gather enough liquidity to lock in profits, either fully or partially.
How to trade the megaphone pattern?
Since the pattern itself does not provide a clear indication of the next move, it is crucial to take a comprehensive approach to analysis. Depending on the context and trading volume indicators, you can trade the megaphone pattern either during a breakout of its boundaries or a reversal. You should also consider other factors to make informed trading decisions.
How to Learn Trading the Megaphone Pattern
As shown in the examples, the megaphone pattern is ambiguous. It does not provide a clear indication of future price direction and can be interpreted differently depending on the context and additional analytical data.
Can you profit from trading the megaphone pattern? To find out, you can simulate trades using the ATAS Market Replay tool. This feature of the ATAS platform uses historical data to recreate real-time trading conditions. It is fast, informative, and risk-free.
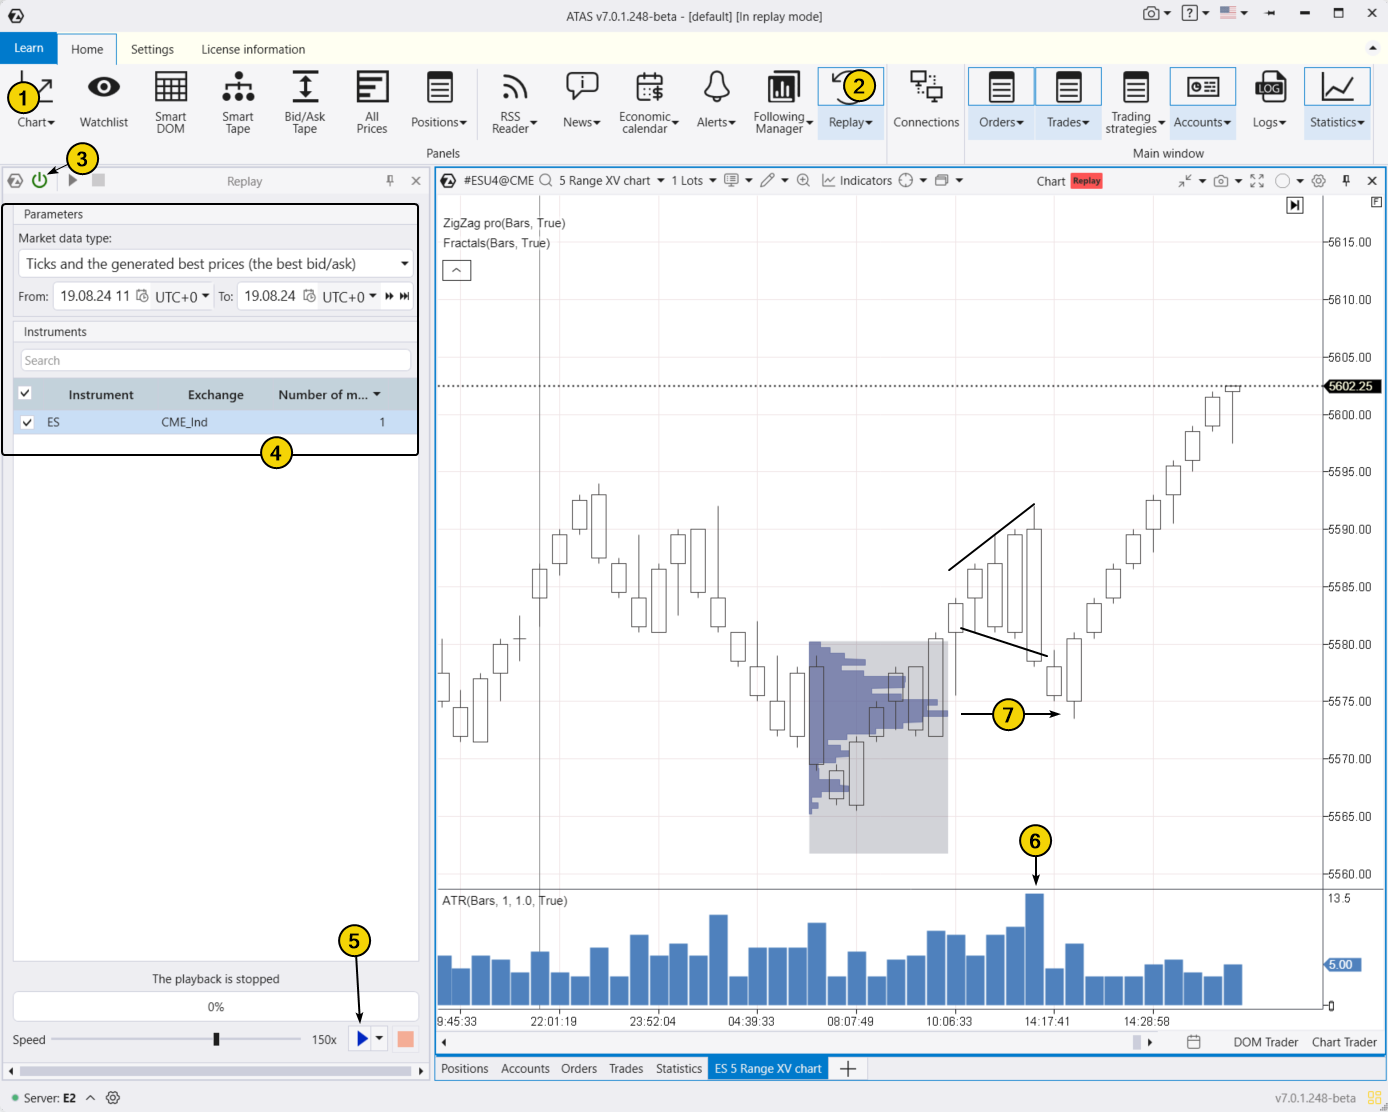
To try the simulator, download the ATAS platform for free, install, and launch it, and then:
- Open a chart of a financial instrument.
- Click on the Market Replay button in the main ATAS menu.
- Activate the Replay mode (the icon should turn green).
- Adjust settings like date and data type if needed.
- Start the replay and monitor the chart for the appearance of a widening triangle, like the megaphone pattern or other chart patterns to make your trading decision.
The example below shows how the ATR indicator signals the emergence of a megaphone pattern. In this case, trading on a false breakout would likely have been the most profitable strategy, as the price reversed after a bearish breakout from the megaphone at a key volume level indicated on the profile.
When practicing trading patterns in the Market Replay simulator, you can:
- adjust the playback speed, and pause;
- analyze footprint charts;
- use more than 400 indicators;
- use Chart Trader and other features to trade on the built-in demo Replay account and then analyze your performance;
- use drawing objects, for example, mark support and resistance levels;
- use different types of charts, such as the Range XV, which is particularly relevant to our discussion;
- use exit strategies;
- practice various techniques to spot megaphones and other patterns.
ATAS enables you to load tick-by-tick data from cryptocurrency, stock, and futures markets, providing a comprehensive basis for analyzing price and volume interactions. This helps refine your trading strategy by identifying key patterns.
Conclusions
The megaphone pattern was first mentioned by Richard Schabacker in his 1932 book, Technical Analysis and Stock Market Profits. He described it as rare and ambiguous, as it could signal either a market reversal or a continuation of the trend.
Those who use advanced volume analysis tools as supplementary information when trading the megaphone pattern may find that footprint patterns offer more reliable and comprehensive data for making trading decisions than the expanding triangle that occasionally appears on the chart.
Download ATAS. It is free. Once you install the platform, you will automatically get the free START plan, which includes cryptocurrency trading and basic features. You can use this plan for as long as you like before deciding to upgrade to a more advanced plan for additional ATAS tools. You can also activate the Free Trial at any time, giving you 14 days of full access to all the platform’s features. This trial allows you to explore the benefits of higher-tier plans and make a well-informed purchasing decision.
Do not miss the next article on our blog. Subscribe to our YouTube channel, follow us on Facebook, Instagram, Telegram or X, where we publish the latest ATAS news. Share life hacks and seek advice from other traders in the Telegram group @ATAS_Discussions.
Information in this article cannot be perceived as a call for investing or buying/selling of any asset on the exchange. All situations, discussed in the article, are provided with the purpose of getting acquainted with the functionality and advantages of the ATAS platform.


