
The bullish harami and bearish harami are reversal patterns in technical analysis, made up of two Japanese candlesticks:
✓ the bullish harami suggests that the trend will shift to an upward movement;
✓ the bearish harami indicates that prices may move downward.
In this article, we will examine how effectively classic candlestick patterns can be used in modern trading.
Read more:
What Is Harami?
The pattern’s name comes from the Japanese word はらみ (harami), which literally means “pregnancy” or “a body in the womb.” This refers to the way the pattern visually resembles a pregnant woman, with the larger candle symbolizing the mother’s body and the smaller one inside representing the child.
A bullish harami is made up of two candles:
- the first is a large bearish candle;
- the second is a smaller bullish candle that opens and closes within the body of the previous one.
A bearish harami is the reverse:
- the first is a large bullish candle;
- the second is a smaller bearish candle that also opens and closes within the body of the first.
Below are examples of bearish (1) and bullish (2) harami patterns that formed in the fall of 2023 on Amazon (AMZN) stock’s daily chart.
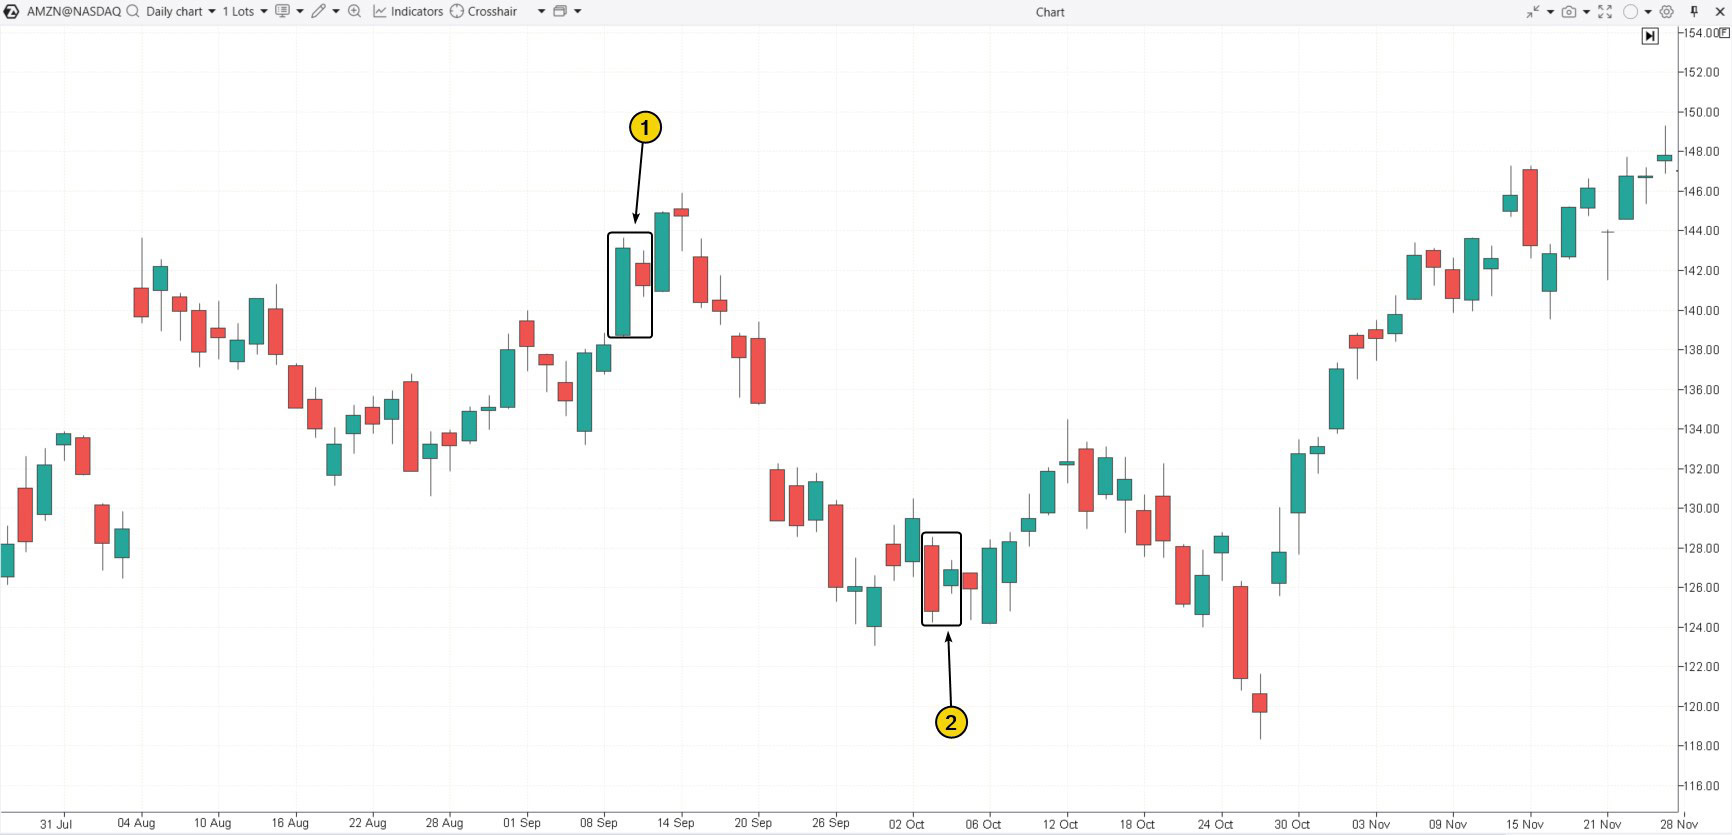
The chart provides sufficient confirmation of the pattern’s effectiveness:
- Shortly after the bearish harami appeared, a downtrend formed that pushed the price below $125, reaching the lowest levels in several months;
- Shortly after the bullish harami appeared, a sequence of five bullish candles emerged, leading to a test of the bearish gap from September 21.
Please note that applying standard rules for trading harami patterns can trigger stop-losses. But let us take things step by step.
The Meaning of the Harami Pattern for Traders
The harami pattern suggests a potential trend reversal, where the smaller candle forms within the body of the previous larger candle.
The main risk is that the small candle may not signal a full reversal but rather a temporary pullback, with the trend possibly continuing afterward.
How can you tell which outcome is more likely? Analyzing volume data with professional footprint charts can provide valuable insight.
What Is a Harami Cross Pattern?
The harami cross consists of two candles:
- the first is a large candle that fully contains the second;
- the second is a doji, a candle where the opening and closing prices are nearly identical (forming a cross).
An example of a harami cross. In September 2024, Tesla’s (TSLA) daily chart showed a harami cross pattern (1), where the first candle is a wide bearish one, and the second, located inside, closely resembles a doji.
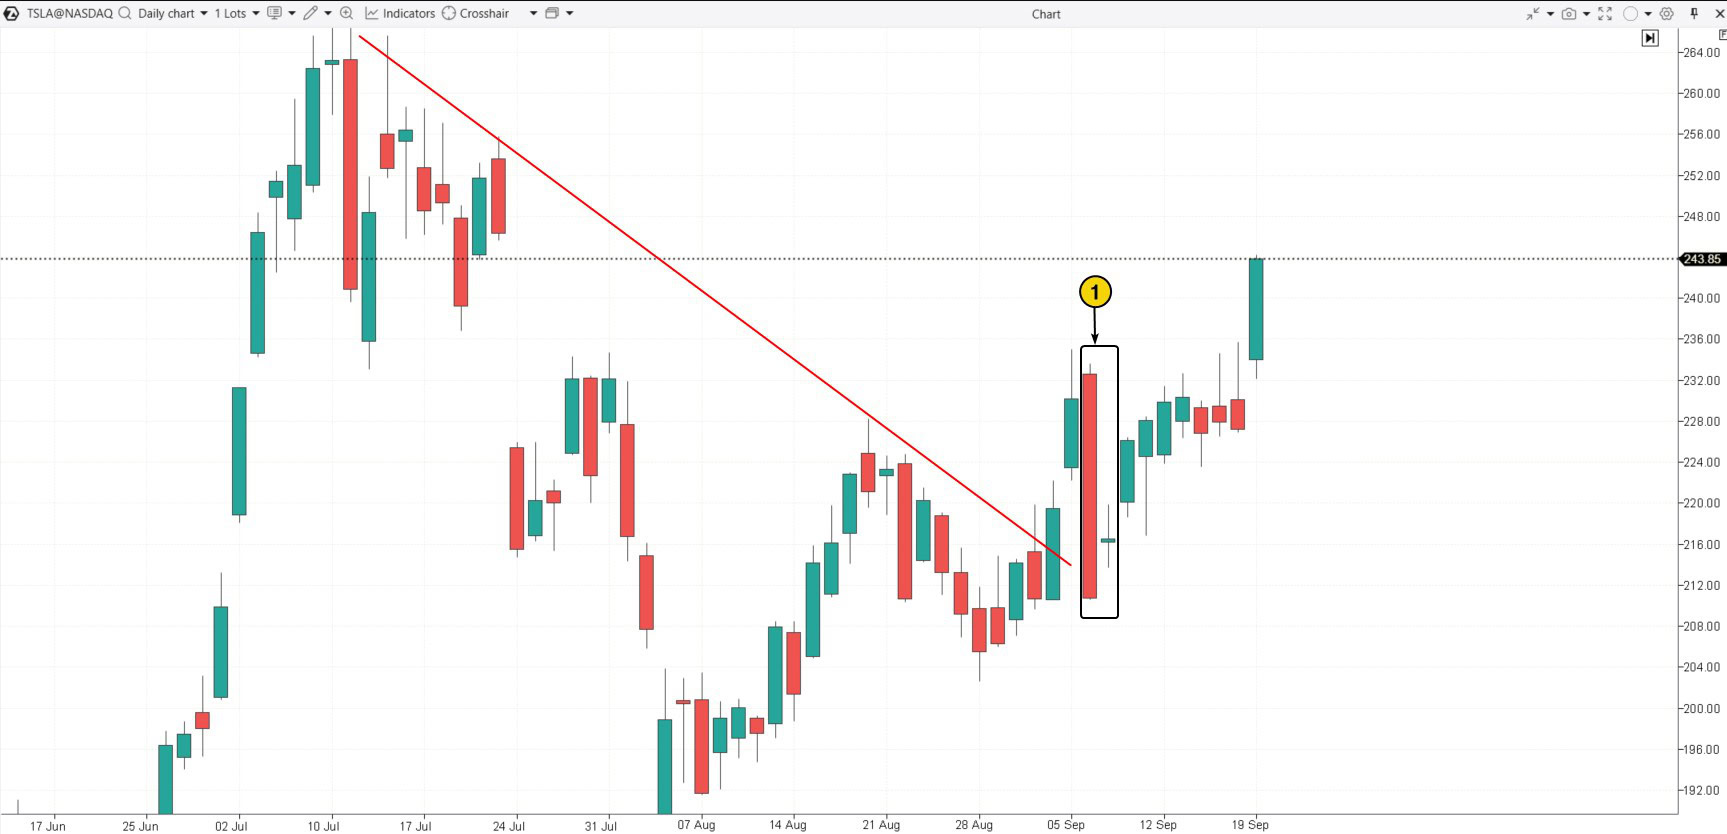
Bears had made some progress, as indicated by the red downtrend line. However, the appearance of the harami cross — despite not forming at the end of the downtrend — hinted at a possible upward movement.
This time, the analysts’ expectations were correct: the price did not fall below the doji but instead began to rise, leading to a bullish breakout above the resistance level near $133.
How to Trade Bullish and Bearish Harami Patterns
☑ Classic rules for trading the bullish harami:
- Wait for the pattern to appear after a period of declining prices;
- Enter a long position when the high of the small candle is broken;
- Place a stop-loss below the low of the first large candle;
- Ensure the profit target is greater than the risk taken.
☑ Classic rules for trading the bearish harami:
- Spot the pattern after a period of rising prices;
- Enter a short position when the low of the small candle is broken;
- Set a stop-loss above the high of the first large candle;
- Ensure the profit target is greater than the risk taken.
Now you can see why following these classic trading rules for the bullish and bearish harami triggered stop-losses on the AMZN chart earlier (although it could have also led to a profitable trade).
But could harami setups prove to be more effective in the long run?
How Successful Is the Harami Pattern?
Research by renowned candlestick expert Thomas Bulkowski reveals a relatively low success rate for trading harami patterns on daily stock charts:
✓ Bullish harami pattern:
- Reversal probability: 53%.
- Tip. The bullish harami that appear near a 4-month low yield the best results.
- Best outcome: a rise of 4.05%
✓ Bearish harami pattern:
- Reversal probability: 47%, meaning the probability of the bullish trend continuing is higher.
- Tip: The bearish harami that appear near the upper boundary of a trading channel perform best.
Studies conducted by CandleScanner on S&P500 daily stock charts from 1995 to 2015 provide more promising results.
✓ Bullish harami pattern:
- Total patterns found: 27,862, with an occurrence frequency of 4.4%.
- False signal probability: 19% within the next 5 days.
- Chance of achieving strong results: 37% within the next 5 days.
- Over a 10-day period, the results show a slight improvement.
✓ Bearish harami pattern:
- Total patterns found: 33,846, with an occurrence frequency of 5.3%.
- False signal probability: 16% within the next 5 days.
- Chance of achieving strong results: 29% within the next 5 days.
- Results tend to improve over a 10-day period.
According to Candle Scanner statistics, traders are more likely to see positive outcomes rather than losses when trading the harami pattern.
Harami Pattern and Trading with Footprint Charts
Bearish and bullish harami patterns involve trading against the trend, making it essential to arm yourself with additional tools. The best approach is to use cluster charts, which offer rich insights and allow you to decode the market signals hidden within the harami candles.
Example of Trading a Bullish Harami Pattern in the SPY Market
SPY is a popular instrument that tracks the fluctuations of the S&P 500 index. On September 6 and 9, two candles formed a bullish harami pattern on the chart.
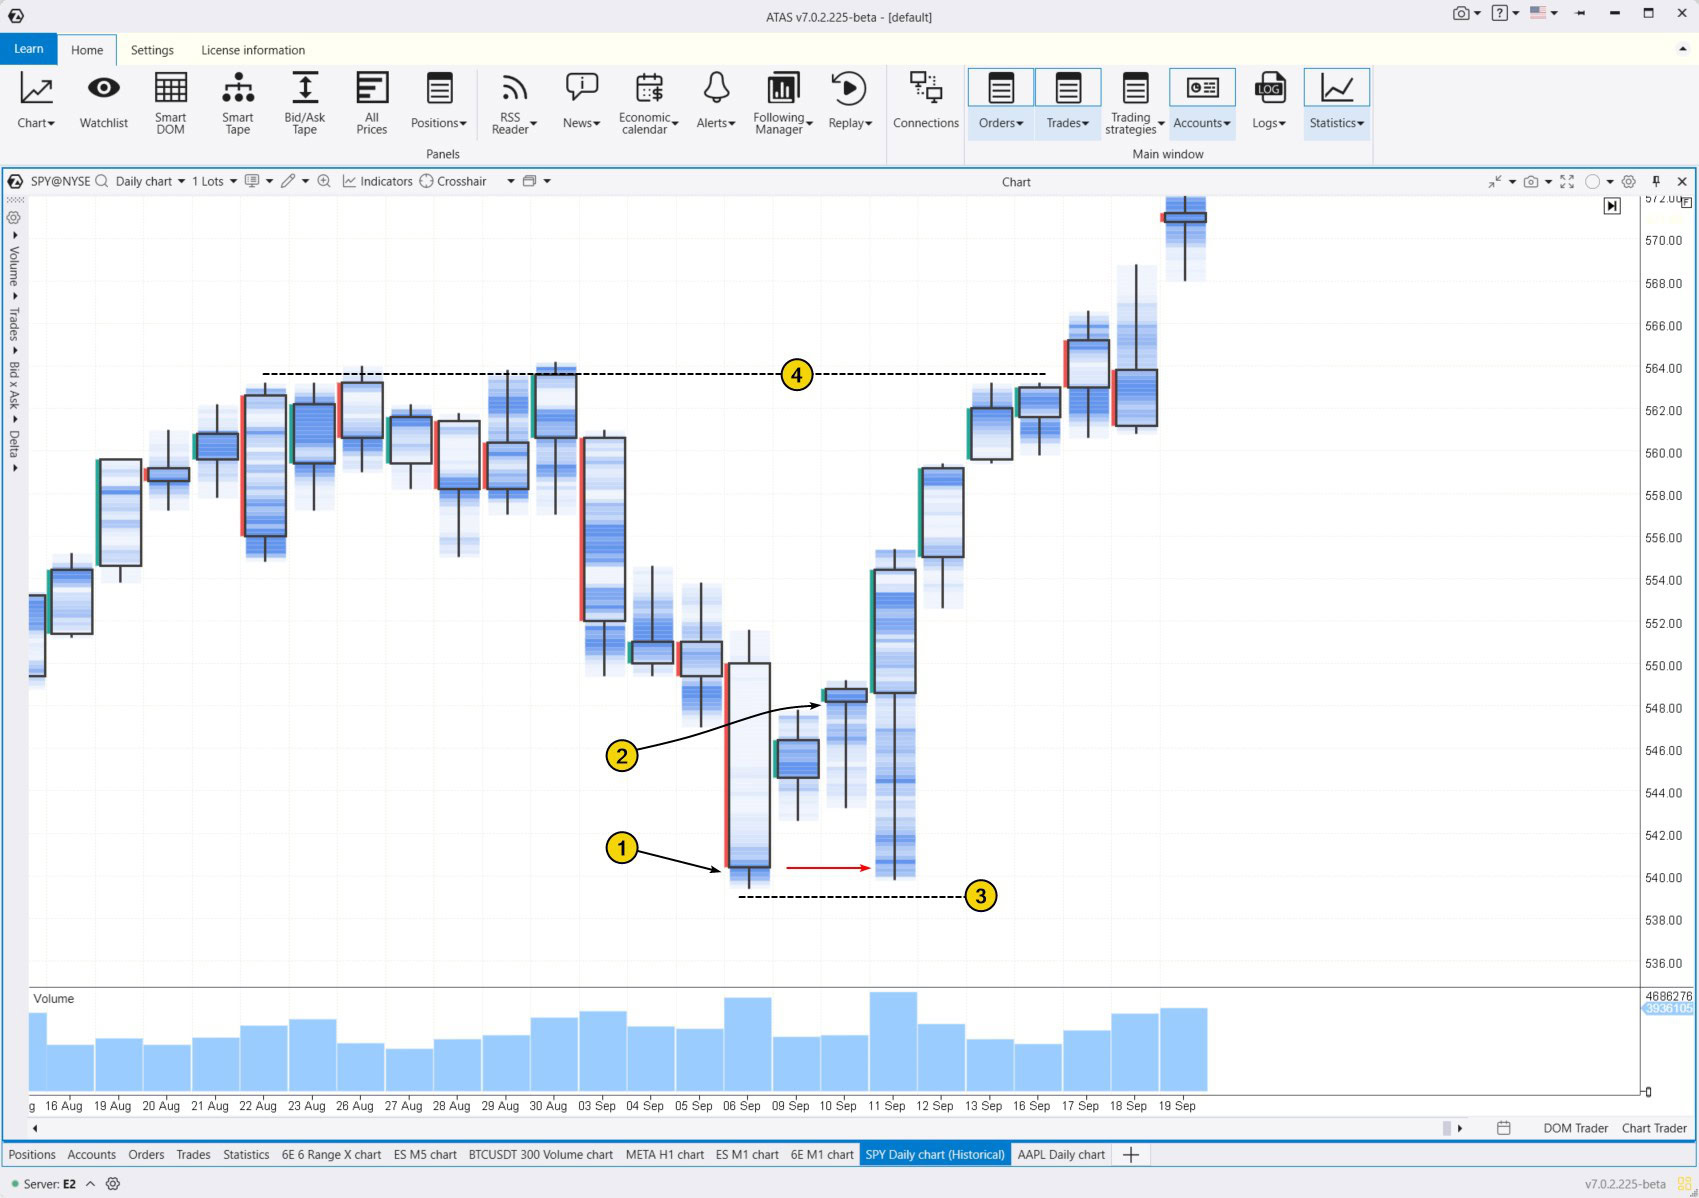
The main volume of trades was recorded at the lower part of the September 6 candle. The start of trading at higher levels on September 9 indicated the formation of a bear trap — a signal that increases the chances of a reversal from the bottom.
In this case, trading the bullish harami using classic rules proved to be profitable:
- entering a long position when the second candle was broken out on September 9 (2);
- setting a stop-loss below the low of the first candle from September 6 (3);
- a take-profit is at the previous resistance level (4).
The red arrow points to the testing of a cluster of large volumes on September 11, formed around the low of the September 6 candle. For a cluster chart analyst, this test could have provided a long entry setup with the same profit target but significantly lower risk.
To gain more reliable confirmations, you should:
- switch the chart from candlestick to cluster;
- select the Volume/Volume footprint mode;
- in the cluster settings (Ctrl+S), overlay the candle and adjust the thickness of the elements on the chart.
How to Use the Bearish Harami Pattern in Trading
On May 21 and May 22, 2024, two candles formed a bearish harami candlestick pattern on the daily chart for Netflix (NFLX).
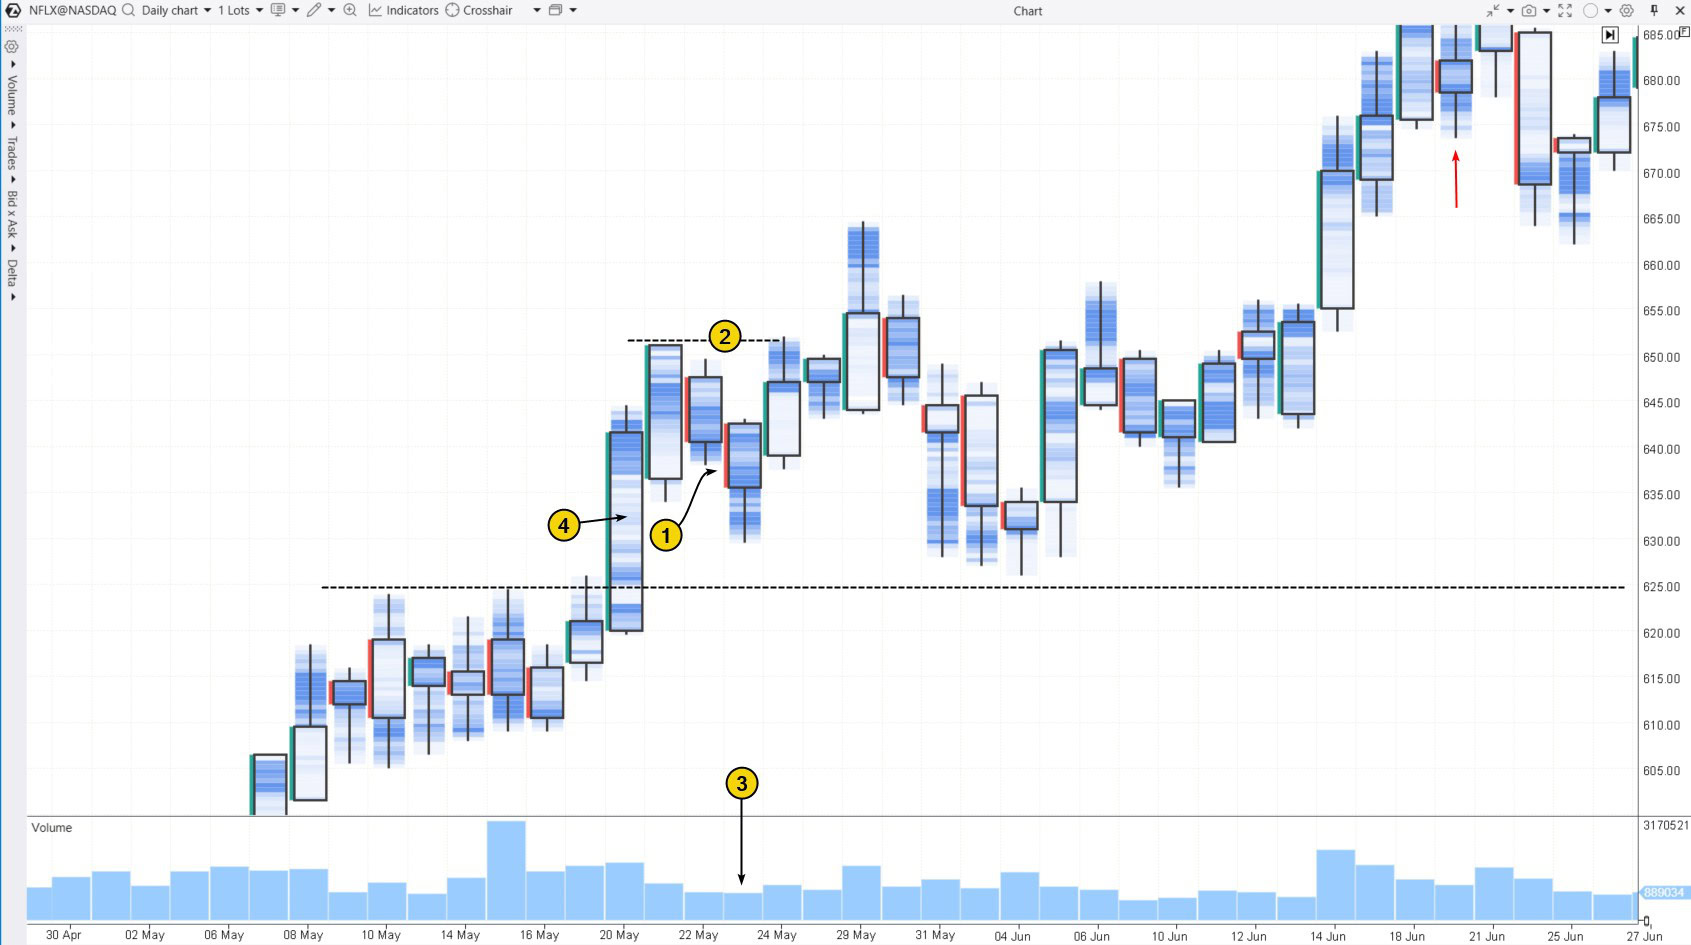
When trading this pattern according to classical rules, a logical approach would be to:
- open a short position during the breakout of the second small candle (1);
- set a stop-loss above the large candle (2);
- identify the nearest target for profit at the previous resistance level around $625, which was broken.
The stop-loss was triggered the next day, but the profit target was not reached for several days. In this case, the bearish harami indicated only a short-term pullback within a developing uptrend.
Volume analysis could have helped reduce the risks associated with opening a short position. On May 23, the decline occurred on low volumes (3), signaling a lack of sellers (No Supply, VSA). They were also clearly in the minority during the breakout on May 20, as indicated by the lighter clusters within the candle (4). This zone remained intact from May 31 to June 4.
The red arrow marks a pattern that could have become a bearish harami if the lower shadow had been shorter.
FAQ
What type of pattern is harami?
The harami is a reversal pattern that signals a possible change in the trend’s direction. It can be either bullish or bearish.
What is a bearish harami?
A bearish harami is a reversal pattern on a candlestick chart. It consists of a large bullish candle followed by a smaller bearish candle contained within the first one.
What is a bearish harami cross?
A bearish harami cross is a variation of the bearish harami pattern where the second candle is a doji, meaning its opening and closing prices are almost at the same level.
What does the harami pattern indicate?
The harami pattern suggests a potential reversal of the current trend, signaling a shift in market sentiment. A bearish harami points to a possible transition from a bullish to a bearish trend, while a bullish harami indicates the opposite.
What is the harami pattern in crypto?
The classic harami pattern is most effective on daily candlestick charts where gaps can occur. However, it is less applicable to the cryptocurrency market since coins trade 24/7.
Is the bullish harami pattern reliable?
The reliability of the bullish harami pattern is questionable. While CandleScanner data shows a false signal in 19% of cases, research by Thomas Bulkowski suggests it fails 47% of the time. To improve trading accuracy with harami patterns, it is recommended to use additional tools and approaches, such as footprint pattern analysis.
How to Trade Bullish and Bearish Harami Patterns Profitably
To trade harami patterns more effectively, use professional volume analysis tools such as:
You can test how successful your harami and cluster trading strategies could be by using the ATAS Market Replay simulator. This platform module uses historical data to recreate real-time trading conditions, enabling you to sharpen your trading skills without any financial risk.
To try the simulator, download the ATAS platform for free, install, and launch it, and then:
- Open a chart of a financial instrument.
- Click on the Market Replay button in the main ATAS menu.
- Activate the Replay mode (the icon should turn green).
- Adjust settings like date and data type if needed.
- Start the playback and monitor the appearance of the candlestick pattern. Analyze the footprints to learn how to find strong signals for entering a position.
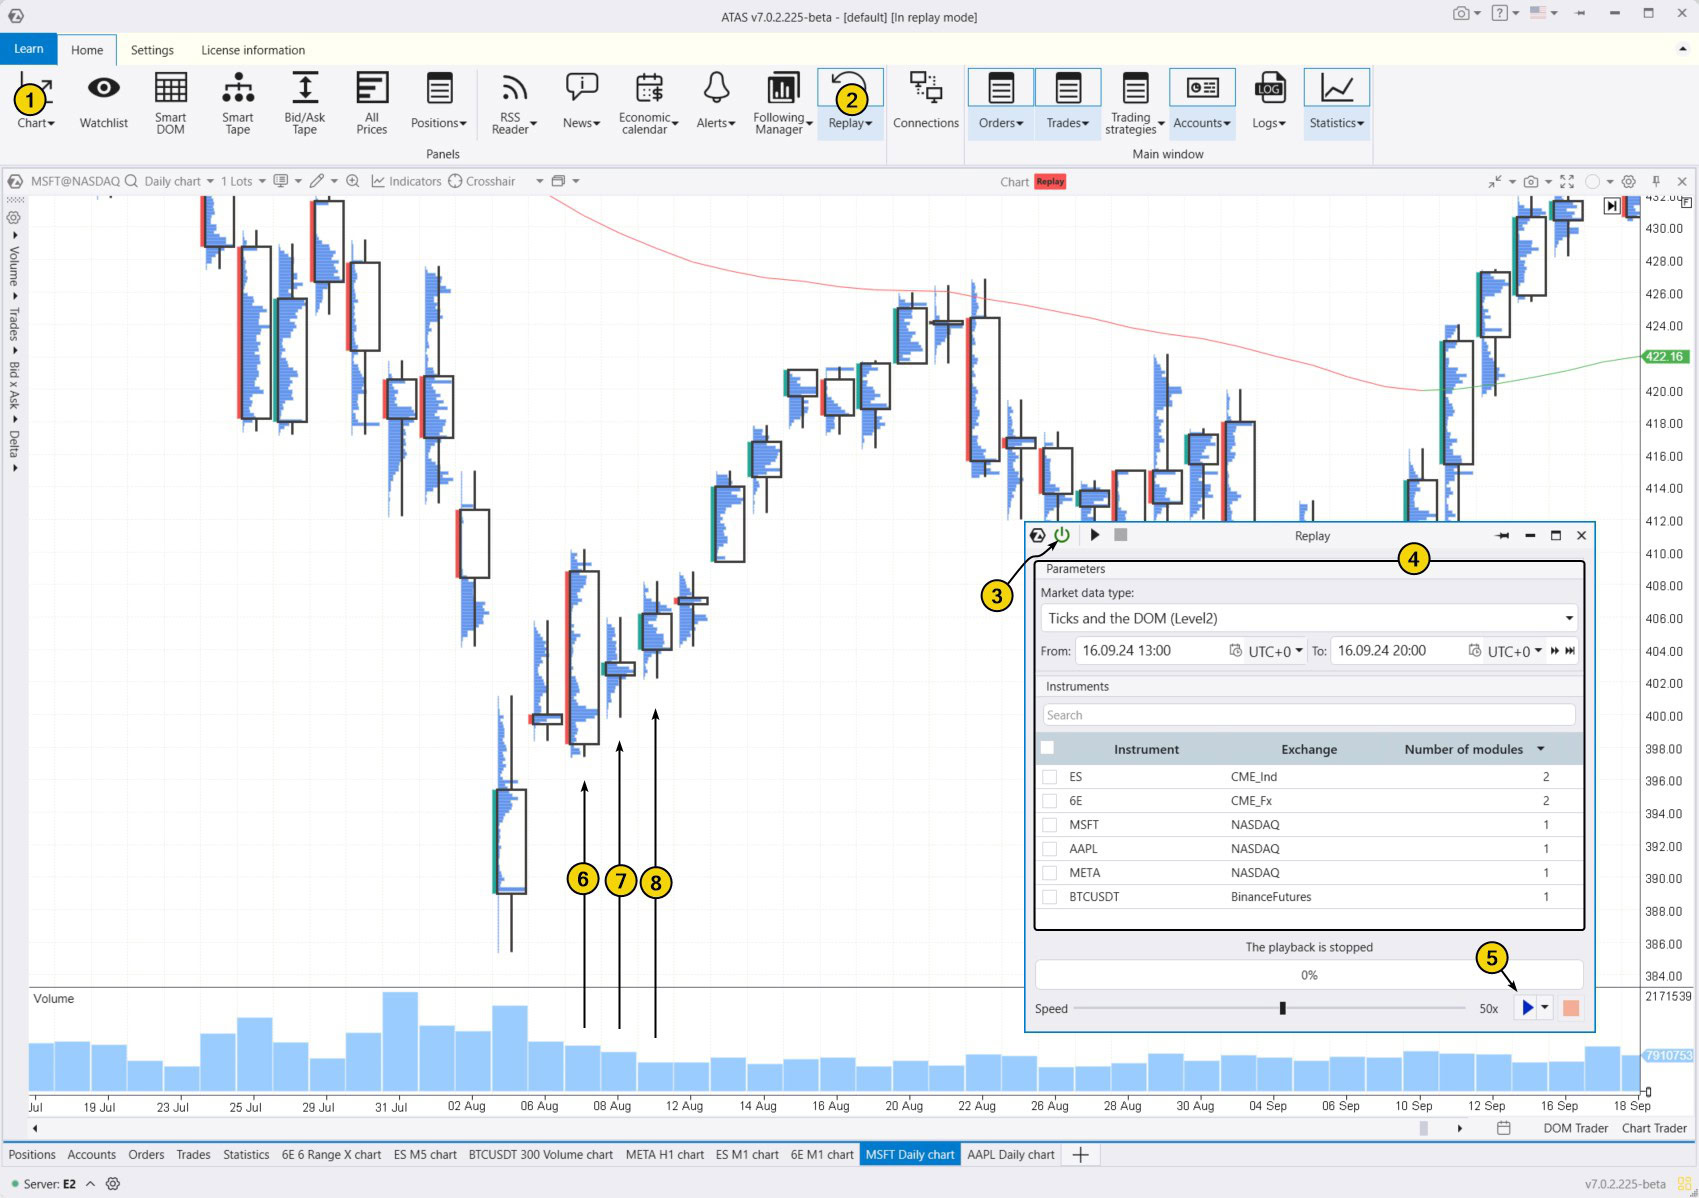
The chart shows a price reversal in Microsoft (MSFT) stock, with candles 6 and 7 marking a bullish harami pattern. Ideally, candle 6 should have formed at the bottom of the decline for a perfect setup.
- Following the classic rules for trading the harami here would likely have been profitable;
- The low of candle 7 tests the key volume level from candle 6;
- The low of candle 8 tests the volume level from candle 7.
This example highlights how developing skills in cluster chart analysis can elevate your candlestick pattern trading, even if you find these patterns outdated.
Conclusion
The harami pattern signals a potential trend reversal when a smaller second candle forms within the body of the first. While this can suggest a shift in market momentum, it is not always the case — research shows that 16% to 53% of harami trades can result in losses.
Advantages of the harami candlestick pattern
✔ Profit potential. Harami patterns can offer early entry points at the start of a new trend.
✔ Frequency: CandleScanner data shows that harami patterns appear on daily charts 4-5% of the time, making them fairly common in candlestick analysis.
Disadvantages of the harami candlestick pattern
✘ Ambiguity. When this pattern appears, it often signifies a temporary pause in the trend rather than a full reversal.
✘ Unclear profit targets. Traditional trading literature suggests identifying support and resistance levels or calculating profit targets based on stop-loss size. This can be particularly challenging for beginners.
✘ Large stop-loss levels. If the first candle in the harami pattern is too wide, it may lead to excessively large stop-loss placements.
Experience shows that modern methods like cluster analysis are far more effective than relying solely on harami and other Japanese candlestick patterns. This highlights the importance of using footprint charts and other volume analysis tools as the main resources for making well-informed trading decisions, rather than just supplementary tools.
Download ATAS. It is free. Once you install the platform, you will automatically get the free START plan, which includes cryptocurrency trading and basic features. You can use this plan for as long as you like before deciding to upgrade to a more advanced plan for additional ATAS tools. You can also activate the Free Trial at any time, giving you 14 days of full access to all the platform’s features. This trial allows you to explore the benefits of higher-tier plans and make a well-informed purchasing decision.
Do not miss the next article on our blog. Subscribe to our YouTube channel, follow us on Facebook, Instagram, Telegram or X, where we publish the latest ATAS news. Share life hacks and seek advice from other traders in the Telegram group @ATAS_Discussions.
Information in this article cannot be perceived as a call for investing or buying/selling of any asset on the exchange. All situations, discussed in the article, are provided with the purpose of getting acquainted with the functionality and advantages of the ATAS platform.


