
Crude oil futures are a unique market, distinct from others like gold, stocks, currency futures, and cryptocurrencies. It can serve as either a primary market for applying trading strategies or a supplementary one, providing a broader range of trading signals. This article is designed to assist all crude oil futures traders, whether you are creating strategies from scratch or seeking effective professional tools to enhance your trading efficiency.
Read more:
Crude oil futures trading and stock indices. Trading comparison
Futures are versatile financial instruments that can use crude oil or stock indices as the underlying asset. For more details, check out the article: What are Futures?
Crude oil futures and stock indices are popular tools for traders due to their:
- high liquidity,
- volatility,
- suitability for both fundamental and technical analysis (in other words, finding opportunities for intraday profits).
Additionally, futures are crucial not only for speculative trading but also for risk management by large companies, hedge funds, and others.
Crude oil futures
There are two primary types of crude oil, whose futures contracts are traded on global exchanges: Brent (more common in Europe) and WTI (West Texas Intermediate).
For users of the ATAS trading and analytical platform, futures trading is available through broker connections:
- WTI – on the NYMEX exchange, part of the CME group;
- Brent – on the Moscow Exchange.
For more details, check out the article: What are Oil Futures?
Stock Index Futures
Currently, ATAS users have access to trading futures on the following stock indices:
Trading crude oil futures can diversify the strategies of traders who primarily focus on stock indices. This is because stock indices often move in the same direction (correlated), while oil futures are relatively independent of them. It is more accurate to say that there is a connection between these two assets, but it can vary over time and is not always stable.
Suppose a trader prefers trading breakouts, aiming to profit from sudden price movements in futures. Sometimes, there might be a lull in the stock market, while the oil market is experiencing significant fluctuations, offering profitable opportunities. This way, the trader can avoid having idle capital by using it to trade oil futures. Additionally, the trend in the oil market might be so strong that trend-followers may not want to miss out, even if the oil market is not their primary focus.
How to read crude oil contract specifications
Understanding the standardization of contracts used in derivative crude oil markets is essential for planning a trading strategy. Let’s delve into the basics using an example.
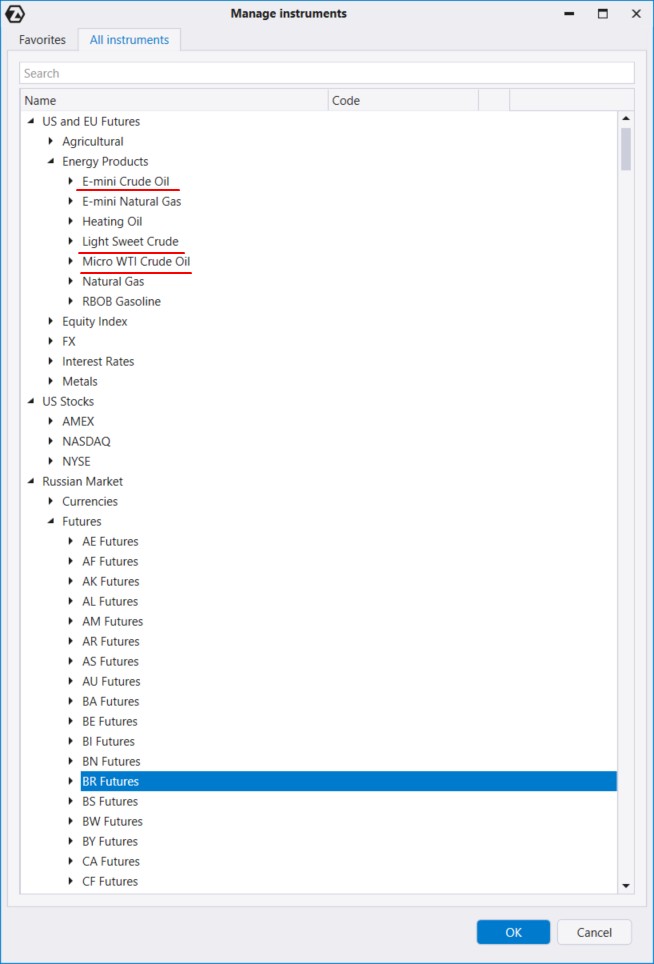
In the instrument manager, go to the category US and EU futures / Energy Products to open a price chart for oil futures traded on NYMEX:
- CL – standard Light Sweet Crude futures contract;
- QM – E-mini contract;
- MCL – Micro WTI contract.
To open a chart for Brent crude oil futures on the MOEX exchange, select: Russian market / Futures / BR.
You will be able to choose both Continuous contracts (e.g., CL) and those with a fixed expiration date (e.g., CLX7). The details are explained in our article: What is a Continuous Futures Contract?
Let’s explore the differences using screenshots from the AMP Futures broker’s website. Below are the specifications for futures contracts (Futures Contract Specifications):
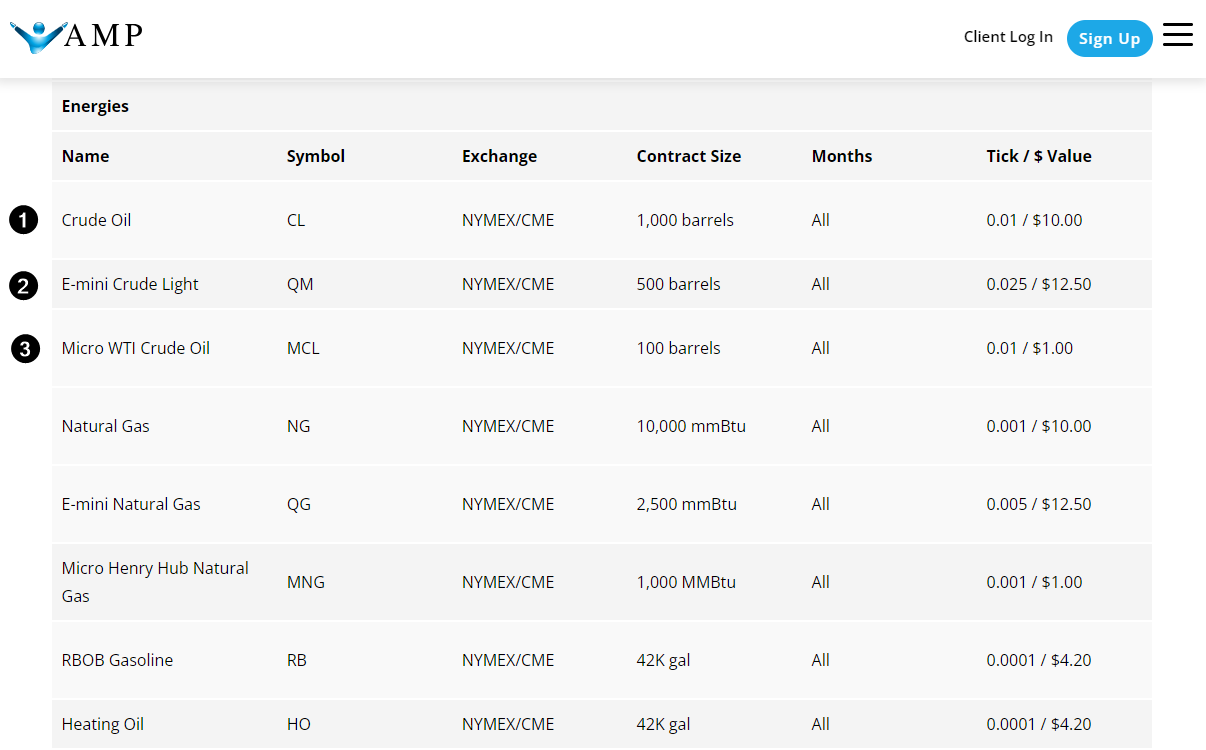
The differences include:
- contract size: for example, 1 standard CL contract equals 1,000 barrels, while a micro contract is 10 times smaller;
- tick value: in a standard CL contract, a 1-tick price change results in a $10 change in the contract’s value, whereas in a micro contract, it is 10 times less.
More information for planning your crude oil futures trading can be found on the margin requirements page (Futures Margin Calculator List):
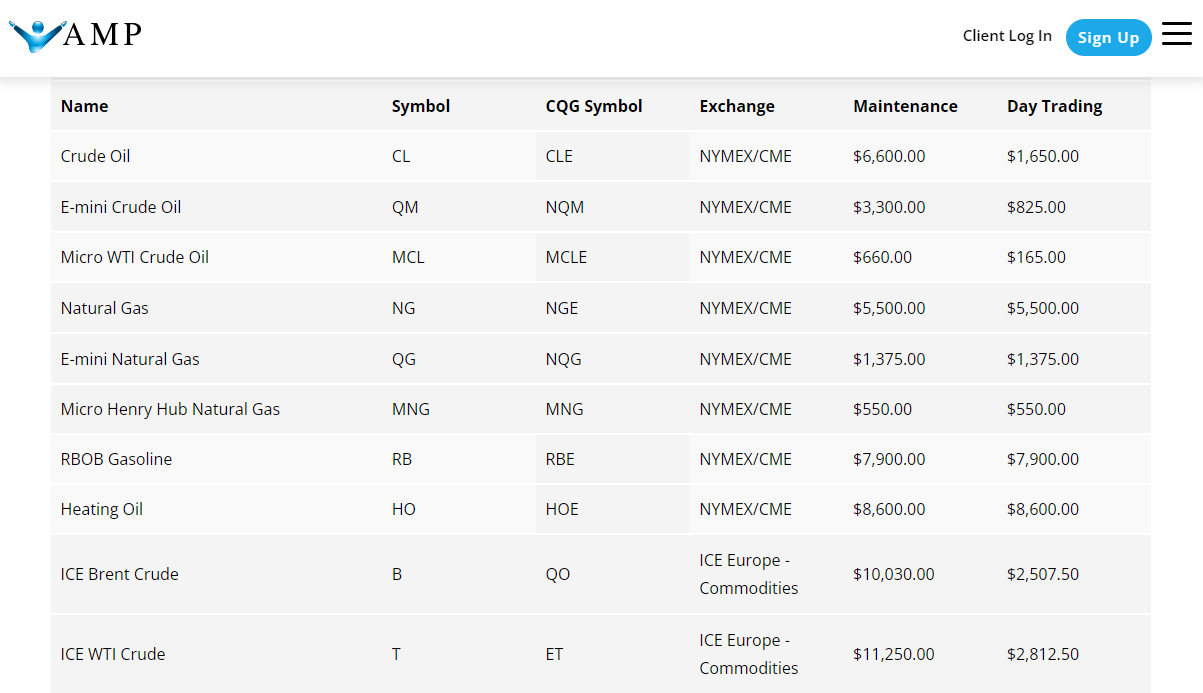
As shown in the table above, to trade crude oil futures:
- and hold the position overnight: you will need at least $6,600 in your account for a standard CL contract, while a micro MCL contract requires 100 times less;
- intraday: you will need at least $1,625 in your account for a standard CL contract and only $165 for a micro MCL contract.
Of course, brokers have the right to change their service conditions, so it is always best to check for the most current requirements. However, the information on the specifications pages gives a good indication of the capital demands for trading crude oil futures.
In fact, if a trader has a few hundred dollars available, they can try trading micro-futures, which have minimal requirements for intraday trading of crude oil. Moreover, if a trader has access to futures on stock indices through their broker, they are likely to have access to crude oil futures as well.
Crude oil futures – strategy
By carefully studying historical price movements on the chart, analyzing the interaction between price and major levels on the profile, and using their unique market perspective, an analyst and trader can identify the foundations for developing a crude oil futures trading strategy, such as one based on rebounds. What is the idea behind it? Let’s break it down.
Let’s look at a 5-minute chart of the micro crude oil futures (MCL) from the NYMEX exchange:
The Market Profile & TPO indicator has been added to the chart.
The chart covers a 4-day period.
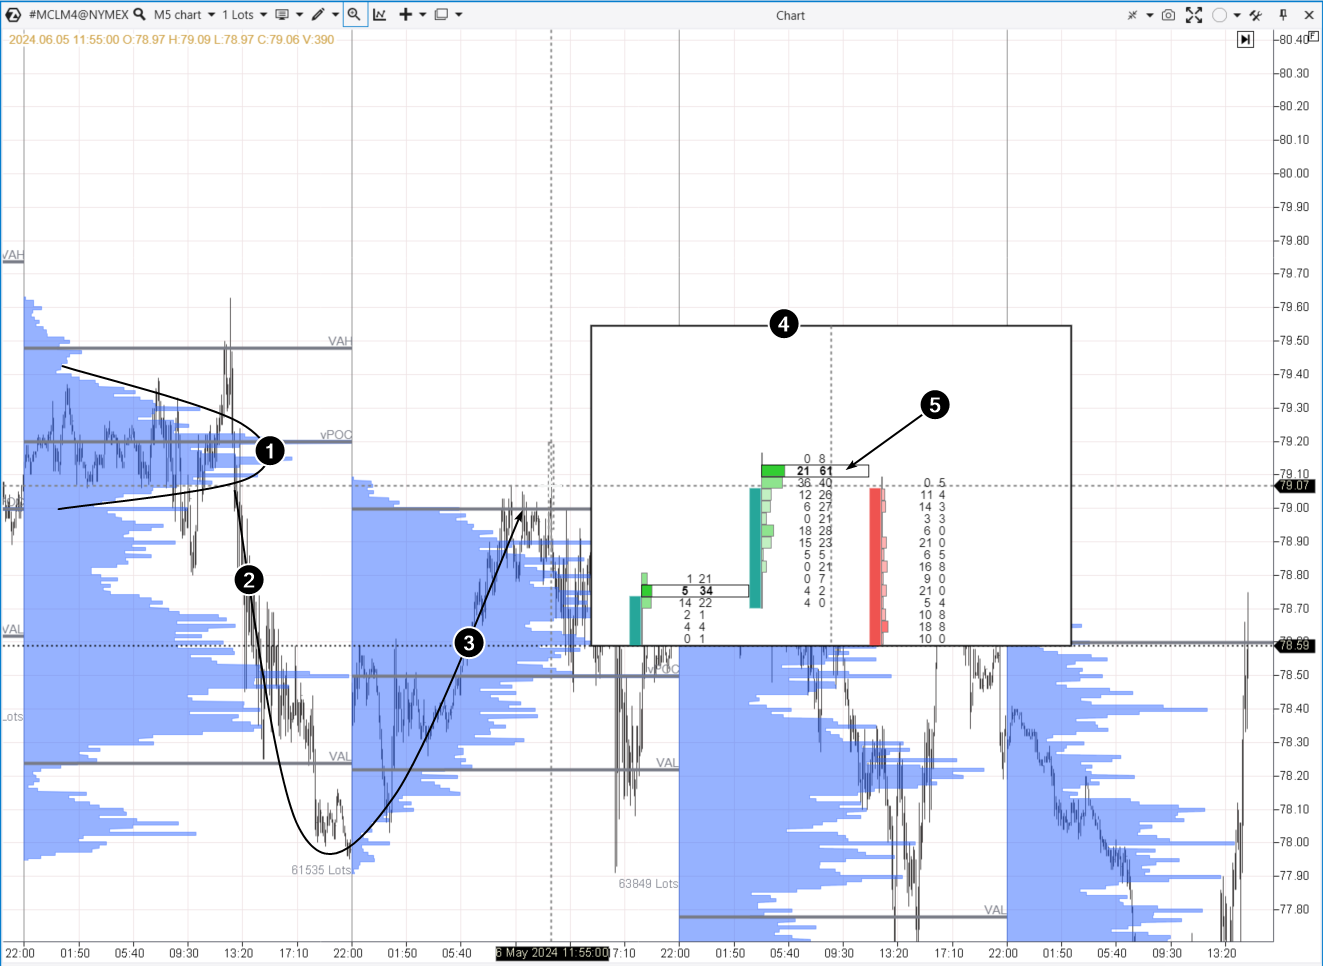
On the first day, a high-volume zone formed (between $79.10 and $79.20 per contract), indicating a temporary balance of supply and demand – marked as number 1.
Subsequently, due to various factors, the price dropped (2) – sellers disrupted the balance with their activity.
However, on the following day, buyers managed to recover from the previous day’s drop, pushing the price back up to the high-volume zone (1) and surpassing the $79 mark per futures contract. This could have provided an opportunity to look for confirmations that the price would reverse downward from the high-volume zone boundary.
To look for confirmations, you can use the Magnifier function. Press the M key and hover your mouse to see the details (4) of price and volume behavior when the price exceeds the critical level of $79 per crude oil futures contract.
In the opened window, you can see that despite buying 61 contracts, the price started to fall. This inability of the price to rise, even with active buying, is a bearish sign. It might indicate that a major player is opening short positions with limit sells, or it could be the influence of the previous day’s level, where a significant number of trades took place.
Suppose a trader saw these signals and decided to open a short position. How much could they have earned?
Let’s say:
- short entry price = $79.05
- target price = $78.50
- stop-loss price = $79.40
Then:
- risk taken = 79.40 – 79.05 = 35 ticks. 1 tick = $1. Then the risk = $35.
- Potential profit = 79.05 – 78.50 = 55 ticks. Therefore, the reward is $55.
Since the price dropped to the take-profit level, the calculation was accurate.
Suppose the account balance was $500 at the time of the trade. Then the account increased by 11%, and the risk was ≈ 7% (which is extremely aggressive, as classic trading principles suggest risking no more than 2-3% of capital on a single trade).
Crude oil futures strategy. Another example:
Let’s consider the same 5-minute chart of micro crude oil futures, but this time the strategy offers an opportunity to trade a long position.
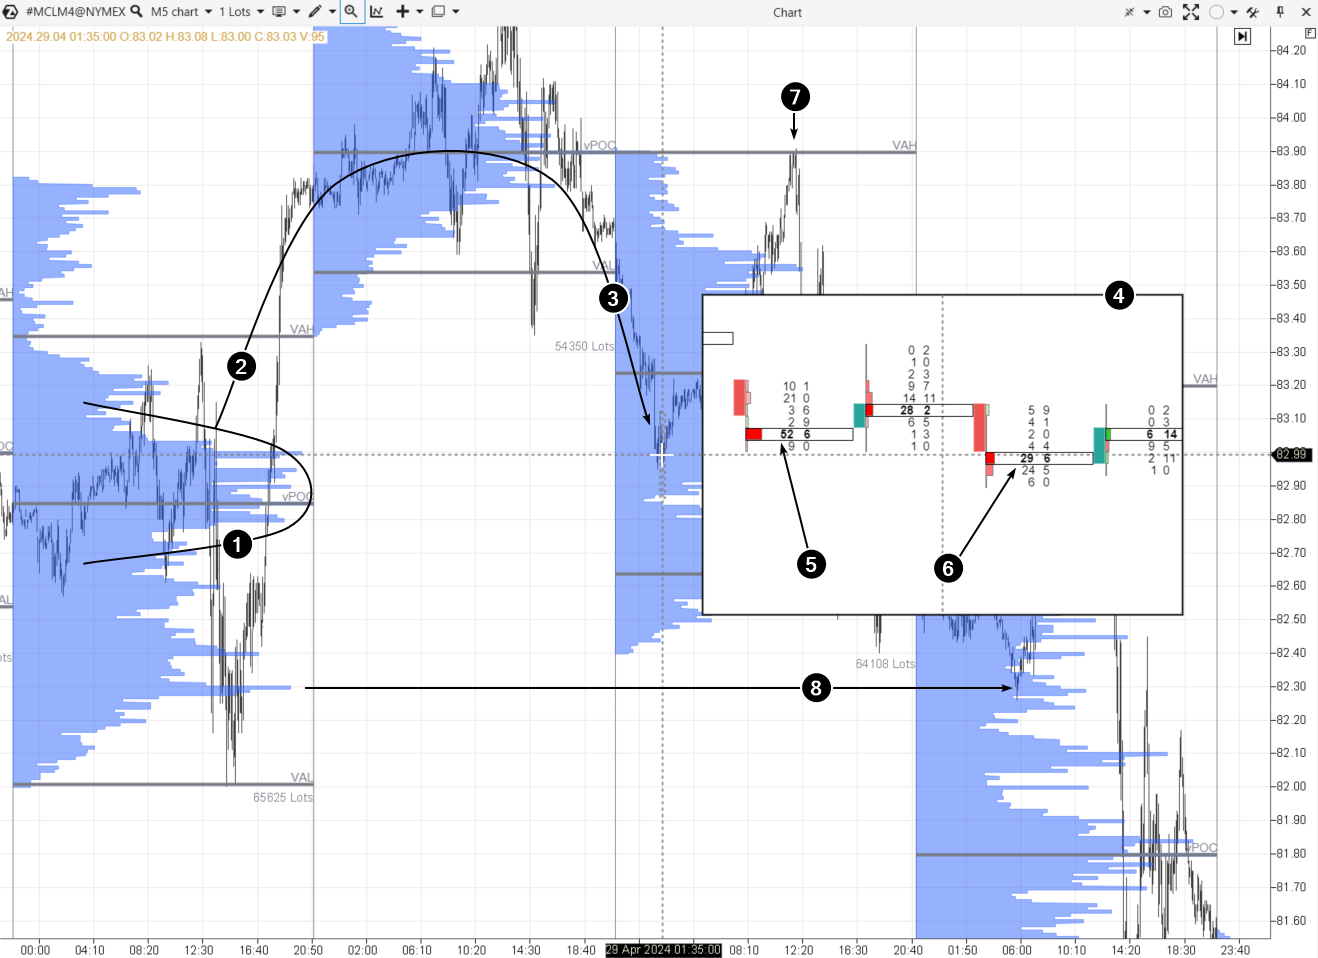
On the first day, a high-volume zone was formed (between $83.00 and $82.80 per contract) as a result of temporary supply and demand balance – marked as 1.
Then, influenced by certain factors (most likely, a batch of news was released as the volatility spike was very aggressive), the price moved upwards (2) to form a new balance on the following day at a higher level.
However, on the third day, the price dropped (3) to the high-volume zone of the first day, around $83 per futures contract. This provided an opportunity to consider opening a long position.
Using the Magnifier, we can delve into (4) the details of price and volume behavior:
- the selling pressure decreases because after a large cluster with 52 contracts sold, there was a large cluster with market sell volume half as much;
- each time the price rises after a cluster of large sells – a bullish sign. Perhaps a large player is opening long positions with limit sells, or the influence of the zone between $83.00 and $82.80, where many transactions were made the day before the previous one, is taking effect.
Suppose a trader saw these signals and decided to open a long position. Let’s leave the question of stop-loss and take-profit levels to the trader’s discretion, but there is an important aspect to consider.
Setting the take-profit at the previous day’s point of control (POC) around $83.90 makes sense because there:
- the day’s high was formed;
- was a setup for entering a short position according to the crude oil futures trading strategy based on a reversal from a high-volume level.
We can also note that during the trading session of the fourth day, the market provided an opportunity to enter a long position on a rebound from the high-volume level of the first day around $82.30… Let’s not delve too deeply into this aspect now. We suggest downloading ATAS, opening crude oil futures charts, exploring them yourself, and trying to develop your own strategy.
FAQ
How much do you need to start trading crude oil futures?
For intraday trading with micro futures contracts like MCL, you will need around $165 in your brokerage account, as shown above (this may vary depending on the specific broker). Guarantee collateral requirements for crude oil futures trading on the Moscow Exchange are significantly lower; consult your broker and study contract specifications for details.
What futures contracts are there for oil?
There are continuous contracts and contracts with fixed expiration dates. There are futures for Brent and WTI. There are physical delivery and cash-settled futures. Overall, these are popular financial instruments that help achieve various goals, including engaging in speculative day trading.
What futures are the most liquid?
The futures contracts for oil with the closest expiration date are usually the most liquid. However, right before the expiration, traders usually “roll over” to the next expiration date futures to maintain their positions for more than one day.
How to learn to trade oil futures for free?
Use ATAS Market Replay.
This trader’s simulator enables you to recreate real trading conditions using past data. To start: click Replay (1), apply the crude oil futures chart (2), then click Play (3).
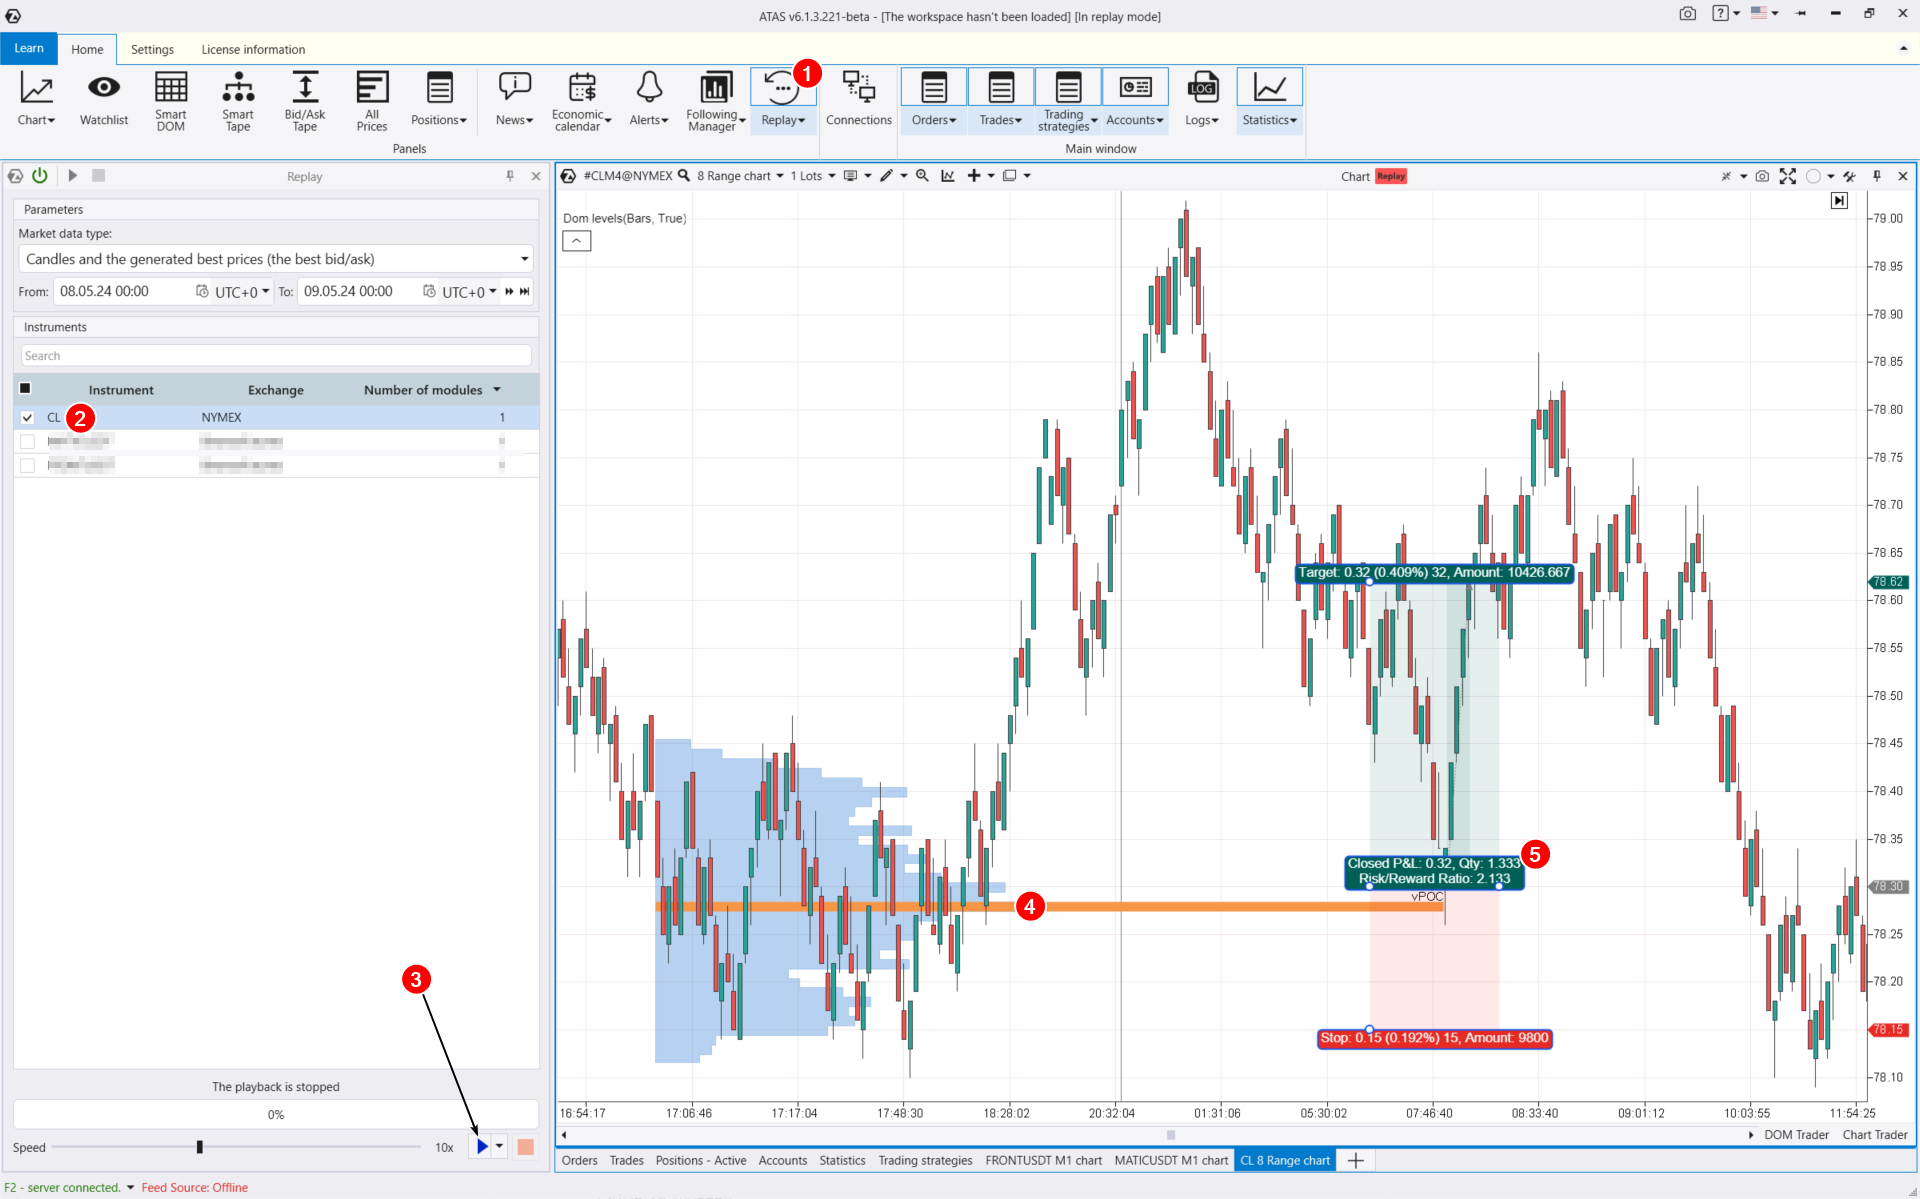
During the process, you can:
- adjust the playback speed and pause;
- trade on the built-in demo account;
- apply over 400 indicators – for instance, Market Profile to identify significant levels (4);
- use various types of charts (in the screenshot above – Range XV);
- use chart tools (number 5 in the screenshot indicates a tool for trade volume planning, setting take profit and stop loss levels);
- analyze volumes in the Level II order book;
- and much more, to master the crude oil futures trading strategy.
How to conduct daily market analysis?
Implementing a trading strategy for crude oil futures involves systematic daily work, which includes:
- Tracking the news agenda. An economic calendar can assist with this (to the left of the Replay button on the chart above).
- Marking up the crude oil futures price chart on various time frames – daily, intraday (hourly, minute). Pay attention to psychological levels, high volume levels, and other important support and resistance levels. Try not only classical time frames but also other types of ATAS charts, such as range ones.
- Making plans for the day, including risk management.
- Placing necessary orders.
Monitoring price changes throughout the day. Getting confirmations on lower time frames. For example, using the DOM Levels indicator.
How to start trading crude oil futures from scratch?
The crude oil futures market is highly competitive, and it will not be easy to succeed. Believing in a simple and quick way to make big money is a misconception. First, make sure you have an edge that makes you ready to enter the battle between buyers and sellers.
Starting to trade crude oil futures from scratch? First and foremost, enhance your skills:
- Check out the Learn section in the main menu of the ATAS platform for educational materials.
- Explore ATAS tools like professional-grade cluster charts, the Smart DOM order book, Smart Tape, useful indicators, and more.
- Read useful articles on strategies in the blog. Test your skills in the simulator or in real time on the built-in demo account without risking real funds.
Conclusions
The ATAS platform provides you with a powerful toolkit for analyzing crude oil futures markets. With hundreds of indicators, various footprint chart options, and an endless array of time frames and workspaces, you have complete freedom to build your strategies.
- The range of tools for analyzing crude oil futures charts is continuously improved with each ATAS platform update;
- ATAS enables you to load tick history from WTI crude oil futures on the NYMEX exchange, providing a comprehensive database to identify patterns in price and volume interactions.
Download ATAS. It is free. During the trial period, you will have full access to the platform’s tools to experiment with various crude oil futures trading strategies and determine which one suits you best. Moreover, you can continue using the program for free even after the 14-day trial period is over, whether it is for cryptocurrency trading or volume analysis in futures markets.
Do not miss the next article on our blog. Subscribe to our YouTube channel, follow us on Facebook, Instagram, Telegram or X, where we publish the latest ATAS news. Share life hacks and seek advice from other traders in the Telegram group @ATAS_Discussions.
Information in this article cannot be perceived as a call for investing or buying/selling of any asset on the exchange. All situations, discussed in the article, are provided with the purpose of getting acquainted with the functionality and advantages of the ATAS platform.


