
Bar-by-bar analysis is a term that came from price action. A great contribution to the popularization of bar-by-bar analysis was made by Al Brooks, a private trader and author of several books describing the technique of reading charts by bars.
Bar-by-bar analysis has important meaning. It aims at a deep understanding of the market situation with the maximum use of the information available on the chart.
In this article, we will give some examples of reading charts bar-by-bar together with the delta and market profile indicators.
Read in the article:
What bar-by-bar analysis is
The idea of bar-by-bar analysis is to assess the current state of the financial market and forecast possible scenarios of its development.
- First, the trader analyzes each bar individually or simple patterns consisting of 2-3 bars. At the same time, it is important to take into account the price dynamics and the volume value.
- Then, a “general history” is formed from individual bars and patterns. It is like to make words from letters and to use these words to make sentences that have meaning.
Bar-by-bar analysis, judging by the name, involves working with bar charts. However, it is perfectly acceptable to use candles and cluster charts.
Advantages and disadvantages of the method
Advantages
- bar-by-bar analysis can be used on any time frames and markets;
- a price and volume chart is enough to conduct an in-depth analysis;
- bar-by-bar analysis can be combined with other techniques, for example, with adding indicators to the chart;
- this method draws attention to the actions of large traders and the “market crowd”.
Disadvantages
- it is subjective;
- it requires a lot of practice to interpret the chart correctly.
What books to read about bar-by-bar analysis
Al Brooks is one of the bar-by-bar analysis experts. He has published a few books on this topic, one of them is called “Reading Price Charts Bar by Bar”.
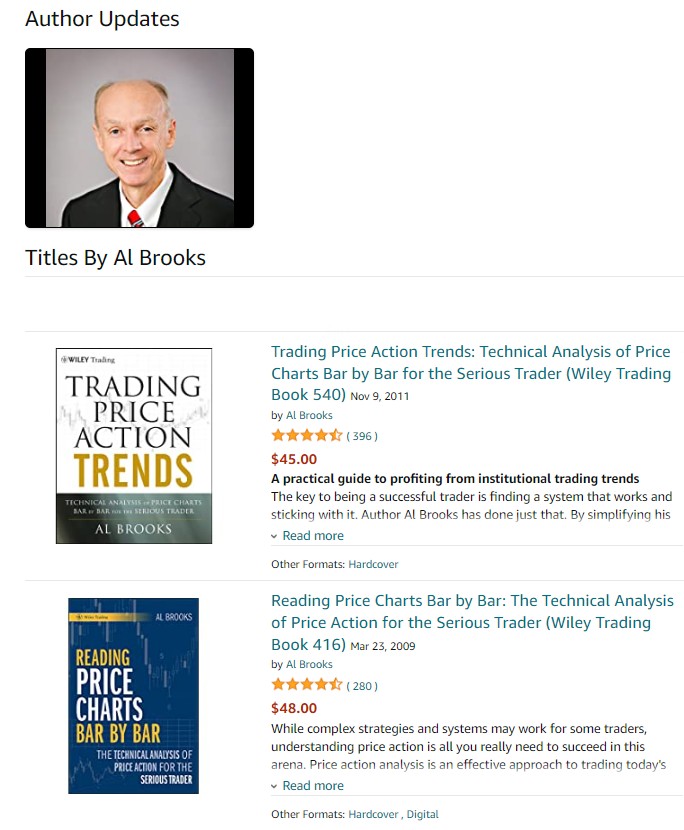
The author categorizes bars on a chart into three groups: trend, non-trend and reversal.
In general, the book will be useful for beginners. Also, pay attention to our article What to read for a beginner trader.
Principles of reading a chart using bar-by-bar analysis
There are three principles of bar-by-bar analysis:
- The principle of effort and result suggests that volume should be evaluated as effort spent by buyers/sellers to raise/lower the price. Do they match each other or not?
- The principle of cause and effect suggests that one should see movements in the consolidation range (range, flat) as the cause of the subsequent trend.
- The principle of supply and demand is a basic economic law. It is believed that it is universal for all markets, including stock ones. This law links the relationship between the price and quantity of goods through supply and demand curves. Therefore, it is a perfect tool for understanding stock charts that show the relationship between the price and volume of trades executed in real time.
These three principles of stock chart analysis were proposed by Richard Wyckoff in the early 20th century. They were later spread by Tom Williams in his VSA method.
We recommend that you read our articles from the “VSA and Cluster Analysis” series at the links:
Examples of reading the market using bar-by-bar analysis
As a first example, let’s have a look at a situation in the bitcoin market in 2021. The data was taken from the Bitfinex exchange (it loads faster), time frame – weekly.

Let’s look at the chart step by step:
- First, let’s conduct a bar-by-bar analysis of the spring top.
- Then let’s read the summer decline towards $30k by bars.
- Finally, let’s analyze the autumn top by bars. This top remains a record in the history of Bitcoin (at the time of writing this article).
We will use the capabilities of the ATAS platform and expand the chart so that we can analyze clusters (“look inside” the candles). We have added psychological level lines to the chart and the EMA to determine the average volume.
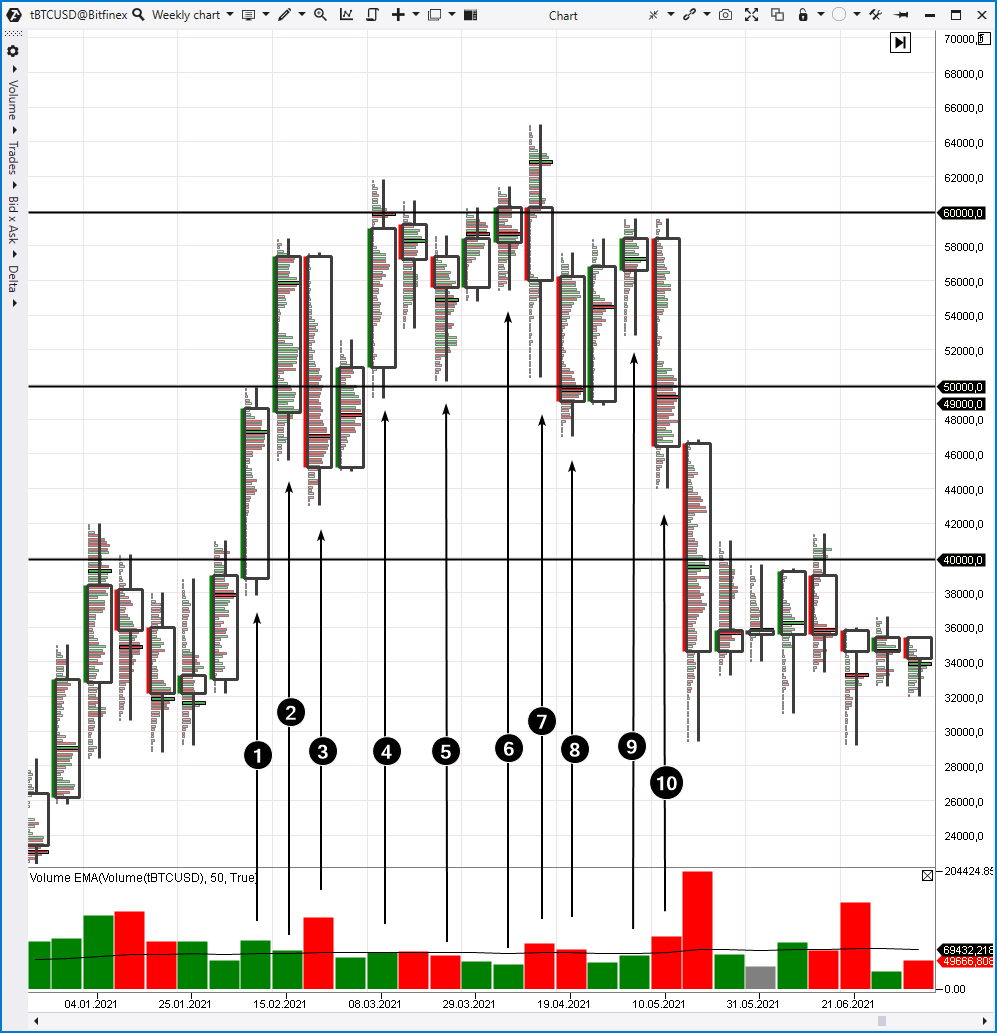
Let’s have a look at this situation step by step and start with candle number 1. It points at a candle where the market broke out above the psychological level of $40,000 per bitcoin after five weeks of fluctuations. At the same time, thin clusters inside the candle indicate a real stir in the market – the price grew very quickly without stopping. The thickening of the profile at the top of the candle indicates that a balance between buyers and sellers was formed as the price was getting closer to the $50,000 psychological mark. Apparently, market participants decided to fix profits from long positions.
Candle number 2 indicates the continuation of the bullish dynamics. Note that there are a lot of green clusters inside this candle. It looks like the market went into FOMO (fear of missing out on a profitable opportunity) after rapid growth on candle number 1. During this period of time, the headlines were full of the thesis that after breaking through the $50,000 level, Bitcoin was ready to reach a six-figure mark. The market was overheated and reached a climax.
Candle number 3 indicates a sharp change in sentiment which usually follows the peak of the stir. This candle is radically different from what happened before. It has the biggest bearish dynamics since the beginning of 2021. It completely absorbed the growth progress made on candle number 2. A bearish reversal pattern on very high volume (twice the average) is a powerful signal that the previous rally may soon end.
Candle number 4 indicates an attempt to resume the rally. Taking candle number 3 into consideration, we can predict that this attempt is unlikely to be successful. Despite the wide body of candle number 4, there are two signs that demand is weakening:
- a decrease in volumes (they are at the average level);
- the price is not able to consolidate above the 60,000 psychological mark (clusters show a lot of activity around 60,000, but the closing happens below this cluster of high volume).
Candle number 5 has a long lower tail with a large number of clusters. Therefore, we can conclude that the balance of supply and demand is pushing the price up from the $50,000 support level. It is followed by another attempt to attack the $60,000 level.
Look at the volume on candle number 6. Volumes are at a very low level, it is the lowest rate in many weeks. Apparently, it indicates low demand – market participants are in no hurry to chase the price and buy up bitcoins offered by sellers.
Bearish candle number 7 has a big difference between high and low. It means that a lot of things happened and the market was very volatile. High volatility is precisely the condition under which large market participants have the opportunity to expand their positions. In this case, we can assume that they were selling the rest of the longs to those buyers who believed that the price would rise above $62k. Pay attention to the density around $62k – these are the “lucky ones” who could no longer tolerate the price increase and decided to buy at the very top.
We see a bright red cluster below the $50k level on candle number 8. These market sells can be described as mass liquidation of buyers’ positions. These are not the sells that are able to push the price lower. So we see another attempt to reach $60k (again on low volume) on the next candle.
Candle number 9 shows the temporary balance. Perhaps the price of Bitcoin was growing amid the growth of other cryptocurrencies. In those days, Ethereum and altcoins were setting new records, and the price of Bitcoin was just uncertainly following the leaders.
If we put the information obtained from the candle analysis into a single history, we will understand that after the breakout of $50k, the market entered the stage of euphoria which gradually subsided. Volumes on upward impulses were decreasing, and attempts to overcome the $60k level turned out to be a failure. In a nutshell, this situation can be described like this: “there are no buyers already, but there are no sellers yet.”
The balance formed on candle number 9 shifted down sharply on candle number 10. Notice thin clusters between $52k and $54k. The price was falling down without any support. Bright clusters in the $48k-$50k area are sellers’ activity that was breaking through all the support levels on its way. The price was falling lower and lower amid buyers’ weakness. The liquidation of buyers’ stop-losses accelerated the fall even more.
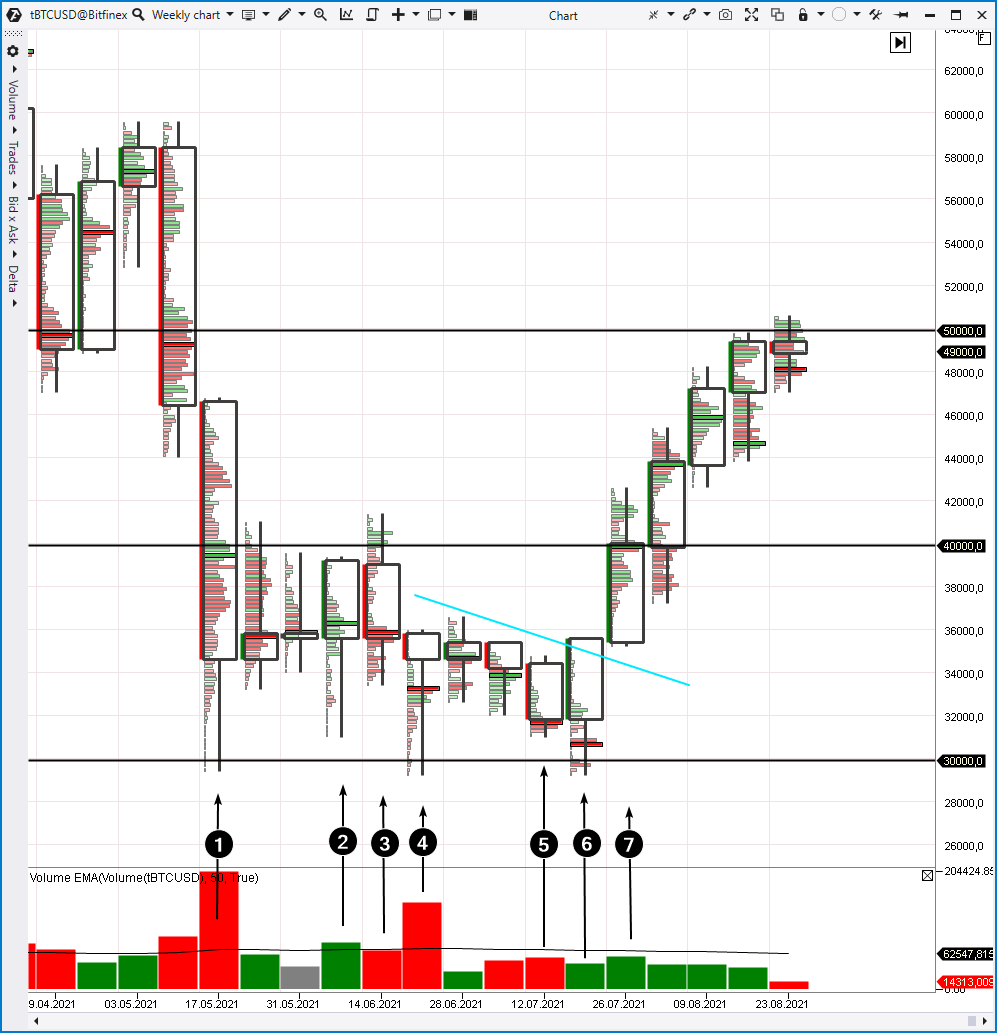
Candle number 1 reflects the decline from $46k which at the peak took the price below the psychological level. According to the principle of cause and effect, the sharp decline can be described as a consequence of the exhaustion of demand in the $60k area and the subsequent activation of sellers. How did the story unfold further?
Candle number 2 can be described as a bears’ attempt to lower the price and attack the $30k level, but it failed. The price dropped just below two week lows, triggered stop-losses around $32.5k (noticeable by the slight red bulge on the clusters) and closed at the top. The market was not ready to resume the decline.
Candle number 3 shows that the market was not ready for growth either. A higher density of green clusters above $40k indicates:
- the activation of buyers’ stop-losses;
- that “hotheads” hurried to buy on the breakout of the psychological level.
But the bigger the spike in volatility is (a 50% drop from $60k to $30k), the more the consolidation period should be significant in proportions (download ATAS – you can check it on the charts). Subsequent candles develop a flat, while all attacks on the $30k level fail.
Candle number 4 formed only a false breakout of the $30k level, after which the price closed near the high – it is unlikely that bears can put this bar into an asset.
The decline on candle number 5 occurs on falling volumes. This is a signal of volume exhaustion, it indicates that the sellers push the price down but not in an active way. The chances of breaking through an important support level are low.
Bar-by-bar analysis shows that there is not enough supply in the market. It can be assumed that professional traders bought coins amid panic (candle number 1) and then “dried up” the available supply even more. When it became “thin”, it got easier to push the price up. We see this on candle number 6 after another false breakout of the $30k psychological level. A thin profile indicates that the price can easily rise. As soon as any newsbreak happens, the price overcomes the blue resistance line without any efforts (Richard Wyckoff’s followers call this moment “jumping across the creek”).
The market returned to the growth stage. It is confirmed by the increasing volumes on bullish candle number 7. The cost of Bitcoin started to conquer a new record high.
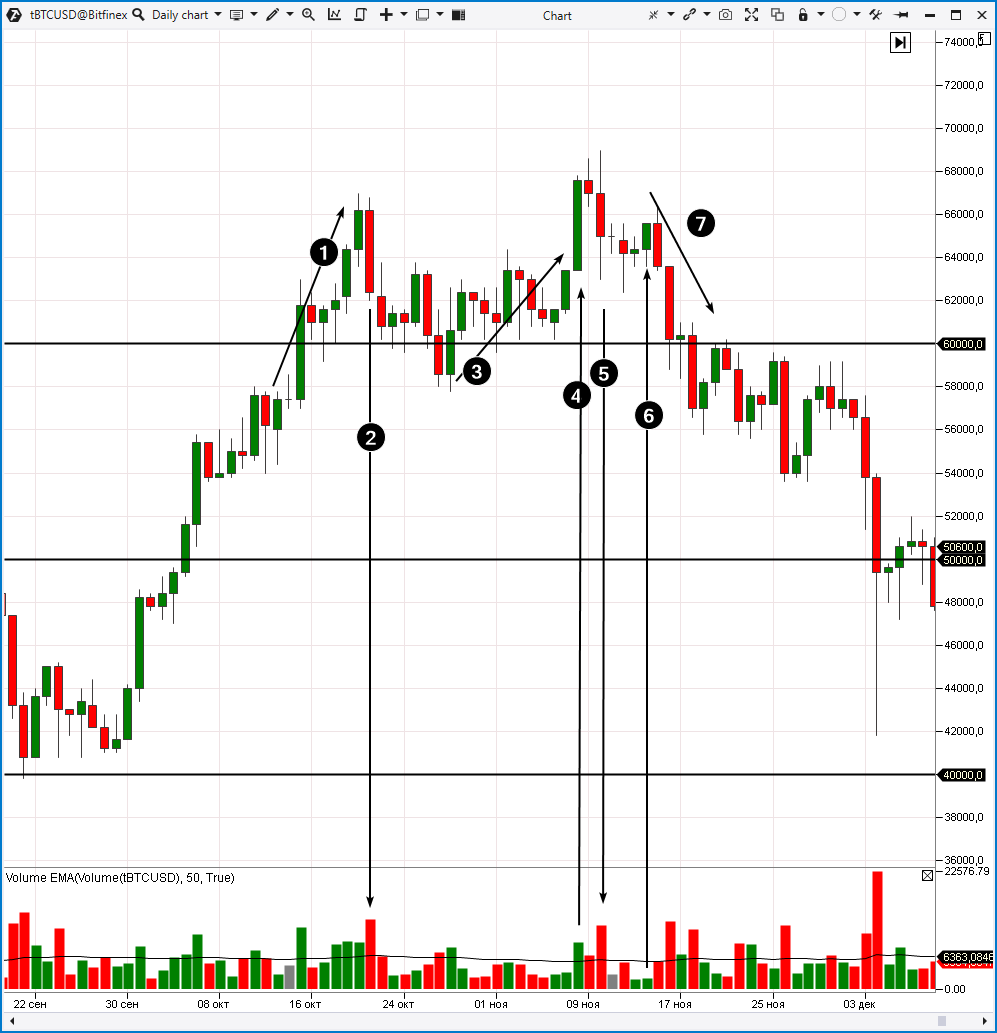
We have switched to the daily time frame.
Arrow number 1 indicates an exponential rise in price after the breakout of the $60k psychological mark. Forecasts that the $100k level would be reached soon became more frequent in the media. They were additionally fueled by the news about the listing of Coinbase on the Nasdaq exchange.
However, an extremely wide bearish candle followed with twice the average volume. Putting together the price and volume action for October 18-22, one can come to the assumption that there was a bearish change in the market behavior after the bullish climax. To be sure of it, look for clues on the chart.
The growth marked with arrow number 3 looks uncertain. The angle (rate) decreased, the volumes exhausted.
As expected, an attempt of a bullish breakout on candle number 4 (amid encouraging news) was unsuccessful.
Candle number 5 indicates that once the support from the newsbreak dried up, the market showed its bearish nature right away.
Candle number 6 is an attempt to grow on the shortage of demand. The subsequent decline in price (marked with arrow number 7) on growing volumes confirms that after a period of positive news (as is often the case), sellers took control of the market.
Note the analogies that can be traced during the formation of the spring and autumn highs of 2021. These analogies at the highs are also found when studying other markets.
Bar-by-bar analysis allows you to see the whole history to trace how sentiments changed – sometimes abruptly, sometimes gradually. Having patience and a bit of luck, an experienced chart reader can find the perfect entry point to a promising position at the beginning of a trend:
- to buy along with the appeared buyers amid the exhaustion of sellers;
- to sell along with the appeared sellers amid the exhaustion of buyers.
How a beginner trader can start using bar-by-bar analysis
We will give examples from the CME futures markets in the next article.
Meanwhile (if you haven’t already), download ATAS, there are four good reasons for this:
- It is free and you can continue using the program even after the 14-day trial period.
- The platform allows you to analyze history which shows patterns of price and volume interaction.
- There is a demo account built into the ATAS platform, so you can practice trading without risking your real capital.
- The platform offers many benefits for traders who want to combine bar-by-bar analysis with easy-to-use cluster charts and useful indicators.
Do not miss the next article in our blog and subscribe to our YouTube channel.
Information in this article cannot be perceived as a call for investing or buying/selling of any asset on the exchange. All situations, discussed in the article, are provided with the purpose of getting acquainted with the functionality and advantages of the ATAS platform.


