Grid trading is a strategy where multiple pending orders (often limit orders) are placed at different price levels to buy and sell an asset, forming a grid. This strategy aims to profit from price swings without having to predict market direction. It is easy to implement but comes with significant risks.
Find out if grid trading is right for you — our comprehensive guide has all the details you need.
Read more:
How Grid Trading Works
Choose a market. The first step is to choose the asset to trade. This could be a currency, stock, commodity, or cryptocurrency. Ideally, a trader aims to choose an asset with price movements that do not establish a strong trend.
Define the trading range. The trader determines the price range within which they expect the asset to fluctuate. For example, if the current price is $100, you might set a trading range from $90 to $110.
Break the range into levels. The trading range is divided into equal levels (steps) or a grid. For instance, if the range is from $90 to $110, the trader might set levels every $1 (e.g., $90, $91, $92, etc.).
Place orders. The trader determines the trade volumes to avoid exceeding their risk limits and then places orders:
- Buy orders are placed below the current market price at each grid level.
- Sell orders are placed above the current market price at each grid level.
Enter a position. When the asset price reaches one of the set levels, the corresponding order is executed. If a buy order is triggered, the trader acquires the asset at that price and places a sell order above that price. Conversely, if a sell order is triggered, the trader opens a short position and places a new buy order below that price.
Cycle repetition. The process continues as long as the asset price stays within the set range. The strategy automatically buys at lower levels and sells at higher levels, profiting from each cycle.
Grid Types
When creating a grid trading strategy, there are many variations to consider, each with its unique approach:
✓ Static grid. The grid levels are fixed and do not change, no matter how the price moves.
✓ Dynamic or adaptive grid. The levels adjust based on price movements (or indicators), adapting to the market conditions.
✓ Proportional grid. The distance between levels changes proportionally with the asset’s price.
✓ Expanding grid. The distance between levels increases as the price moves further from the initial level.
✓ Constrained grid. Trading is limited to a narrow range. If the price moves outside this range, the grid may be reconfigured.
✓ Multi-level grid. The grid is divided into multiple layers, each with different parameters, offering more flexibility.
✓ Bi-directional grids. Often used in forex trading, where traders can open both long and short positions at the same time.
Using advanced indicators, like market profiles, can add even more flexibility. For example, you can set grid levels based on significant peaks in the market profile.
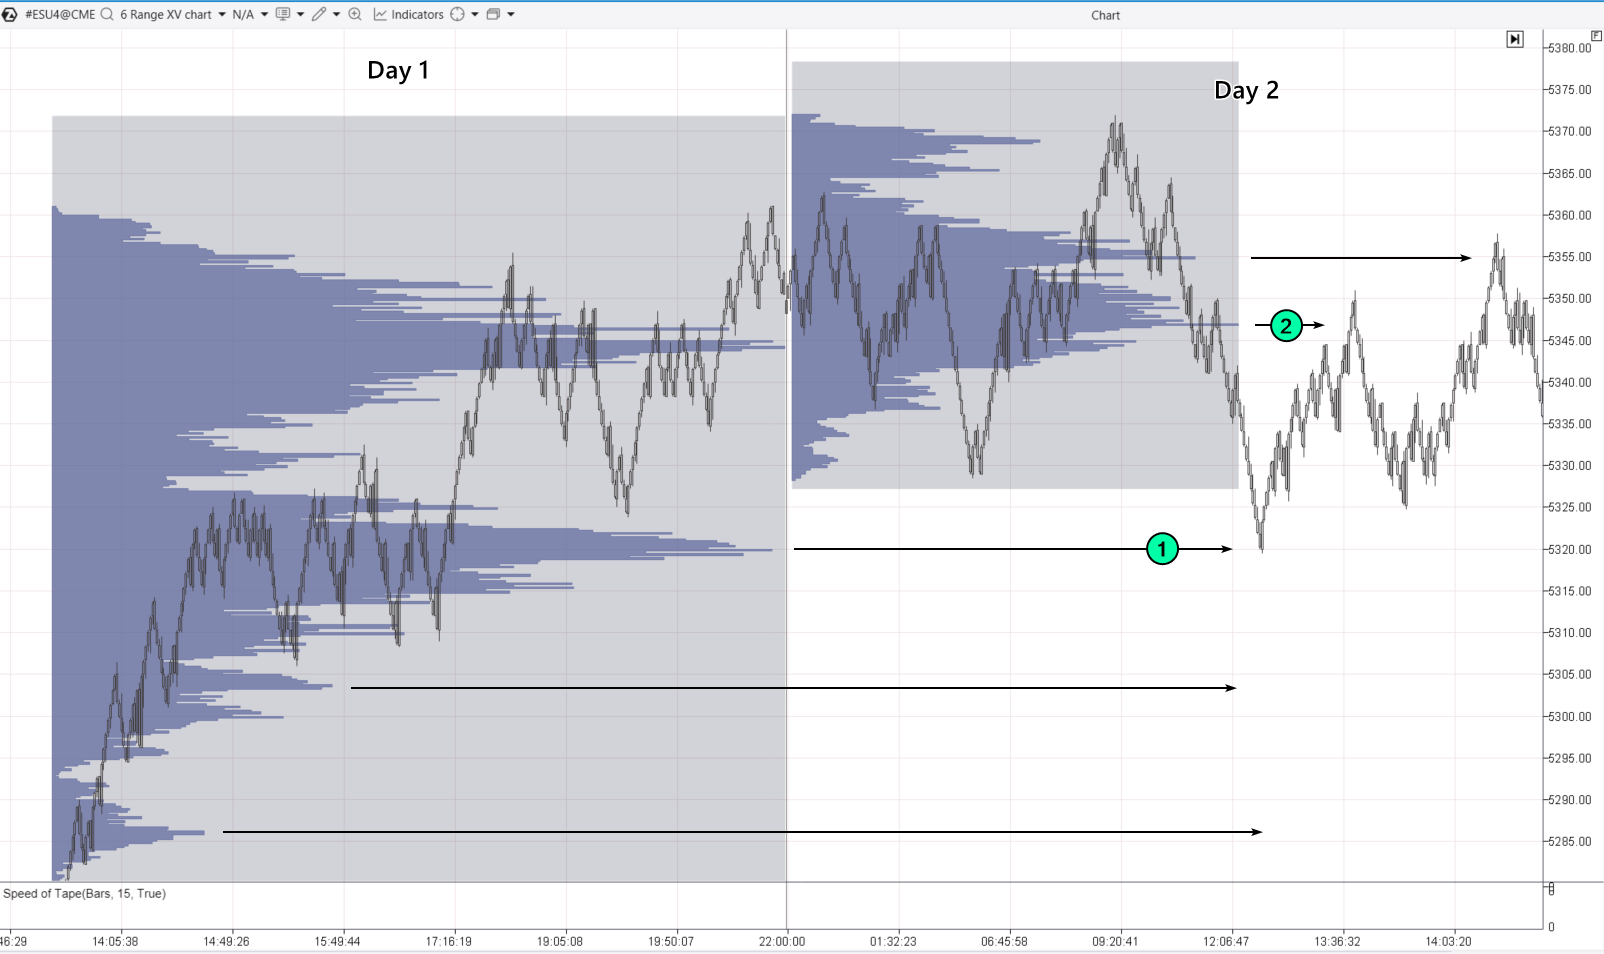
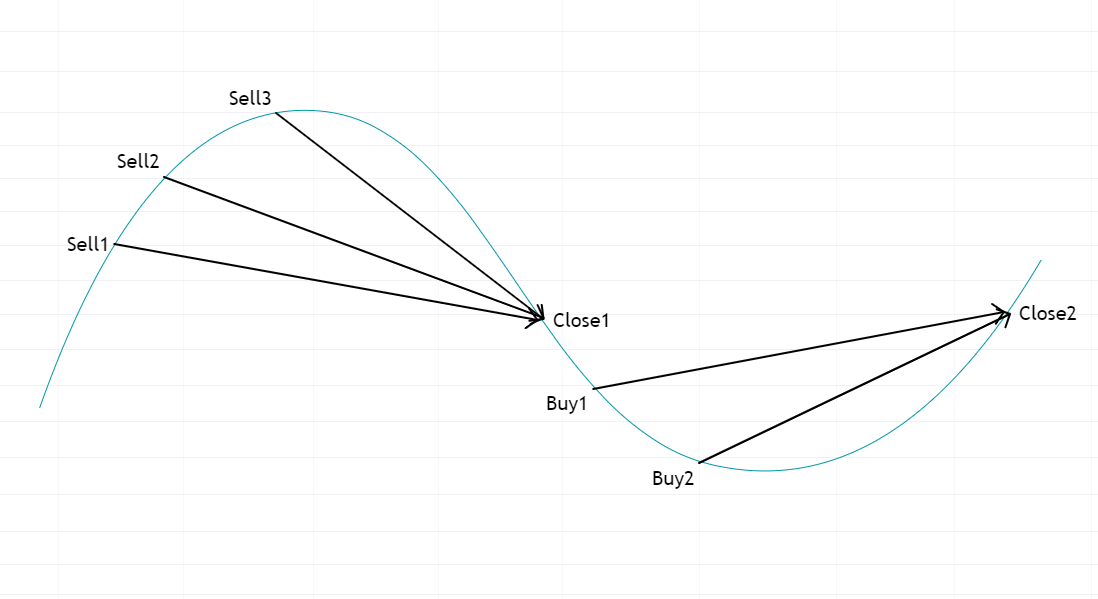
Let’s say you start trading on day 2 and notice that the market is calm and consolidating after yesterday’s trend. The price drops and:
- you set up a buy grid based on the peaks from the previous day’s market profile;
- the first buy-limit order is triggered at the first peak (1);
- the price then rises without reaching the lower levels of the buy grid;
- you close your position at a significant peak above the current price.
Example of Trading with a Classic Grid Strategy
Let’s suppose that a trader believes that during the European session, ahead of major US market news, S&P 500 futures will remain stable as traders wait for the announcement.
The trader decides to use a grid trading strategy and adds the ATAS Standard Deviation Bands indicator, following these rules:
- open (or add to) positions when the price moves beyond the blue line;
- close the entire position when the price hits the red line.
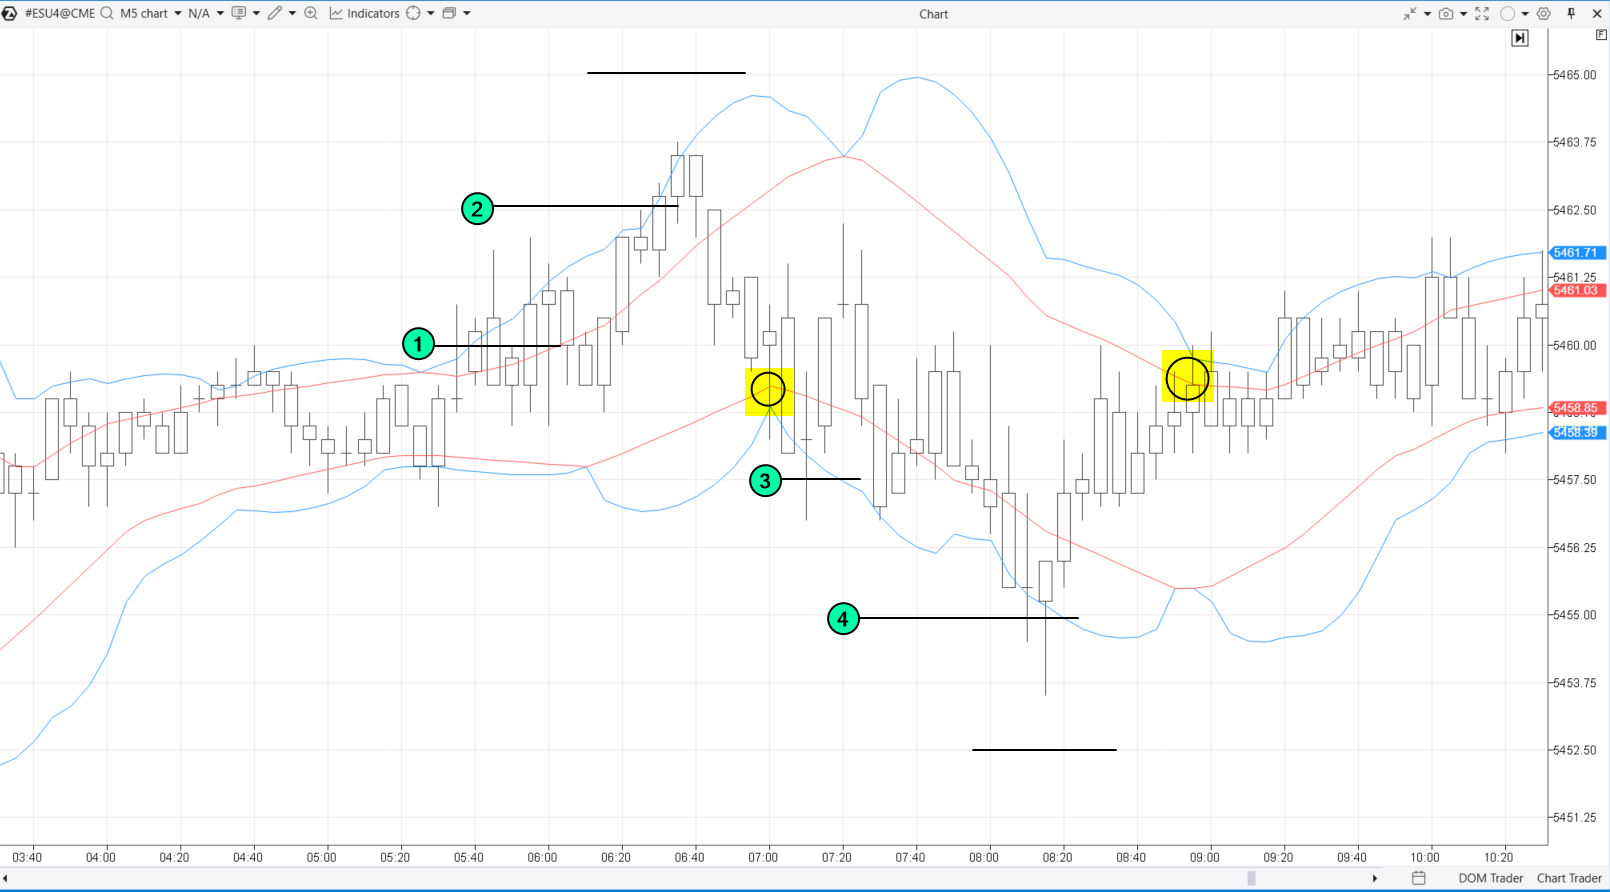
Here is how it might unfold: (1) — a trader opens a short position, (2) — they add to the position on the next grid step. The third order was not executed, and the entire grid closes when the price touches the red line (highlighted in yellow).
Then, the trader sets up a buy grid: (3) they open a long position, (4) add to the position on the next grid step. The third buy order was not executed, and the grid closes when the price hits the red line (highlighted in yellow).
The trader had a successful outcome, closing both positions profitably. However, the risks of grid trading are evident: the price might move in an unexpected direction. More details on the benefits, risks, and ways to mitigate them are discussed below.
Grid Trading Bots for Cryptocurrencies
On Binance, as with other cryptocurrency exchanges, you can use bots for grid trading. To use this functionality:
- go to the Trading Bots page;
- click “Create” to set up your grid trading bot.
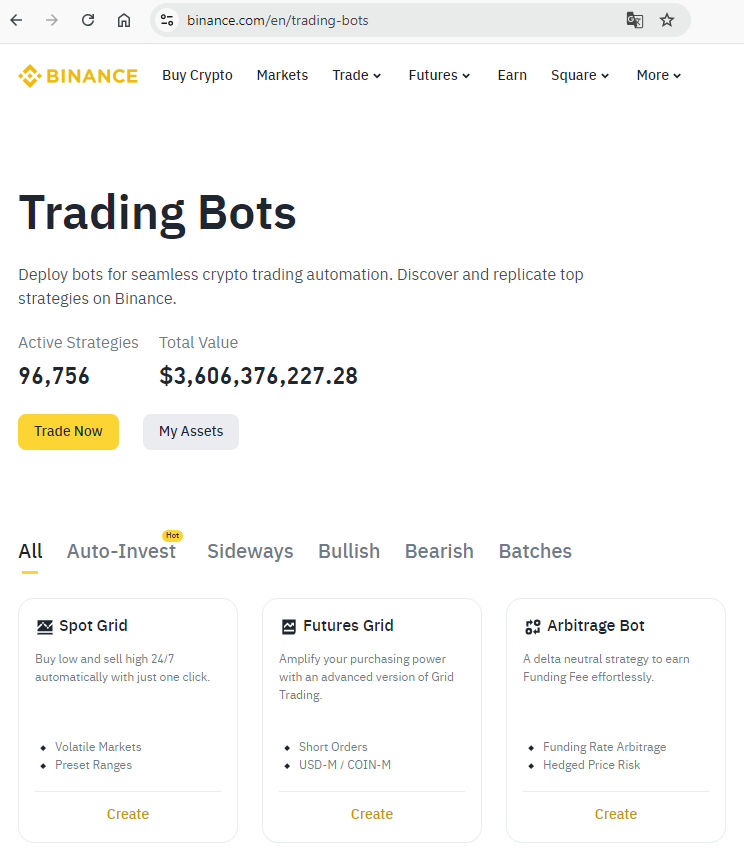
What Is Spot Grid Trading Strategy?
The Spot Grid bot operates on Binance’s spot trading section, where you trade actual cryptocurrencies.
In contrast, the Futures Grid bot manages grid trading for futures contracts — more speculative derivatives that allow you to profit from both rising and falling prices.
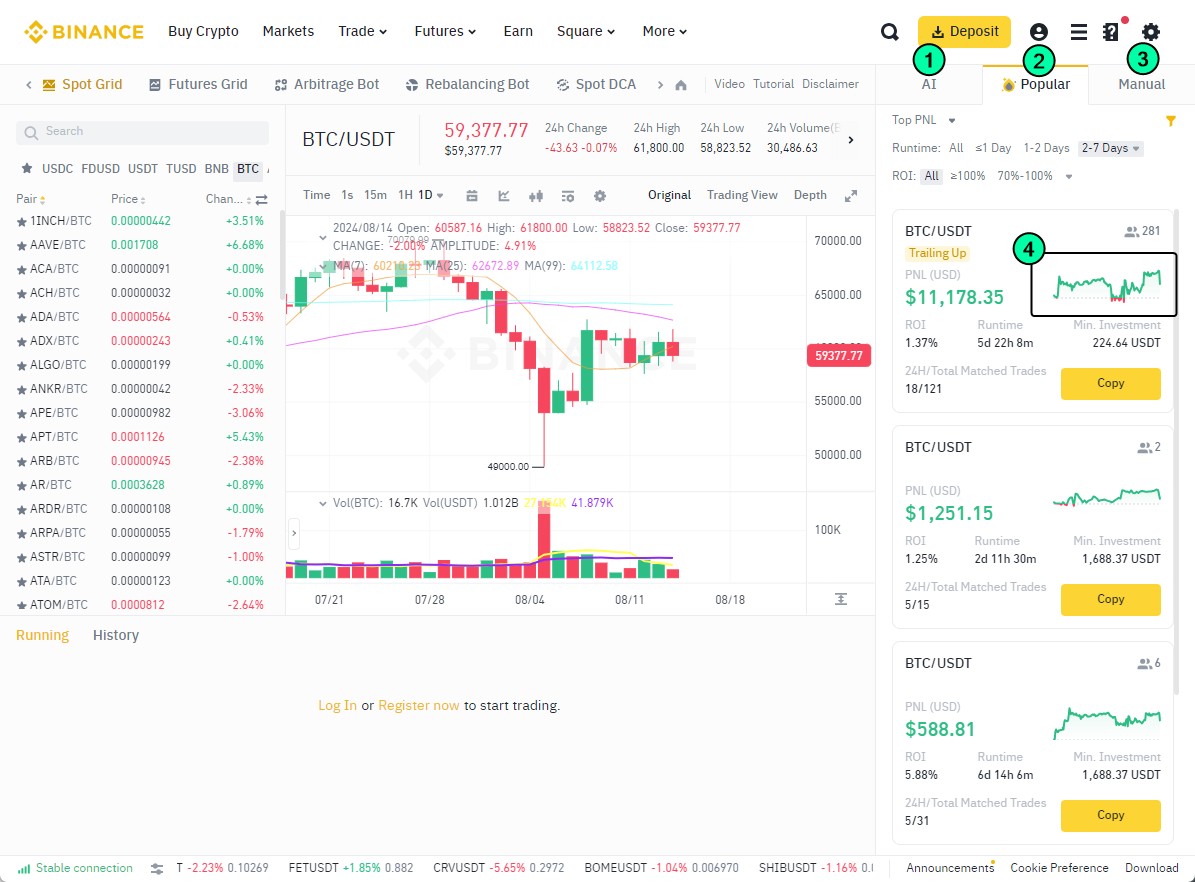
After clicking “Create,” you can choose from several types of grid trading bots. The options will be displayed on the right side of the chart:
- AI bot — AI assesses recent volatility and automatically sets the grid steps.
- Popular — you can copy profitable grid trading strategies used by others.
- Manual — you can set the grid parameters manually. The system will calculate how much capital you need based on your settings.
Be sure to monitor the capital curve (4) during grid trading — it is quite volatile. Ideally, you would like to see a steadily rising line without major drops. In reality, even the best grid strategy (at the time of writing) with 281 followers showed negative results after an initial period of success.
Types of Grid Trading Strategies
As mentioned earlier, grid trading offers various options. Here are a few strategies to consider.
Range Trading
Grid trading is often used during low-volatility periods, such as overnight sessions. This is common among forex traders who capitalize on minor fluctuations in European currencies when European markets are closed.
For this type of trading, you might use the classic ADX indicator to determine whether the market is trending. If the ADX falls below a certain threshold, it is a signal that grid trading could be effective.
Example. The chart below shows how this strategy works with gold futures, using the Deviation Bands indicator.
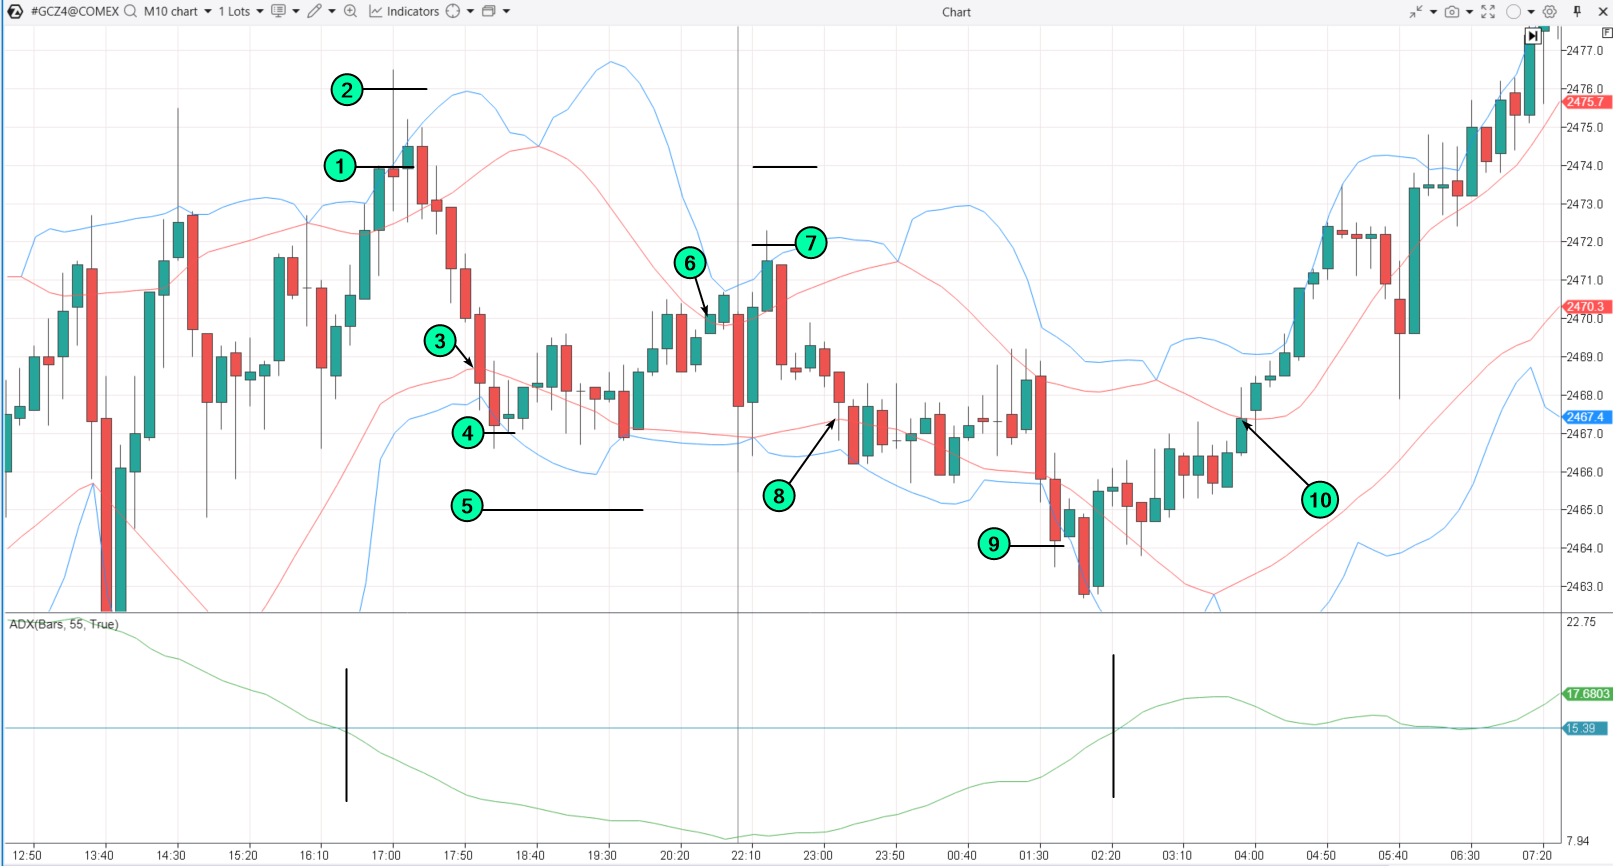
The ADX dipped below the set threshold, indicating that grid trading could commence. (1) — a short position was opened, (2) — a trader added to the position at the next grid level, the third order was not executed, and the grid closed when the price reached the red line (3).
(4)— a long position was opened, but the second order (5) was not executed, the grid closed (6) upon touching the red line.
(7) — a short position was opened, but the second order was not executed, the grid closed (8) upon touching the red line.
(9)— a long position was opened, and as the ADX began to rise, the position could either be closed immediately or held until the price touched the red line (10).
Trend Trading
Let’s expand the chart from the previous example to the right to demonstrate how you can trade using a grid strategy when the ADX rises (indicating a trending market):
- if the price moves above the deviation zone, set up a buy-stop grid. Close the position when it touches the opposite line (whether at a profit or a loss):
- the opposite is true for a sell-stop when the price drops below the deviation zone.
The example is shown on the chart below:
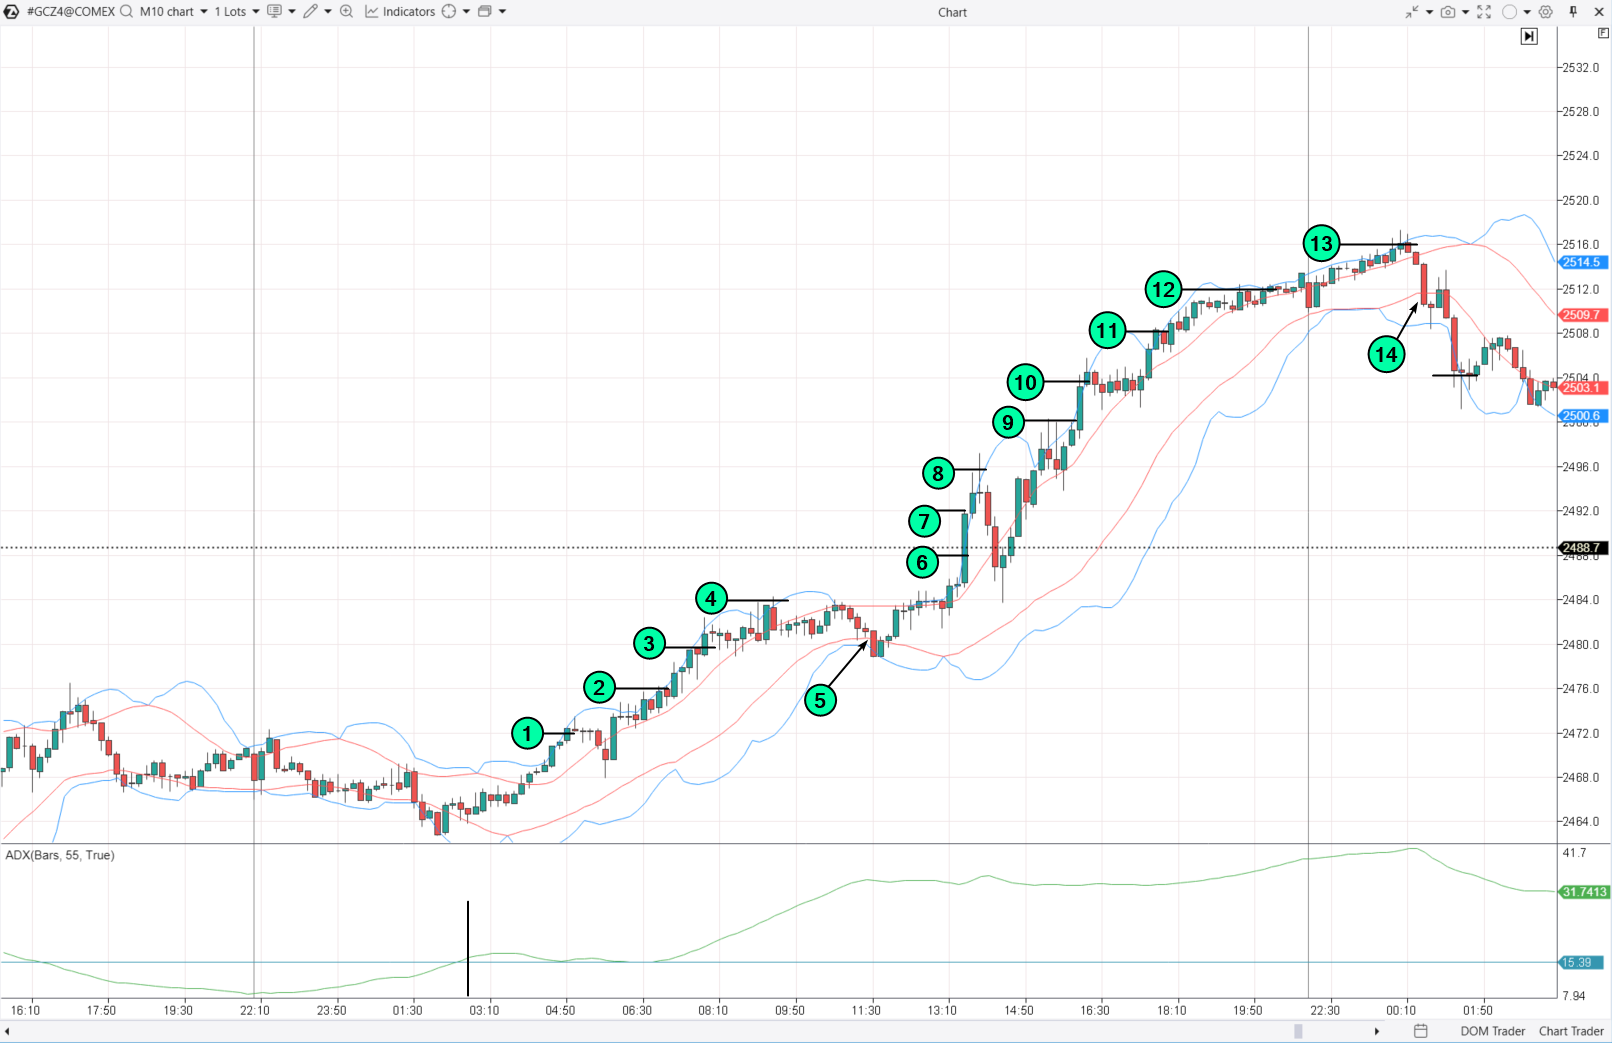
In this case:
- from 1 to 4 — open long positions with buy-stop orders;
- 5 — close the long position, noting that the first sell order may not be executed in time;
- from 6 to 13 — open a long position and continue adding;
- 14 — close the long position and switch to a short position using a sell-stop order, as the high ADX values indicate a strong trend.
Tip. To navigate different market conditions — whether trending or ranging — try using non-standard ATAS chart types like Range, Renko, Volume, and others.
Grid Trading Using Indicators
In this approach, indicators are used to determine the levels for placing grid orders. Let’s use the ATAS Camarilla Pivots as an example.
If you open short positions at resistance levels, long positions at support levels, and close them when the central pivot point (PP) is reached, the grid trading strategy would look like this:
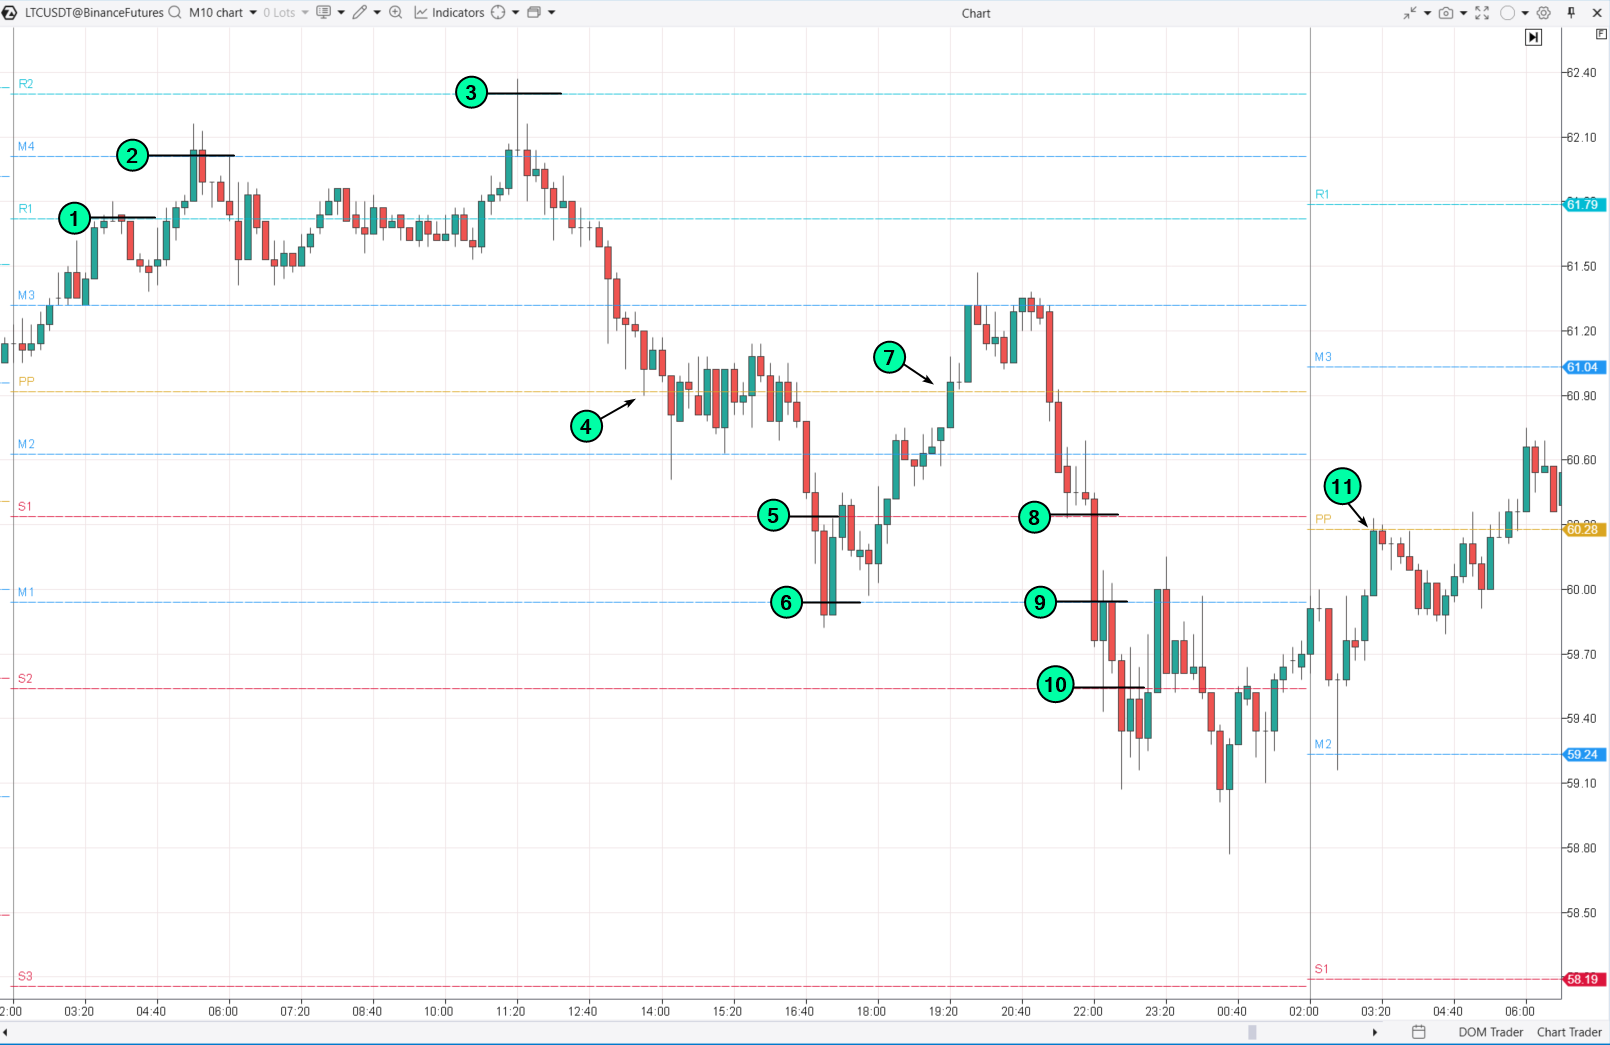
(1)–(2)–(3): open a short position;
(4): close it;
(5)–(6): open a long position;
(7): close it;
(8)–(9)–(10): open a long position;
(11) close it when the central pivot of the next day is reached.
Deciding whether to trade without stop-losses is a personal decision that requires careful consideration.
Pros and Cons of Grid Trading
Pros
✔ Flexibility and customization. Grid strategies can be adapted to fit any set of rules, giving traders the freedom to test their ideas within the grid trading framework.
✔ Versatility. This method works across various time frames and markets, including currencies, stocks, and commodities, making it suitable for traders with different interests.
✔ Ease of automation.Grid strategies are relatively straightforward to program and can be automated with trading bots. This reduces the need for constant monitoring and manual input. Automation also enables backtesting the grid strategy on historical data.
Cons
✘ Risk of losses. The basic arithmetic approach of grid trading does not always account for complex market structures, which can lead to significant losses, especially during sharp market movements.
✘ Potential complexity in fine-tuning. Adding extra rules and filters to enhance the strategy’s effectiveness requires more in-depth analysis and can complicate the strategy, increasing the time needed for setup and management.
✘ Psychological pressure. Managing multiple open positions and dealing with their fluctuations can create considerable psychological stress, particularly during periods of high volatility.
Capital Management
Here are some capital management techniques that can be used in grid trading to mitigate its drawbacks:
- Equal position sizing. Each position in the grid is opened with the same volume, regardless of the level or current price of the asset.
- Dynamic position sizing. The position volume varies based on price levels or other factors like volatility or risk. For example, the volume might increase at lower grid levels and decrease at higher levels.
- Martingale. The position size is increased after each losing trade to recover previous losses when the price eventually reverses.
- Anti-Martingale. The position size decreases after losses, which helps reduce risk during a prolonged trend. For more details on this method, see the article: Is Anti-Martingale Worth Using?
- Partial close. The position is closed in parts when certain profit levels are reached or as the price moves to the next grid level.
- Full close. The position is completely closed when a target profit level is achieved or specific conditions are met, for example, the price moves outside the range.
- Rebalancing. The volumes of open positions are periodically reviewed and adjusted based on changes in market conditions or capital management strategy.
Tip. When trading with any strategy, not just grid trading, you can use the automatic stop-loss and take-profit features available on the ATAS platform.
Comparing Grid Trading with Volume Averaging
Volume Averaging is a strategy where a trader increases the position size at each step when the price moves against them to improve the average entry price.
This method shares some similarities with grid trading.
What else do they have in common?
- Risk management. Both strategies involve increasing positions as the price moves.
- Psychological pressure. Both approaches can be stressful, especially in challenging market conditions.
What is the difference?
Their usage. Volume Averaging (VA) is more suited for long-term investing, particularly in stock indices, because indices tend to rise over the long term, and averaging down improves the entry price, which is especially beneficial during market corrections. Grid trading, however, is often used for more aggressive strategies, like short-term trading in sideways markets where prices move within a narrow range and frequently reverse.
Comparing Grid Trading with Volume Analysis
Grid trading and volume analysis are two very different approaches.
To put it simply:
- grid trading is like following a plan that says, “Close your eyes, walk 100 steps straight, then turn right, walk 200 more steps, and you will cross the road;”
- volume analysis is more like trading with your eyes open. A trader can make informed decisions in real time based on the behavior of buyers and sellers. This can be done using tools like footprint charts.
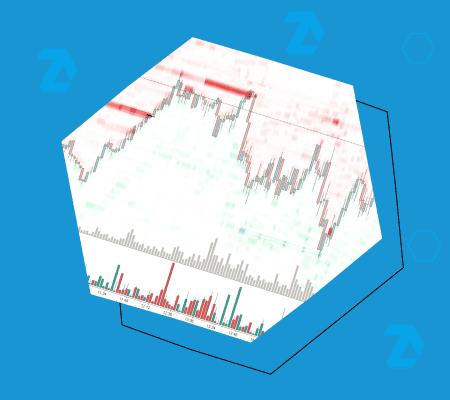
For example, here is how you can find trading levels using a footprint chart for E-mini S&P 500 futures:
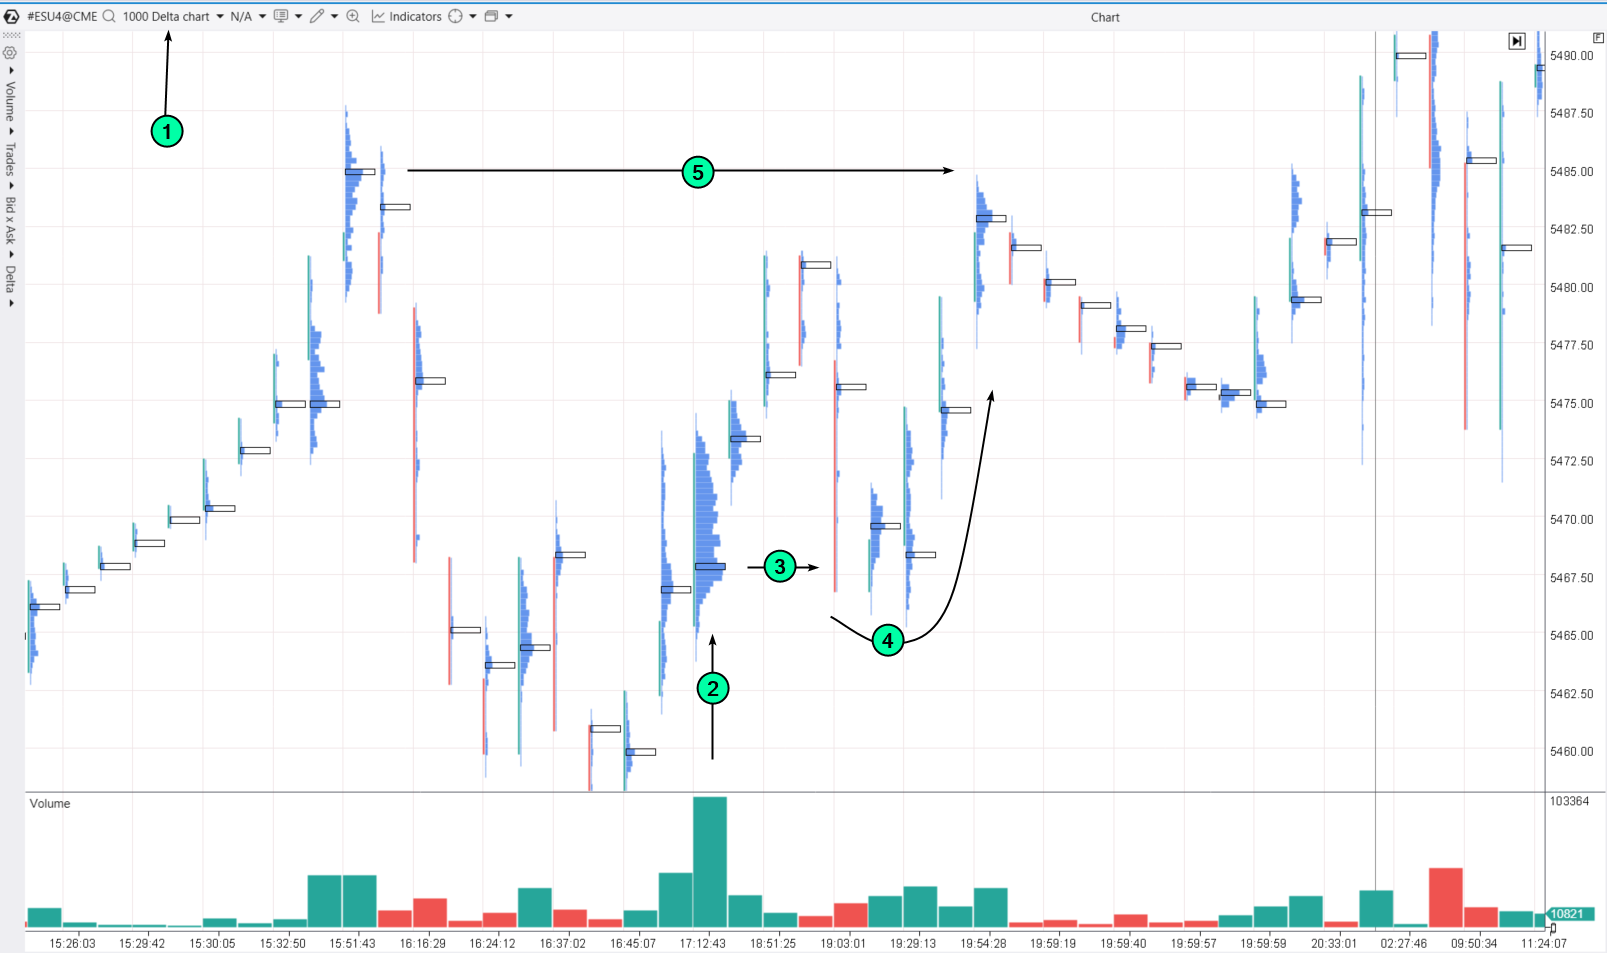
(1) open the delta chart (1000);
(2) find a “thick” candle;
(3) draw a level from its bulge;
(4) wait for a test and see how the price reacts at that level, reversing upward…
(5) …to form a peak at one of the previous noticeable bulges.
How to Test a Grid Trading Strategy?
To see how effective grid trading could be for you, you can use a demo account on ATAS. However, a better option is the ATAS Market Replay. In simple terms, it is a trading simulator that enables you to replay historical data as if the trades are happening in real time.
To do this, download the ATAS platform for free, install, and launch it, and then:
- Open the price chart.
- Click on the Market Replay button in the main ATAS menu.
- Activate the Replay mode (the icon should turn green).
- Adjust the settings.
- Start the playback and practice grid trading.
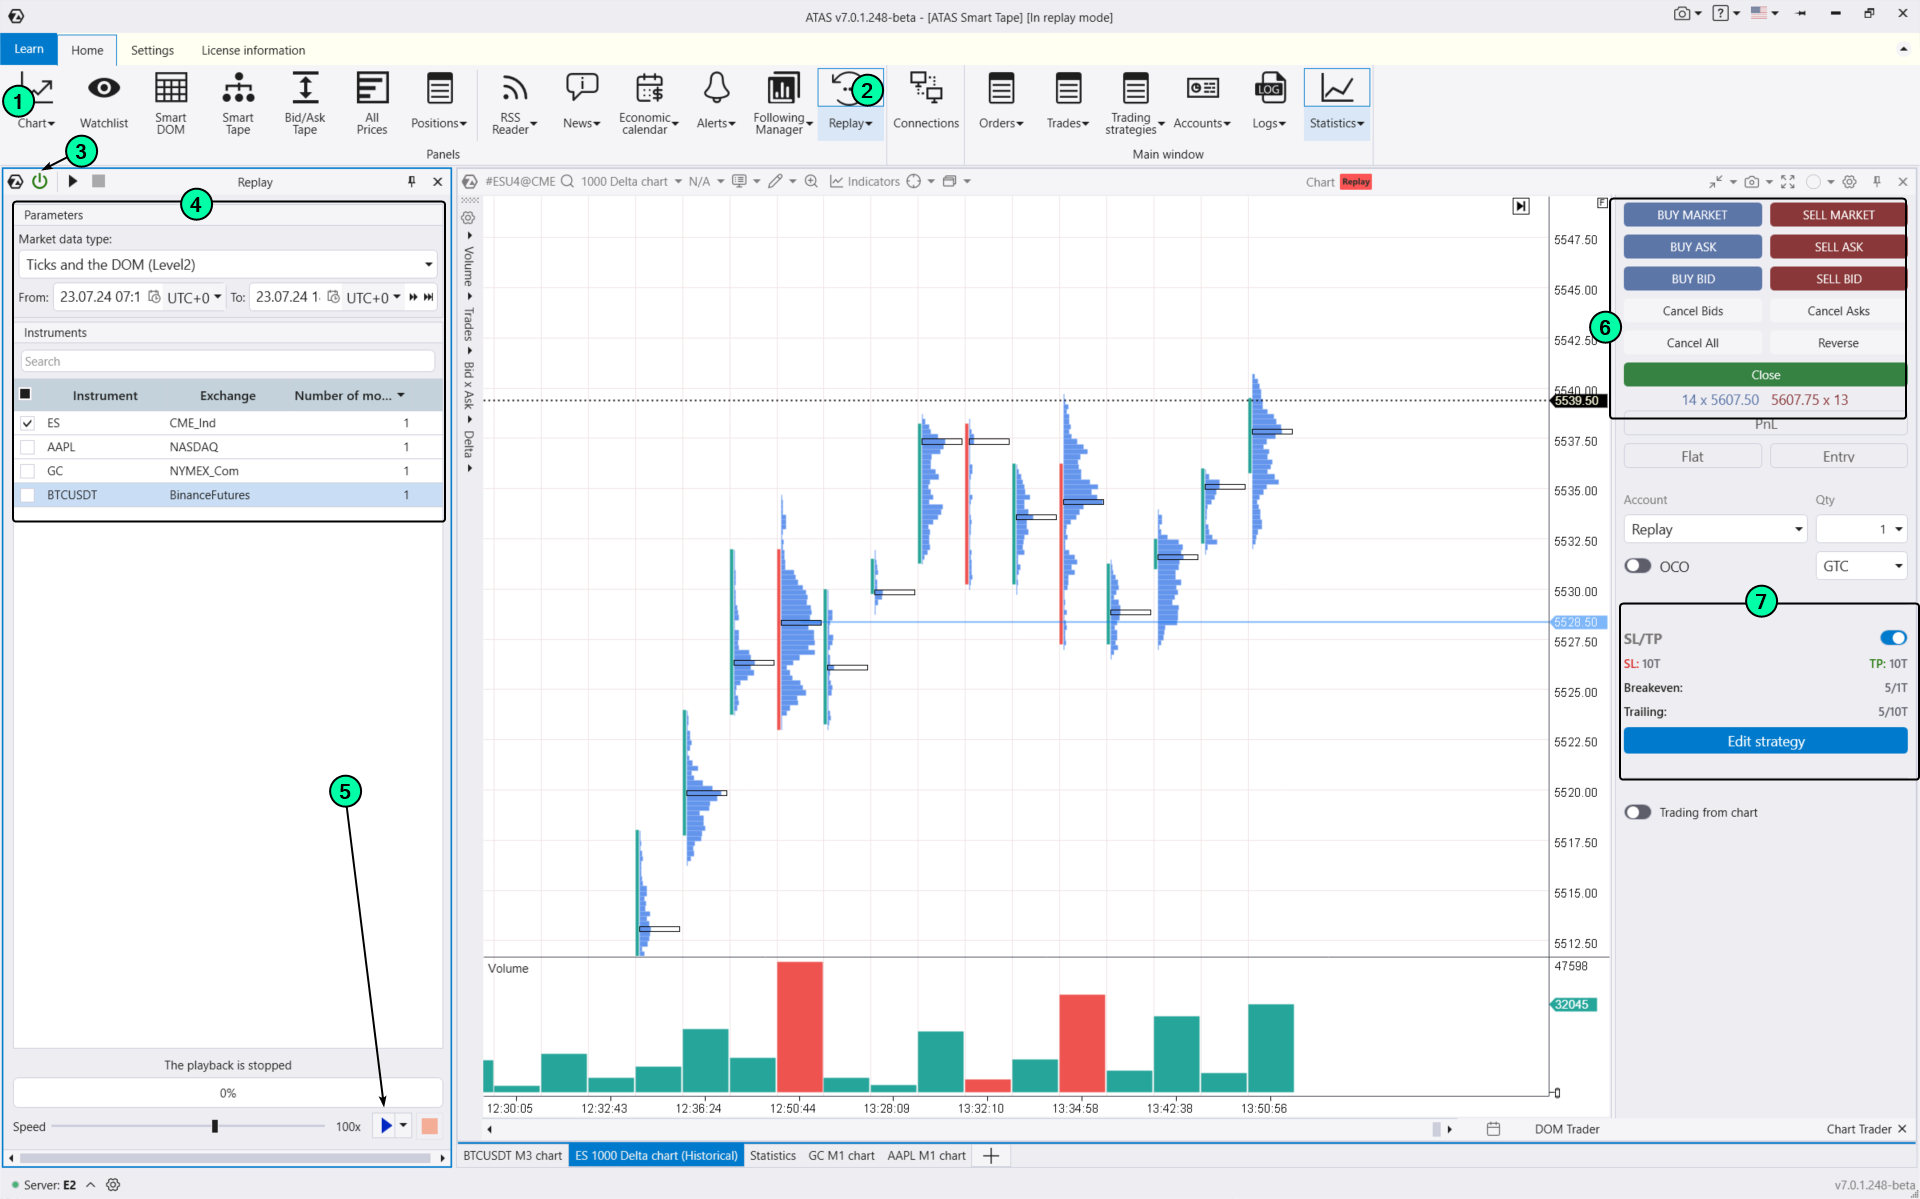
On the right, you can use buttons (6) to place orders (hotkey options are available) and set up exit strategies (7).
ATAS Market Replay provides everything needed to enhance your trading skills:
- replay of crypto, futures, and stock markets;
- more than 400 indicators;
- drawing objects, for example, support and resistance levels as the foundation for grids;
- various chart types (e.g., non-standard Range XV);
- analysis of volumes in the Level II order book, for instance, using the DOM Levels indicator and much more.
As you practice, you might find that grid trading is too risky. A few successful trades can quickly turn into significant losses when, as often happens, the price “breaks through the grid.”
FAQ
How risky is grid trading?
Grid trading can be risky, especially in trending markets where prices move consistently in one direction, which can lead to significant losses if proper risk management is not applied.
What is a grid trading bot in crypto?
A grid trading bot for cryptocurrency is an automated program that sets up and manages a grid of buy and sell orders on crypto exchanges according to preset parameters.
Is grid trading profitable?
The profitability of grid trading depends on market conditions and how well capital is managed. It can be profitable in volatile markets, but careful risk management is crucial to minimize potential losses.
What is grid strategy multiplication?
Grid strategy multiplication is a method where the position size increases at each grid level to maximize potential profits as prices move in a certain direction. However, this also increases the risk of losses if the market moves against you.
Conclusions
Grid trading strategies in cryptocurrencies and other assets involve gradually increasing your trading position, which means raising the stakes. While this can lead to profits, it also carries the risk of substantial losses. Therefore, it is crucial to be confident that the strategy will yield more benefits than drawbacks before using grid trading.
Download ATAS. It is free.
Once you install the platform, you will automatically get the free START plan, which includes cryptocurrency trading and basic features. You can use this plan for as long as you like before deciding to upgrade to a more advanced plan for additional ATAS tools. You can also activate the Free Trial at any time, giving you 14 days of full access to all the platform’s features. This trial allows you to explore the benefits of higher-tier plans and make a well-informed purchasing decision.
Do not miss the next article on our blog. Subscribe to our YouTube channel, follow us on Facebook, Instagram, Telegram or X, where we publish the latest ATAS news. Share life hacks and seek advice from other traders in the Telegram group @ATAS_Discussions.
Information in this article cannot be perceived as a call for investing or buying/selling of any asset on the exchange. All situations, discussed in the article, are provided with the purpose of getting acquainted with the functionality and advantages of the ATAS platform.