
The Market Profile Indicator is a powerful analytical tool in the ATAS platform. It enables traders to visualize and interpret the market more deeply, providing crucial information about price behavior and trading volumes at each level.
In this article, we will explore three types of ‘bounce’ (‘rebound’) signals provided by the Market Profile indicator. We will also discuss how they can be used to develop and/or enhance your reversal strategies.
Read more:
Disclaimer: It is important to understand that the subsequent descriptions of trading signals from the Market Profile indicator reflect the author’s perspective. Their interpretation is based on personal experience and skills. This classification may appear subjective and should not be considered as the only correct or exhaustive viewpoint.
What the Market Profile Indicator Is and How It Works
The Market Profile indicator is a powerful analysis tool that allows traders to visualize and interpret market dynamics by breaking them down into levels.
To add the Market Profile indicator to an existing chart in the ATAS platform:
- press Ctrl+I or click on the corresponding icon in the top menu of the chart window;
- select the Market Profile from the list of indicators;
- click Add, then OK.
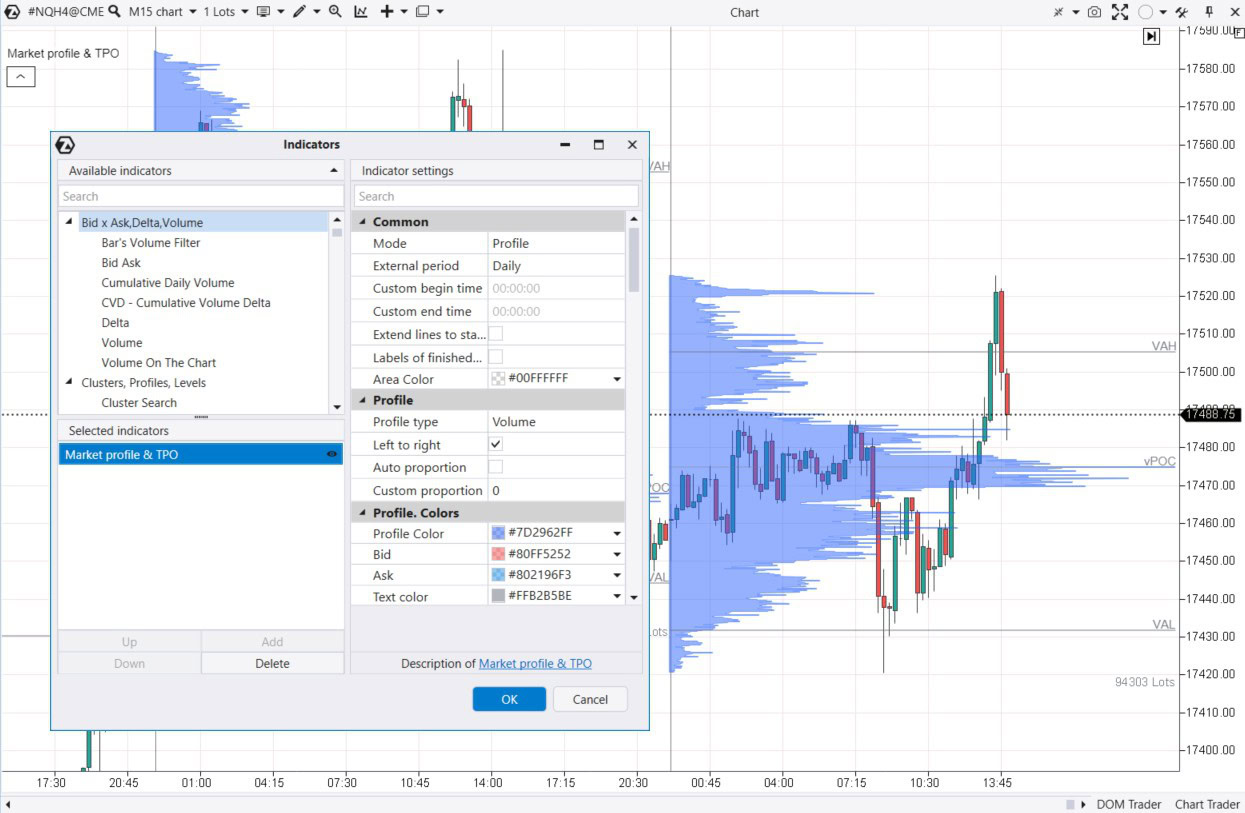
Example. The screenshot above illustrates the daily market profile on a 15-minute chart of the NASDAQ index futures. The default presentation of the indicator is a blue histogram with horizontal bars for each level.
Key components of the Market Profile indicator:
- Price levels. You can gather information for each level individually or combine multiple levels using the Scale function. This enables you to customize the profile’s level of detail.
- Trading volumes. The indicator identifies key price levels with the highest/lowest trading volumes. Volumes can be split into Bids and Asks.
- Period. Adjusts the time frame for which the Market Profile indicator will visualize data.
The Market Profile analysis revolves around the concept that market prices are shaped by the ongoing battle between buyers and sellers. The indicator reflects the traces of this battle — volumes at price levels over specific time intervals. This information helps traders gain a clearer insight into the market’s evolving stages and the significance of various price levels:
- Balance stage. When the profile is convex and has a bell-shaped form (normal Gaussian distribution), it indicates that the forces of demand and supply are in equilibrium.
- Imbalance stage. When the profile is thinner, it may be a sign that the market is in a trending stage. The price is seeking equilibrium — values that equally satisfy both buyers and sellers.
Useful links. More detailed information on how the Market Profile indicator works, its history, and settings can be found in the articles:
Three Types of Trading Signals From the Market Profile Indicator
The Market Profile indicator provides traders with various signals to make informed trading decisions. In this article, we will explore three primary types of signals that can be valuable when trading reversals.
It is important to remember that any trading signal should be used in consideration of the overall market context, combined with other indicators and analytical methods. This approach helps mitigate risks to your capital.
1st Signal Type: Bounce from the POC Level
This signal type is based on the interaction of price with the level where the maximum trading volume was recorded for a selected period. This level is also known as the POC (Point of Control), and the signal is referred to as a test of the POC level.
Since trading was very active at the POC level, it holds significant interest for market participants. A lot of positions have likely been opened at this level. Practical experience has shown that this is one of the reasons why the price often reacts to this level.
Example 1. NQ Futures, 15-minute chart
In order to provide a clearer market context just before the signal, profiles were not created for sections with a white background in all the illustrations accompanying this article.
In the screenshot below, we used the market profile drawing tool. It enables you to instantly create the market profile for any section outlined by the mouse on the chart.
During the analysis of the profile in the European trading session, the balance was formed approximately between the 17150-17190 levels. Subsequently, buyers took control, shifting the balance upward.
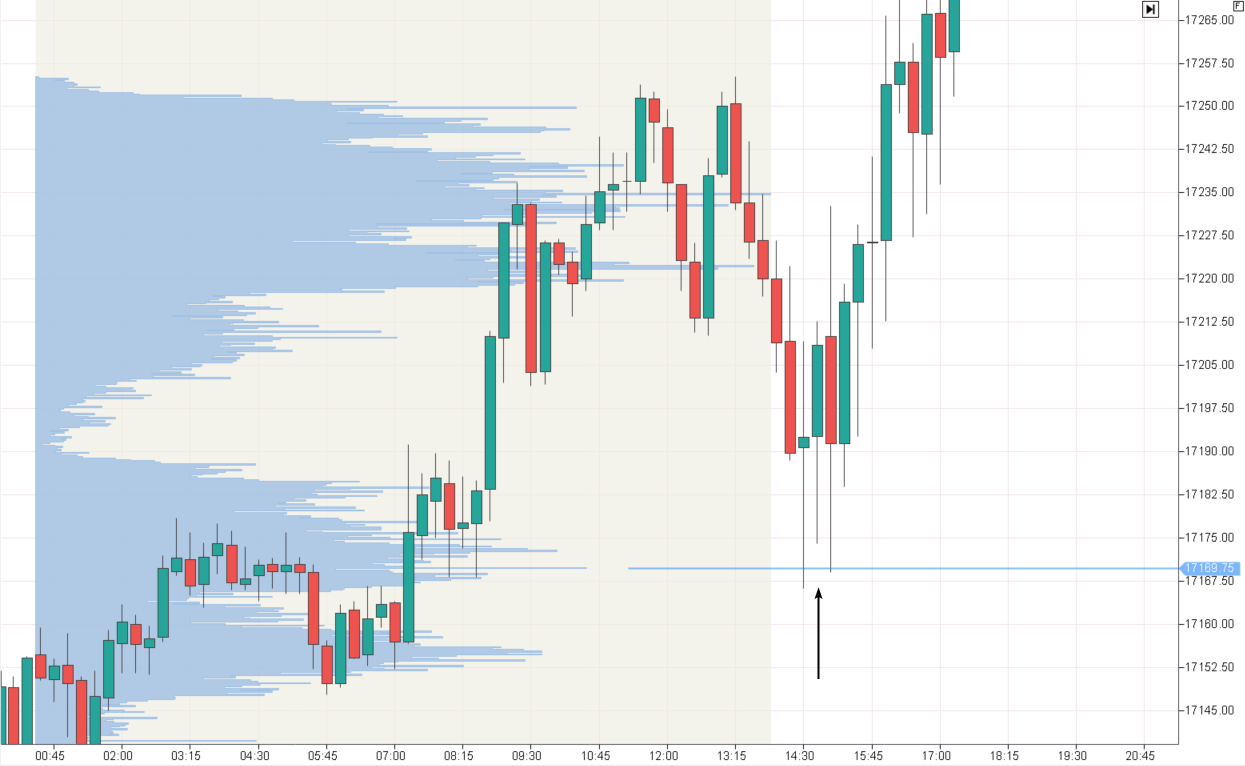
During the more volatile American trading session, a test of a significant volume level occurred near 17170 – the POC level of the European session’s balance. Thanks to the market profile, traders could use this test to establish long positions in the direction of the emerging bullish trend.
Example 2. CL Oil Futures Market, 30-Minute Chart
During the American trading session, there was a test of the previous day’s POC level — an opportunity to open long positions.
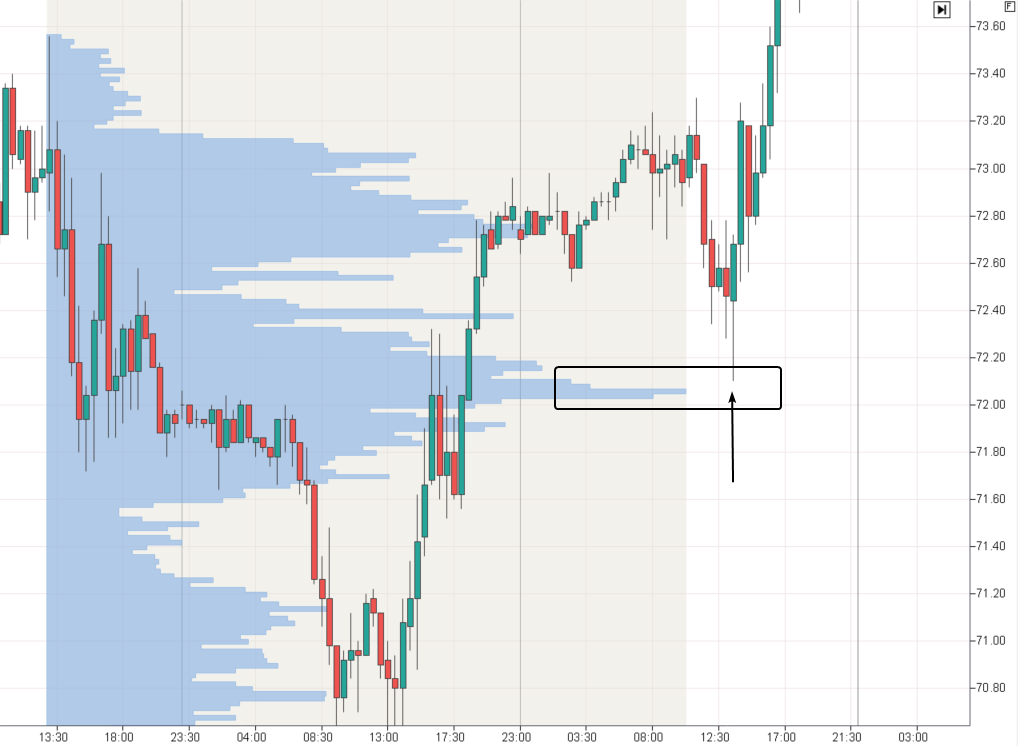
The price almost reached the test, missing it by a tick. While perfect tests are not frequent, they would indeed make the job much easier for traders
How to Trade the ‘Bounce from the POC’ Signal:
- Identify significant volume levels (POC) from the previous day, several days, or hours — depending on your preferred timeframes.
- Wait for a test of the significant volume level, get confirmation signals on lower timeframes if possible.
- Enter a position, anticipating a rebound.
- Set a stop-loss beyond the significant volume level. Set a target so that it can offset the potential loss.
Pros of the Signal:
- It is based on the idea that recently established significant volume levels indicate traders’ activity. Thus, a test of this level is expected to prompt market participants to defend their positions, leading to a reversal in price.
- The signal helps improve the risk-to-reward ratio.
Cons of the Signal:
- Sometimes it does not provide clearly defined levels of the Point of Control.
- The price does not always test these levels. And when it does, it might not be with exact tick accuracy.
- During an impulse, the price may break the POC level without generating a substantial rebound.
2nd Signal Type: Bounce from the Step
A ‘step’ is an informal term referring to a location on the market profile where wide bars sharply transition to narrower ones. This is where the boundary between active and inactive trading zones lies.
In practice, when the price reaches this boundary, a reversal forms, i.e. a bounce from the ‘step’ occurs.
Example 1. NQ Futures, 15-minute chart
The chart illustrates the formation of two balances:
- balance A with an upper boundary (step) marked with the 17441.50 level;
- subsequent Balance B with a lower boundary (step) marked with the 17551.50 level.
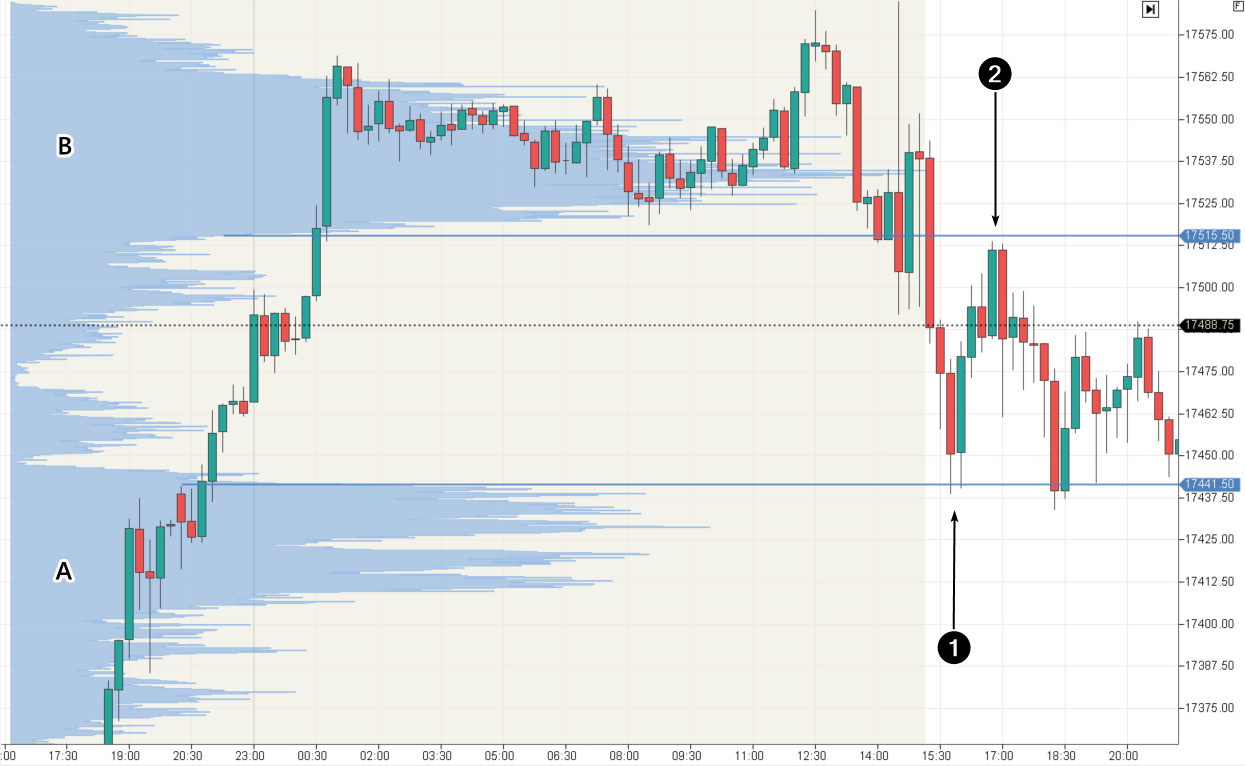
After the price moved downward from Balance B (making a bearish breakout amidst fundamental news), it made a reversal (1) from the ‘step’ at the 17441.50 level.
As the price moved upward, it encountered resistance (2) at the 17551.50 step. Following this, it headed downward and once again made a rebound from the step at the 17441.50 level.
In this scenario, intraday traders could:
- use the described levels for trade planning;
- switch to lower timeframes to find confirming signals (e.g., on a cluster chart);
- enter a ‘rebound from the step’ position with an acceptable risk-to-reward ratio.
Example 2. FDAX Futures, 15-minute chart
This chart provides insights into how to use steps to build a trend-following trading strategy.
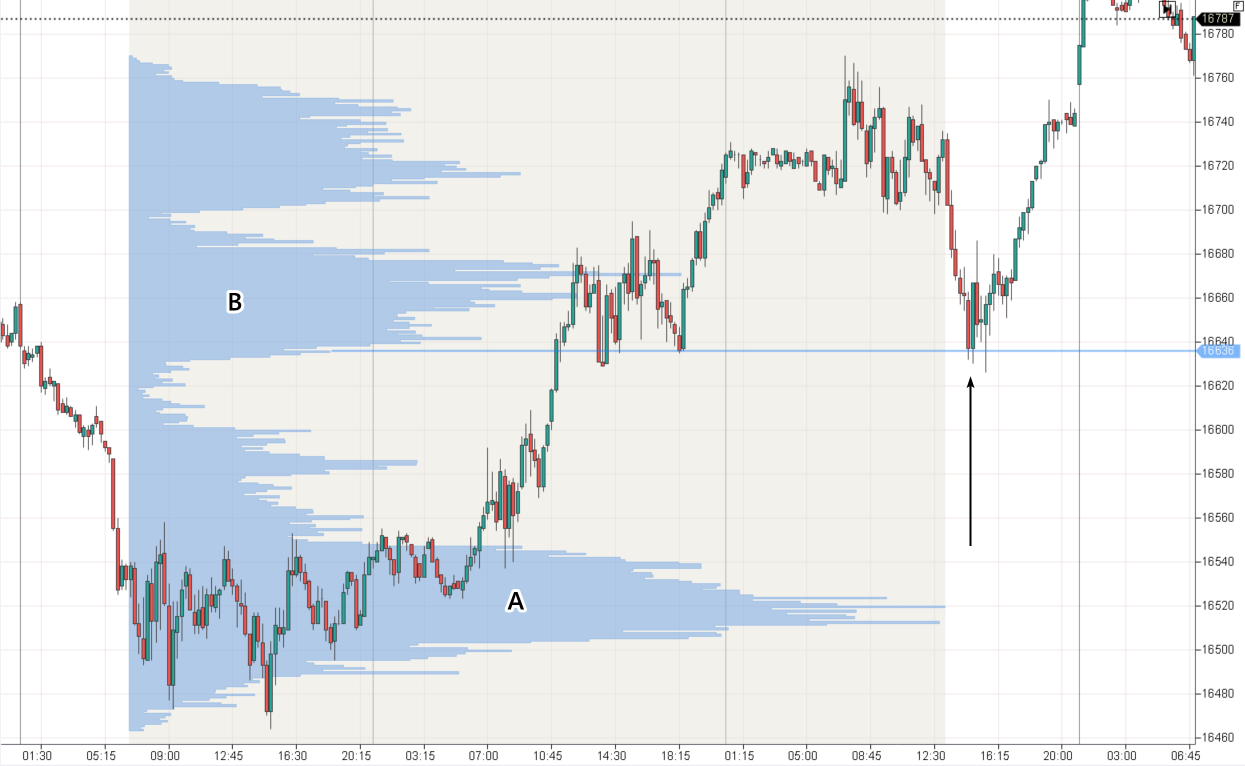
The price disrupted Balance A and moved upward, this is a bullish sign that could indicate the beginning (or resumption) of a significant uptrend.
- The formation of a new Balance B at a higher level confirms the prevailing bullish sentiment in the market. Buyers are in control.
- The lower step of the fresh Balance B at 16636 acts as the common ground, where the forces of supply and demand find equilibrium. Below, we can see that sellers are not willing to part with their contracts at a lower price. Testing such a step could provide a favorable opportunity to enter a trade, anticipating the continuation of the uptrend and the formation of higher (or lower) Balances C, D, and so on.
How to Trade the ‘Bounce from the Step’ Signal:
- Identify significant contrasting ‘steps’.
- Wait for the testing of the ‘step’ level, get confirmation on lower timeframes if possible.
- Enter a position, anticipating a rebound.
- Set a stop-loss beyond the step level. Maintain an acceptable risk-to-reward ratio.
Pros of the Signal:
- It is based on the idea that ‘steps’ represent points of contention among market participants and can indicate sharp shifts in overall sentiment. Testing this level often results in a reversal.
- One can plan trades for both a return to the balance zone (second example) and a move to the imbalance zone with a narrow profile (both rebounds in the first example).
Cons of the Signal:
- Identifying ‘steps’ on a specific chart is highly subjective.
- The price does not always test these ‘steps’. And when it does, it might not be with exact tick accuracy.
- A potential test of a ‘step’ can quickly turn unsuccessful (breaking through it).
3rd Signal Type: Bounce from the Imbalance Level
A bounce from the imbalance level is the mirror reflection of the first ‘Test of the POC Level’ signal. If the Point of Control represents levels of maximum volume, then the imbalance levels (let’s call them that) are constructed based on minimum volume. They form when the price changes very rapidly:
- Rapid Growth: there is a shortage of sellers in the market, and traders buy everything that is being sold. The price has no reason to linger.
- Rapid Decline: panic prevails in the market. Buyers have exited the market, leaving no support for the price.
Example 1. Bitcoin futures on the Binance exchange, 4-hour chart
The price rapidly rose (1st arrow) in anticipation of news regarding the approval of Bitcoin ETFs by the SEC (U.S. regulator). Simultaneously, a narrow area formed on the profile at the 40427.5 level.
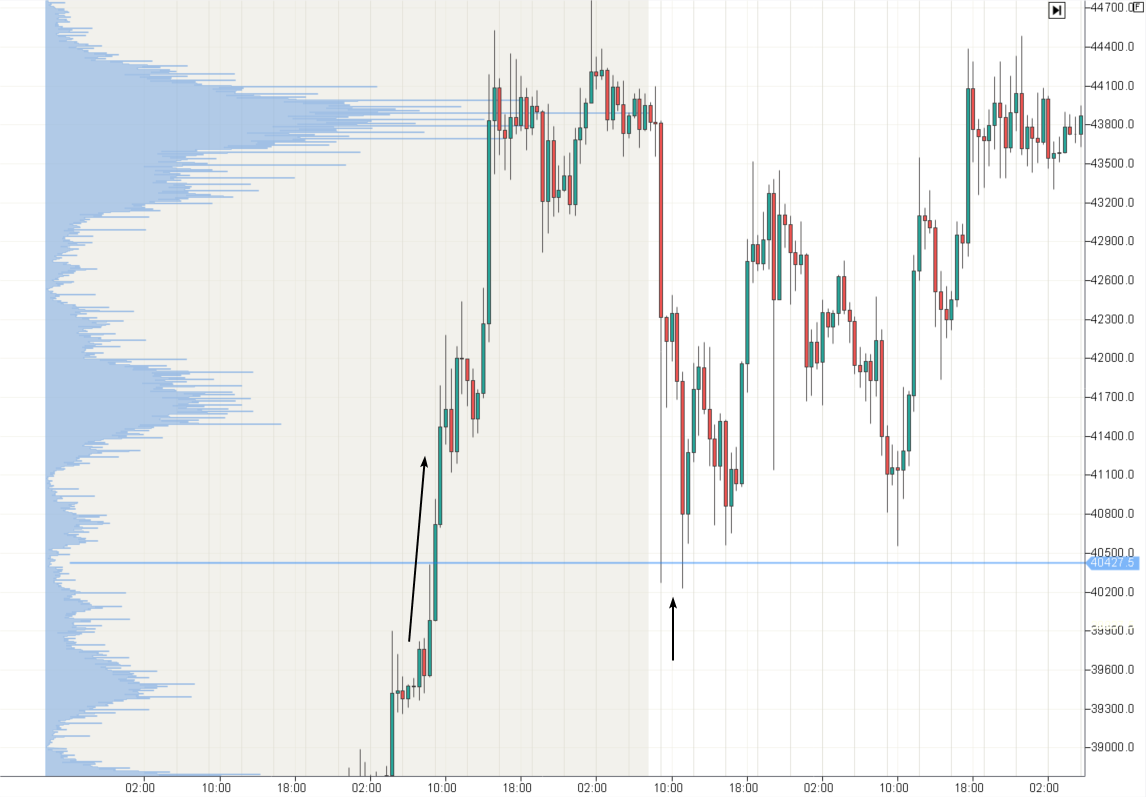
When the news sentiment changed from extremely optimistic to worrisome, a sharp decline occurred. The cryptocurrency price found support twice (2nd arrow), precisely at the imbalance level (narrow profile).
Due to the volatility of the Bitcoin market, it was almost impossible to enter a buy position on the bounce from the indicated level in a calm manner. However, the example demonstrates the effectiveness of the signal. You can see this for yourself by downloading ATAS and exploring the price behavior at the imbalance levels.
Example 2. Euro Futures, 5-Minute Chart
The chart below shows a bearish market with balances forming one after another, each lower than the previous one.
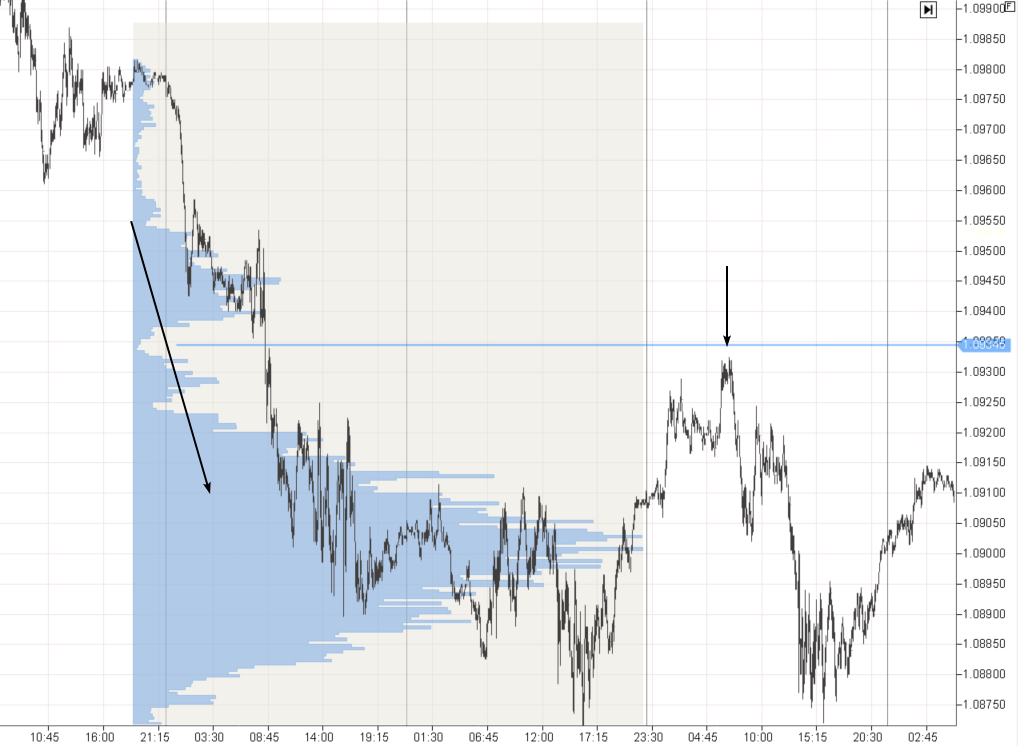
The price dropped rapidly at the 1.09345 level. At the beginning of the European session, we observed a bearish breakout of the balance that formed during the Asian session.
The next day, this level acted as resistance, offering traders an opportunity to initiate short positions.
How to Trade the ‘Bounce from the Imbalance Level’:
- Identify areas with a thin profile, showing a clear advantage of one side over the other.
- Wait for the imbalance level to be tested, get confirmation on lower timeframes if possible.
- Enter a position, anticipating a rebound.
- Set a stop-loss beyond the imbalance level. Maintain an acceptable risk-to-reward ratio.
Pros of the Signal:
- It is based on the idea that imbalance in opinions may persist. It will lead to a reversal after testing the narrow-profile level.
- It helps with trend trading which results in a narrow profile.
Cons of the Signal:
- Thin areas on the profile can be stretched and not obvious.
- The price does not always test imbalance levels. And when it does, it might not be with exact tick accuracy.
- Potential testing of the imbalance level may lead to the price swiftly moving in the opposite direction without clear signs of a rebound formation.
Pros and Cons of Bounce Trading Using the Market Profile
Using the market profile indicator in market analysis comes with numerous advantages, but, like any analytical tool, it also has its drawbacks.
What are the pros of the Market Profile?
Deep understanding of the market. The market profile provides a detailed picture of actual buyer and seller activity, consolidating information about recent trades in a convenient format. This approach is advantageous compared to trading based on moving averages, which can cross at any moment if you change the period.
Identification of support and resistance levels. The indicator helps identify strong support and resistance levels. This can be crucial for risk reduction and decision-making regarding entering or exiting a trade.
Versatility. The market profile proves effective for both trend and bounce trading across futures, stocks, or cryptocurrency markets.
What are the cons of the Market Profile?
Difficult to interpret. For beginners, the indicator may appear complex, requiring time for learning and understanding.
It needs an additional analysis. The market profile works best when combined with other tools and analysis methods, which may demand additional knowledge and skills from the trader.
Subjectivity. Similar to many volume analysis tools, interpreting the market profile readings often involves a subjective element, leading to situations where individuals say, ‘This is how I see it – I am an artist.’
The market profile can become a powerful tool in a trader’s arsenal, however, like any other instrument, it is crucial to use it in combination with other analysis methods and always consider risks.
The three mentioned profile characteristics — the level of extremely high volume, the level of contrasting volume change (‘step’), the level of extremely low volume — collectively form a grid of levels on the chart to which the price may or may not react. This variability can be disappointing, so pay more attention to the most significant changes in the profile and strive to improve your ability to track how the price interacts with such areas on the market profile.
Tips for Trading With the Market Profile Indicator
Seek confirmation to validate the accuracy of previously formed hypotheses. For instance, use cluster charts on lower timeframes.
Make your own observations. For instance, note that a retest of a level has less strength than the initial test.
Manage risks. Minimize the chances of hurting your capital by starting with a demo account or a trading simulator on historical charts.
The key recommendation is to have confidence in yourself, dedicate effort to learning market profile patterns, invest in your knowledge, and build resilience to stress.
FAQ about the Market Profile Indicator
What does the market profile show?
The market profile indicator displays the distribution of trading volumes at various price levels over a selected period. It helps traders identify key support and resistance levels and understand where potential market reversal points may occur.
On which markets can the market profile indicator be used?
The market profile indicator can be used to analyze various types of assets, including stocks, futures, and cryptocurrency pairs. However, it is essential to consider that its effectiveness may depend on the specific market structure and liquidity of the asset.
Which timeframe is best suited for using the profile?
The choice of a timeframe for using the volume profile depends on the trader’s strategy and goals. Short-term traders may use the volume profile on smaller timeframes (e.g., 15 minutes or 1 hour) to determine significant support and resistance levels, while long-term investors may look at longer periods (daily or weekly).
Special Features of the Volume Profile in the ATAS Platform
The ATAS platform is a premium-class software. Alongside other volume analysis tools, ATAS provides its users with the market profile indicator that has numerous features.
Here are a few features that distinguish the market profile in the ATAS platform:
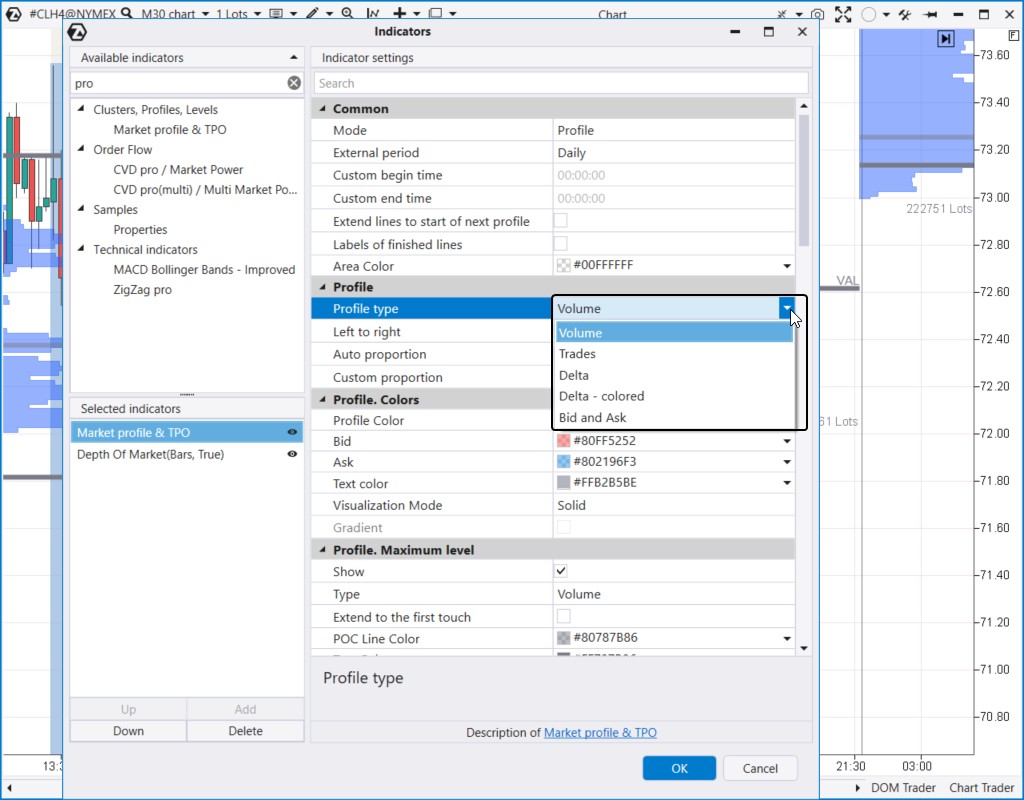
- Different profile types. You can combine the profile mode with the classic TPO (Time, Price, Opportunity) mode and customize various profile types based on: volume, trades, delta, bids and asks individually (shown in the dropdown menu on the chart).
- Automatic calculation of POC levels and Value Area boundaries that help identify the mentioned ‘steps’. Users can extend these levels to the first touch, display statistics, and other features.
- Flexible visualization settings. The market profile indicator is integrated into the interface, offering users easy customization according to their preferences. You can choose different colors, transparency values, and line thickness to obtain the most relevant information.
- Combining different profiles. You can add multiple profiles of different periods and settings to one chart and work with an arbitrary profile for the selected section on the chart.
- Compatibility with other volume analysis tools. The market profile indicator in the ATAS platform perfectly integrates with cluster charts and other technical tools and indicators (Cluster Search, Big Trades, Speed of Tape), enabling the creation of comprehensive trading strategies using various analysis methods.
- API access. You can access the market profile indicator when creating your own indicators and trading robots.
The integration of the market profile indicator in ATAS allows for analyzing the interaction of supply and demand forces at a deep level. This tool will help you make informed trading decisions and build effective trading strategies.
How to Start Applying the Market Profile in Analysis and Trading
Firstly, let’s consider what you can do on the platform without a broker:
Educational resources. Our blog, YouTube channel, and Knowledge Base provide detailed instructions on setting up and working with the Market Profile, along with other valuable trading information. Platform users can also rely on responsive ATAS customer support.
Market Replay is a market simulator that enables you to replay historical data and practice trading on the financial exchange as if trading was happening in real time. This way, you can gain the necessary experience in bounce trading based on profile signals without risking real capital.
Cluster charts or footprints. By accessing information inside candlesticks, you can make more informed decisions compared to traders who only see 1-minute candlesticks. Additionally, you can experiment with different timeframes.
Conclusions
The market profile indicator is a powerful tool that can significantly enhance your reversal trading strategies. The profile provides a deep understanding of market processes, allowing traders to see not only price changes but also trading volumes at different price levels. However, like any other tool, it requires understanding and proper application.
In the trading and analytical platform ATAS, several market profile indicators are integrated with a flexible interface, extensive educational materials, and expert support. We are confident that this will help you make progress in trading.
If you have not tried the market profile indicator yet, we strongly recommend getting acquainted with it. Download ATAS. It is free.
Once you install the platform, you will automatically get the free START plan, which includes cryptocurrency trading and basic features. You can use this plan for as long as you like before deciding to upgrade to a more advanced plan for additional ATAS tools. You can also activate the Free Trial at any time, giving you 14 days of full access to all the platform’s features. This trial allows you to explore the benefits of higher-tier plans and make a well-informed decision about purchasing.
Do not miss the next article on our blog. Subscribe to our YouTube channel, follow us on Facebook, Instagram, Telegram or X, where we publish the latest ATAS news. Share life hacks and seek advice from other traders in the Telegram group @ATAS_Discussions.
Information in this article cannot be perceived as a call for investing or buying/selling of any asset on the exchange. All situations, discussed in the article, are provided with the purpose of getting acquainted with the functionality and advantages of the ATAS platform.


