

The inverted cup and handle is a bearish chart pattern that signals a potential price drop once it is completed.
At first glance, this basic pattern may not seem particularly interesting to traders practicing regularly. However, analyzing it through cluster charts offers deeper insights into the reasons behind the bearish price movement. Specifically, it highlights weakening demand and continued dominance of supply, which creates opportunities to profit from the short side of the market.
Read more:
Inverted Cup and Handle Pattern Meaning in Trading
In simple terms, this pattern looks like two inverted “U” shapes, with the second being smaller than the first:
- The first part of the pattern is the inverted cup. It represents a period when the price rises initially, but then demand starts to wane, causing the price to gradually decline and form a rounded peak.
- The second part is the handle. This is a minor price rebound after the inverted cup forms. The price bounces off support but then starts to drop again, suggesting a potential break of support and the development of a downward trend.
Example: cup and handle inverted. In the chart below, three examples of this pattern are marked with black lines from the oil futures market. The pattern looks like an upside-down cup with a handle on the right side. The line connecting the lows of the pattern is often referred to as the “neckline” (similar to the “Head and Shoulders” pattern).
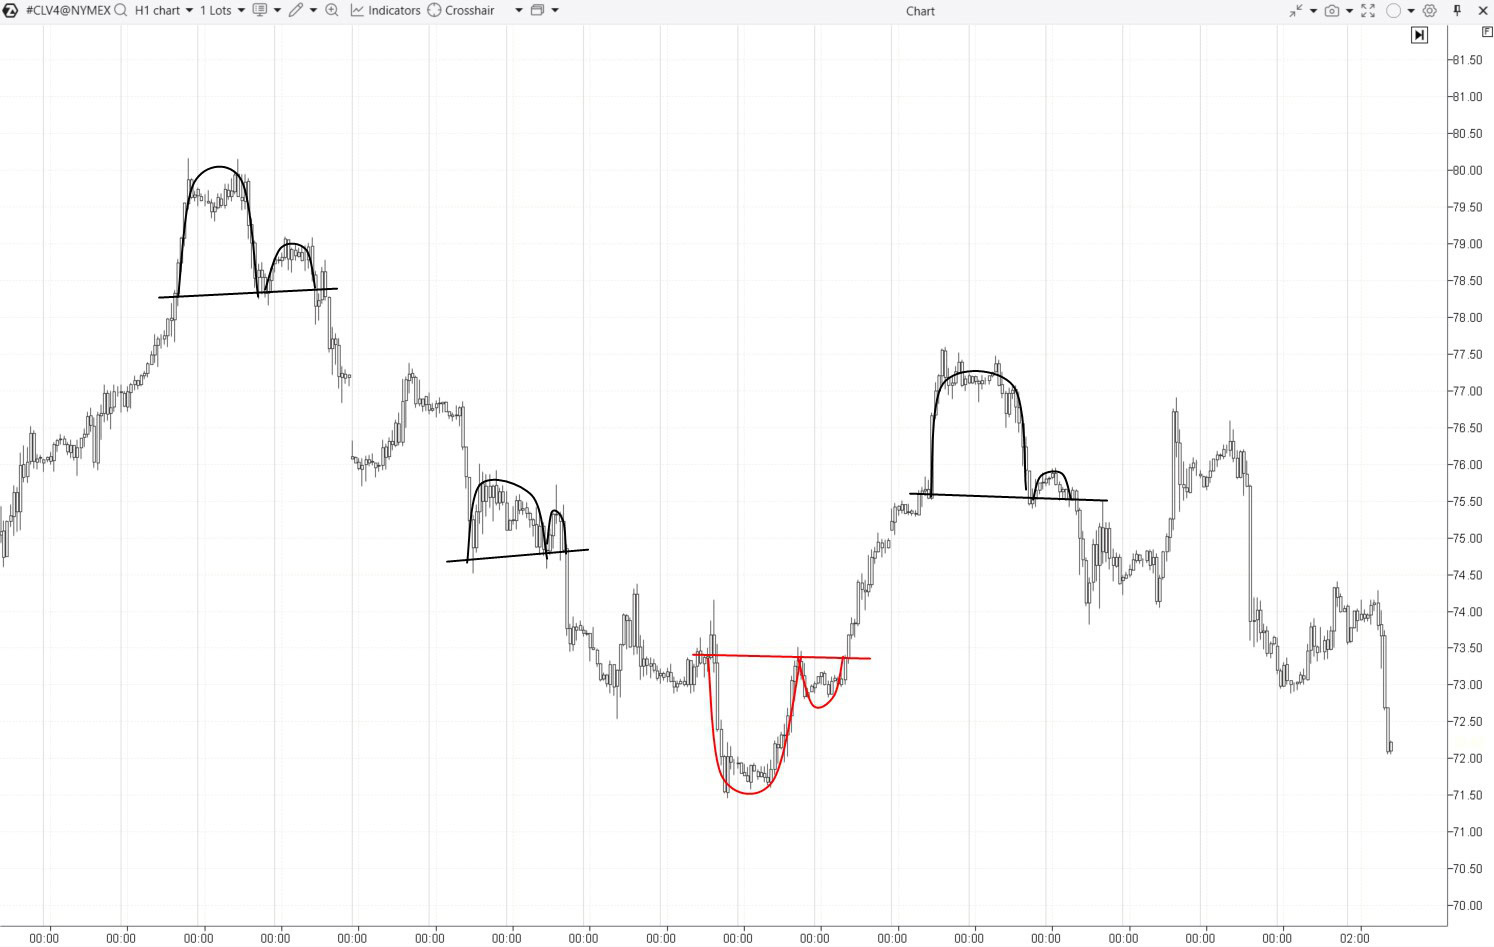
The classic cup and handle pattern is highlighted in red.
Both classic and inverted cup and handle patterns often raise doubts when it comes to identifying them, for several reasons:
- The pattern lacks strict rules regarding proportions and shape. The absence of precise parameters leads to uncertainty.
- In real trading, it is rare to encounter a perfectly formed pattern with clear, smooth curves. This creates a dilemma for traders: are they truly seeing an inverted handle and cup or just a similar price movement?
- The rounding may not be as smooth as desired.
- Drawing the “neckline” can be tricky, especially in volatile markets.
Although the pattern can appear in different forms, the underlying processes usually follow similar principles.
What Does the Inverted Cup and Handle Pattern Mean?
The inverted cup and handle chart pattern indicates that supply is taking control. Volume analysis tools help you see this trend in more detail with supporting evidence.
Let’s look at the first pattern mentioned above, but using footprint charts and the Market Profile & TPO drawing object. This example of the inverted cup and handle covers 3 days:
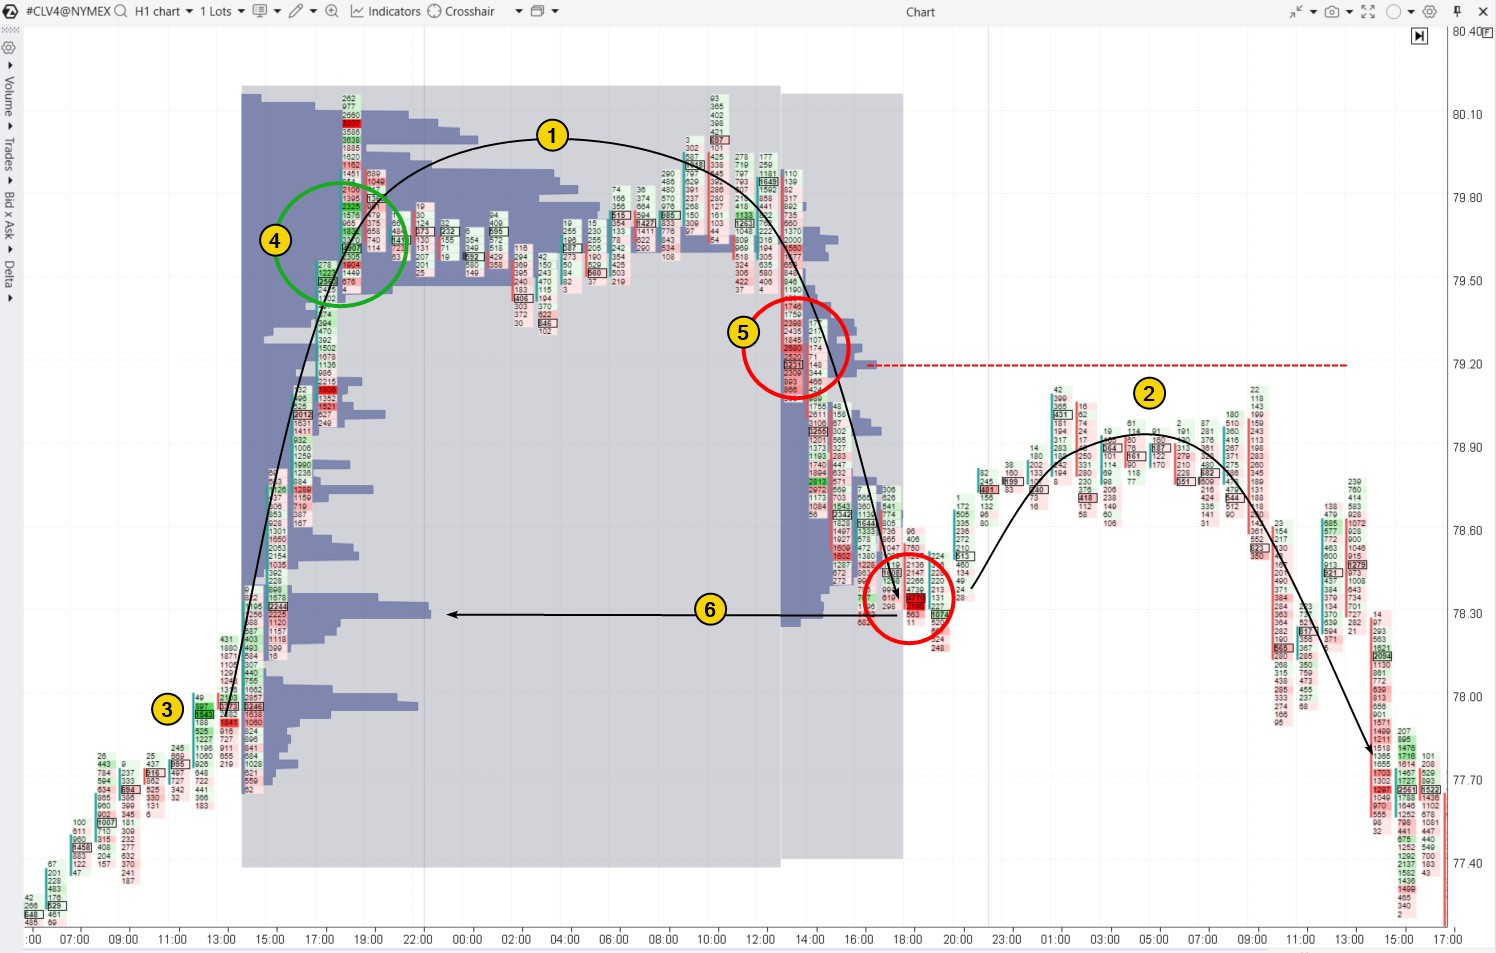
The trajectory forming the inverted cup over the first two days is marked as (1), and the “handle” formed on the third day is marked as (2).
Clusters reveal the unfolding story, starting at point (3), where large market buys are visible (indicated by the bright green cluster).
The price then moved upward, possibly driven by the news.
Number (4) indicates bright green clusters, signaling a buying climax. In simple terms, late buyers were trying to “jump on the bandwagon,” expecting further price increases, but instead, the price entered a range, fluctuating around the $79.60 level (as shown in the profile). Why did not the price rise after such significant buying activity, indicated by the green clusters? Professional traders probably used the late buyers’ market orders to lock in profits on their long positions or to open new short positions.
The next day, market sentiment shifted. The price increase up until 10:00 drew buyers into a bull trap, while the bright red clusters (5) near the $79.20 marked strong selling activity. This led to real progress — a breakout of the previous local low and a further drop in price. This decline reached its climax at the end of the day (as shown by the bright red cluster on the 18:00 candle) near the high-volume level from the previous day (6).
On the third day (during the European session), there was a minor upward correction after the strong downward impulse seen in the middle of the chart. From a buyer and seller analysis perspective, demand weakened as the price rose to the level (marked with red dashes) where a clear seller dominance was observed. This formed the “handle” peak, after which the downward trend resumed during the U.S. session.
Inverted Cup and Handle Pattern: Trading Strategies
According to classic trading rules, traders follow these steps when trading the inverted cup handle pattern:
- Identify the rounding of the inverted cup.
- Spot the smaller rounding that forms the handle.
- Wait for a bearish breakout of the “neckline” connecting the lows of the pattern.
- Open a short position.
Where to place a stop-loss?
In traditional technical analysis, the stop-loss is typically placed just above the top of the “handle” or at the peak of the “cup,” depending on the trader’s risk tolerance. However, traders who use cluster charts can further reduce risk by placing stop-loss orders at:
- high-volume levels (around the Point of Control);
- thin profile levels, where sellers had the upper hand over buyers.
Where to place a take-profit?
In traditional technical analysis, the profit target for the “cup and handle” pattern is typically calculated like this:
- Measure the “height of the cup” (the distance from the lowest point of the pattern to its top edge).
- Then, project that distance downward from the point where the handle’s lower boundary is broken. This gives you the expected profit target.
However, analyzing the broader market context can provide valuable insights for placing a take-profit order. We will demonstrate how this works in practice below and also cover different strategies for trading the inverted cup and handle stock pattern.
Example of the Cup and Handle Pattern Inverted
Below is an example of the inverted cup handle observed in the NQ futures market:
- on the left, you can see the complete pattern. Two profiles are added to the chart for more detailed information: the first profile tracks the upward movement as the price approaches the peak of the pattern, while the second profile shows the subsequent downward movement.
- on the right, you can see the details of the handle’s top formation.
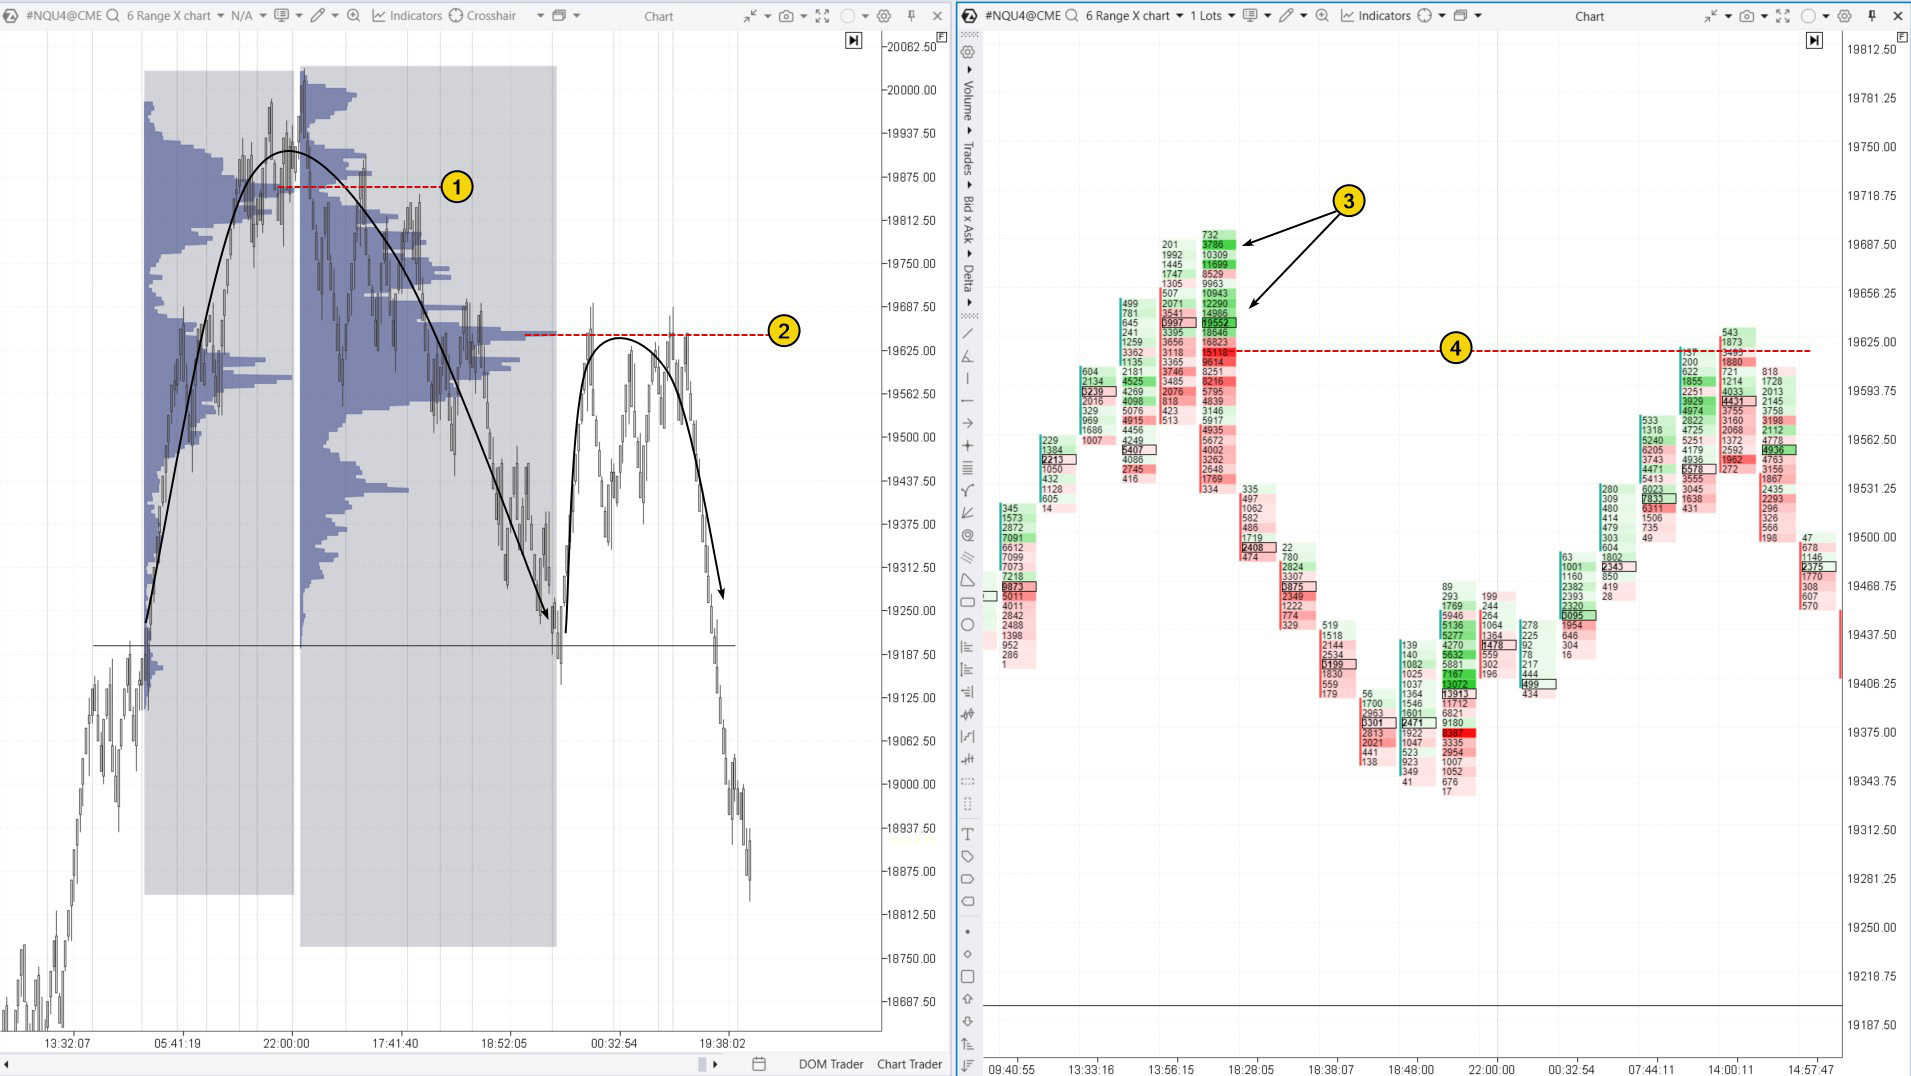
The upward momentum that initiated the formation of the “cup” started to lose strength when the price reached the 19,875 level. This is evident from the bulge in the volume profile, indicating that market participants had reached a temporary consensus on the fair value of the contract. Interestingly, as the price moved along the downward arc, this level (1) acted as resistance.
The largest bulge on the downward arc is at the 19,630 level (marked as 2). This level acted as resistance when the cup’s peak was forming, as shown on the footprint chart (3):
✔ Buyers were caught in a bull trap at the market peak (green clusters also show triggered stop-losses of the sellers);
✔ Sellers then “closed” the trap.
This shift in sentiment subsequently acted as a resistance level (4).
Conclusion: The market profile indicator and cluster analysis offer a more precise view of market dynamics, providing an edge over those trading by simple rules. For instance, a trader using cluster charts could have entered a short position around level (4) and profited, while another trader might have waited for the completion of the inverted cup and handle pattern.
Failed Cup and Handle Pattern
No pattern works with 100% accuracy.
The chart below shows an inverted cup (1) and handle (2). Following classic trading rules for this pattern would likely have led to a loss, as there was an impulsive price surge shortly after the neckline breakout.
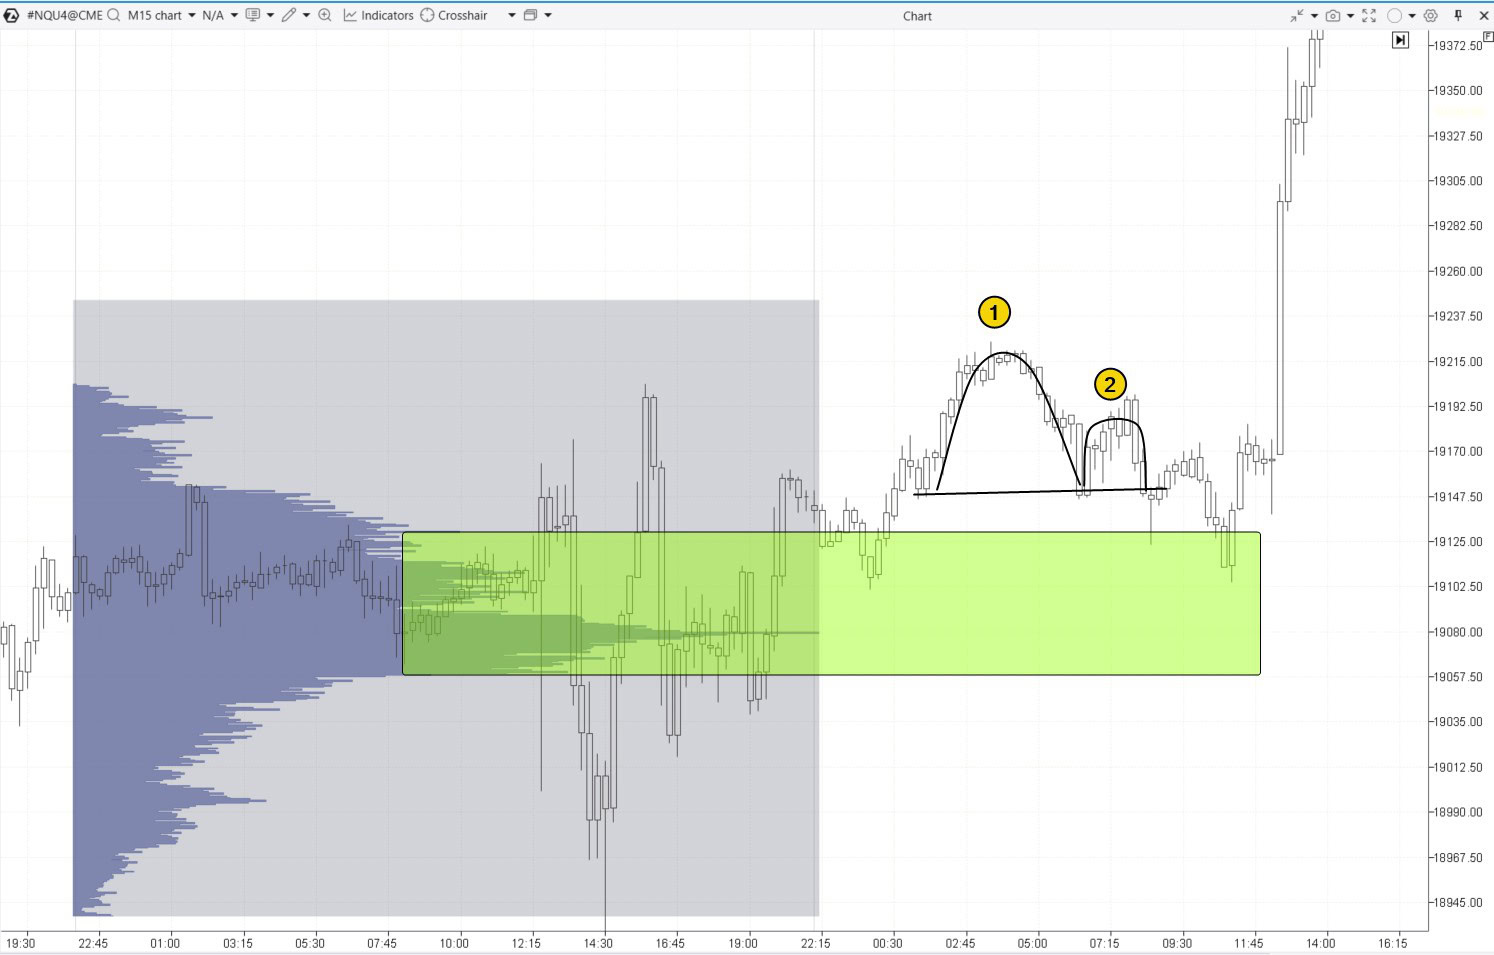
Classic interpretation suggests that the pattern indicated a lack of buyers at the market peak, leading to a rounding off and a subsequent price drop.
However, a trader using volume analysis tools would have likely noticed a significant bulge below the inverted cup pattern. Instead of going short, they might have seen this bulge as a support level and considered entering a long position.
Conclusion: Volume analysis tools can help avoid low-potential trades and focus on high-probability opportunities.
Tip: Use the economic calendar in the ATAS platform to keep track of upcoming news events.
Cup and Handle Pattern in a Downtrend
The inverted cup and handle pattern is a bearish pattern, so trading it during a downtrend makes logical sense. The example below (using British pound futures) demonstrates this:
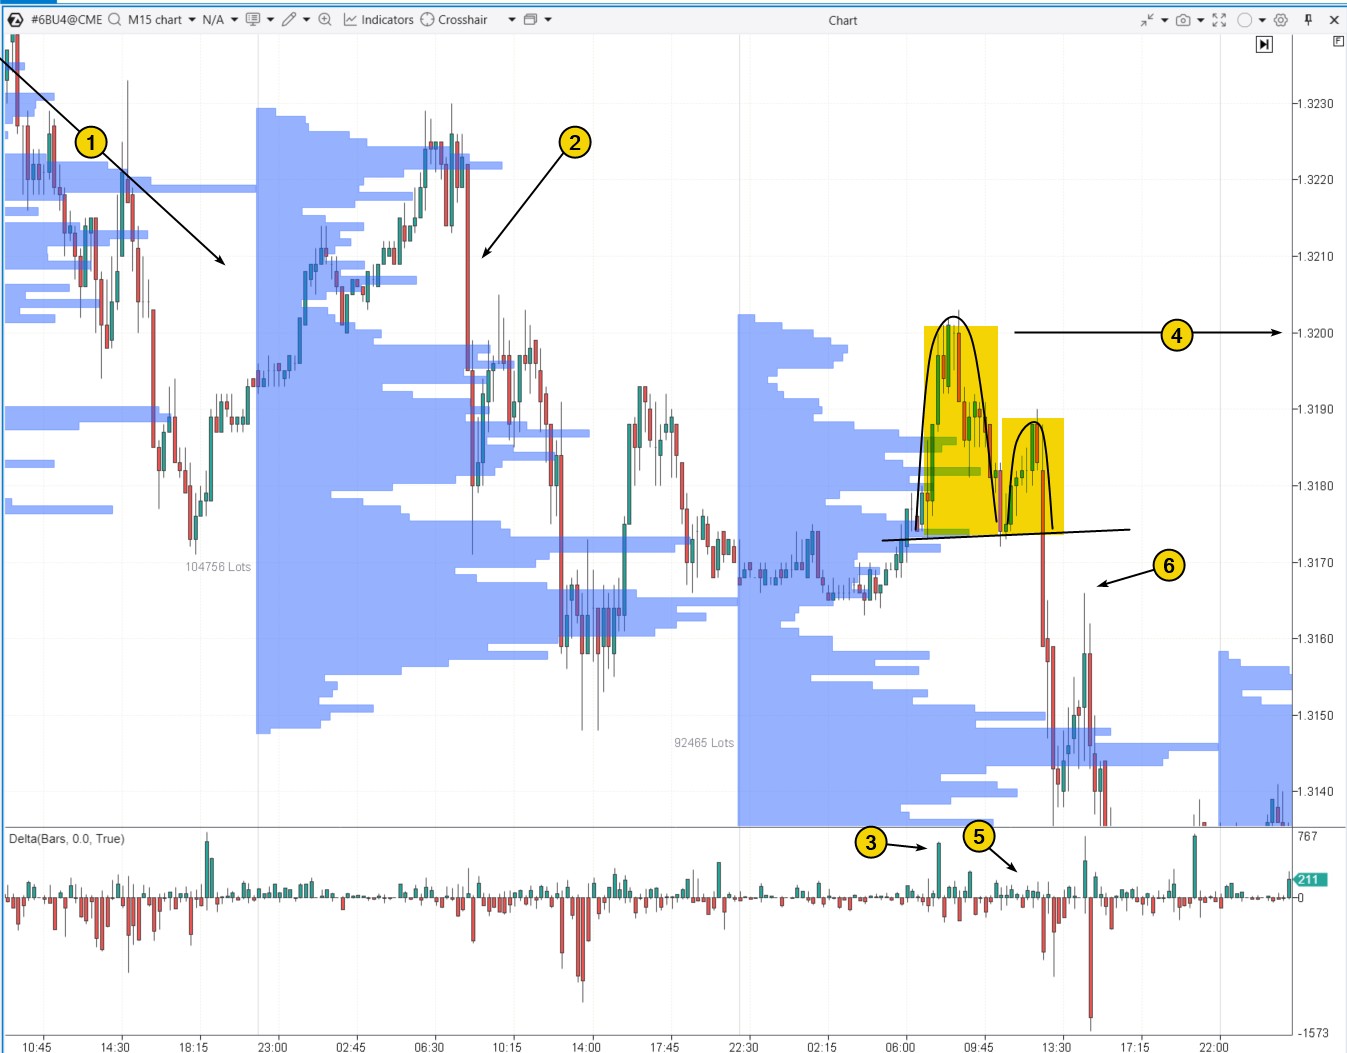
Number (1) shows the developing downtrend.
Number (2) indicates that bears regained control of the market sharply when bulls attempted to turn things around. The result of this large bearish candle was a thinner profile, reflecting a dominance of sellers.
The following day, the price rose to the area of the large red candle and formed the inverted cup and handle pattern (marked in yellow).
Astute traders might have observed that:
- despite a sharp increase in positive delta (3), the price did not show subsequent upward momentum, which was a bearish signal;
- resistance from the large bearish candle of the previous day was reinforced by the 1.3200 round psychological level;
- the absence of positive delta during the formation of the “handle” confirmed the weakness of demand.
The neckline breakout happened so quickly that buyers lacked the strength (6) to push the price higher and test the breakout level.
Conclusion: Tracking volume indicators provides crucial insights into changes in supply and demand balance, which drive price movements. The specific shape of the patterns on the chart is less important compared to understanding these dynamics.
FAQ
What happens after the inverted cup and handle pattern?
After the inverted cup and handle pattern completes, it typically signals the continuation of a downtrend, as the weaker price rebound indicates fading demand. Once the neckline is broken, traders often expect the price to decline, sometimes by an amount equal to the height of the inverted cup.
Is a cup and handle bullish or bearish?
While the traditional cup and handle is a bullish pattern, its inverted counterpart is a bearish signal.
Can a cup and handle be a reversal?
Yes, but it largely depends on the context.
The bullish cup and handle pattern is usually seen as a continuation signal in an uptrend, suggesting a brief consolidation before breaking through resistance. However, in some instances, this pattern can also form in a downtrend, indicating a potential reversal to the upside.
The bearish inverted cup and handle pattern, which forms at the market’s peak, is often interpreted as a sign of a downward trend reversal. It is no surprise that the cup and handle closely resemble the well-known head and shoulders reversal pattern.
What Patterns Does the Inverted Cup and Handle Resemble?
This pattern is similar to the following patterns:
- Dead Cat Bounce. Both patterns show a brief price recovery after forming a rounded top, followed by a significant drop. In the case of the inverted cup and handle, this recovery appears as the “handle.”
- Head and Shoulders (without the Left Shoulder). Both have a central peak (the top of the cup in the inverted pattern) followed by a decline. The key difference is that the inverted cup has a rounded shape without distinct shoulders.
- Double Top. Like the inverted cup and handle, the double top is a bearish pattern signaling a potential reversal. The inverted cup and handle can resemble a double top if you consider the “handle” as the rounded and lower second peak.
How to Learn Trading Chart Patterns Profitably
Using footprint charts and other advanced tools for professional analysis of buying and selling dynamics can offer a significant advantage over traders who rely solely on traditional trading rules.
If you want to master trading chart patterns using modern volume analysis tools, the ATAS Market Replay simulator is a great option. It enables you to recreate real market conditions and practice strategies in real time. You can safely explore trading patterns like the “Cup and Handle,” “Inside Bar,” “Piercing Line,” “Shooting Star,” and more, all while using footprint charts and volume analysis indicators.
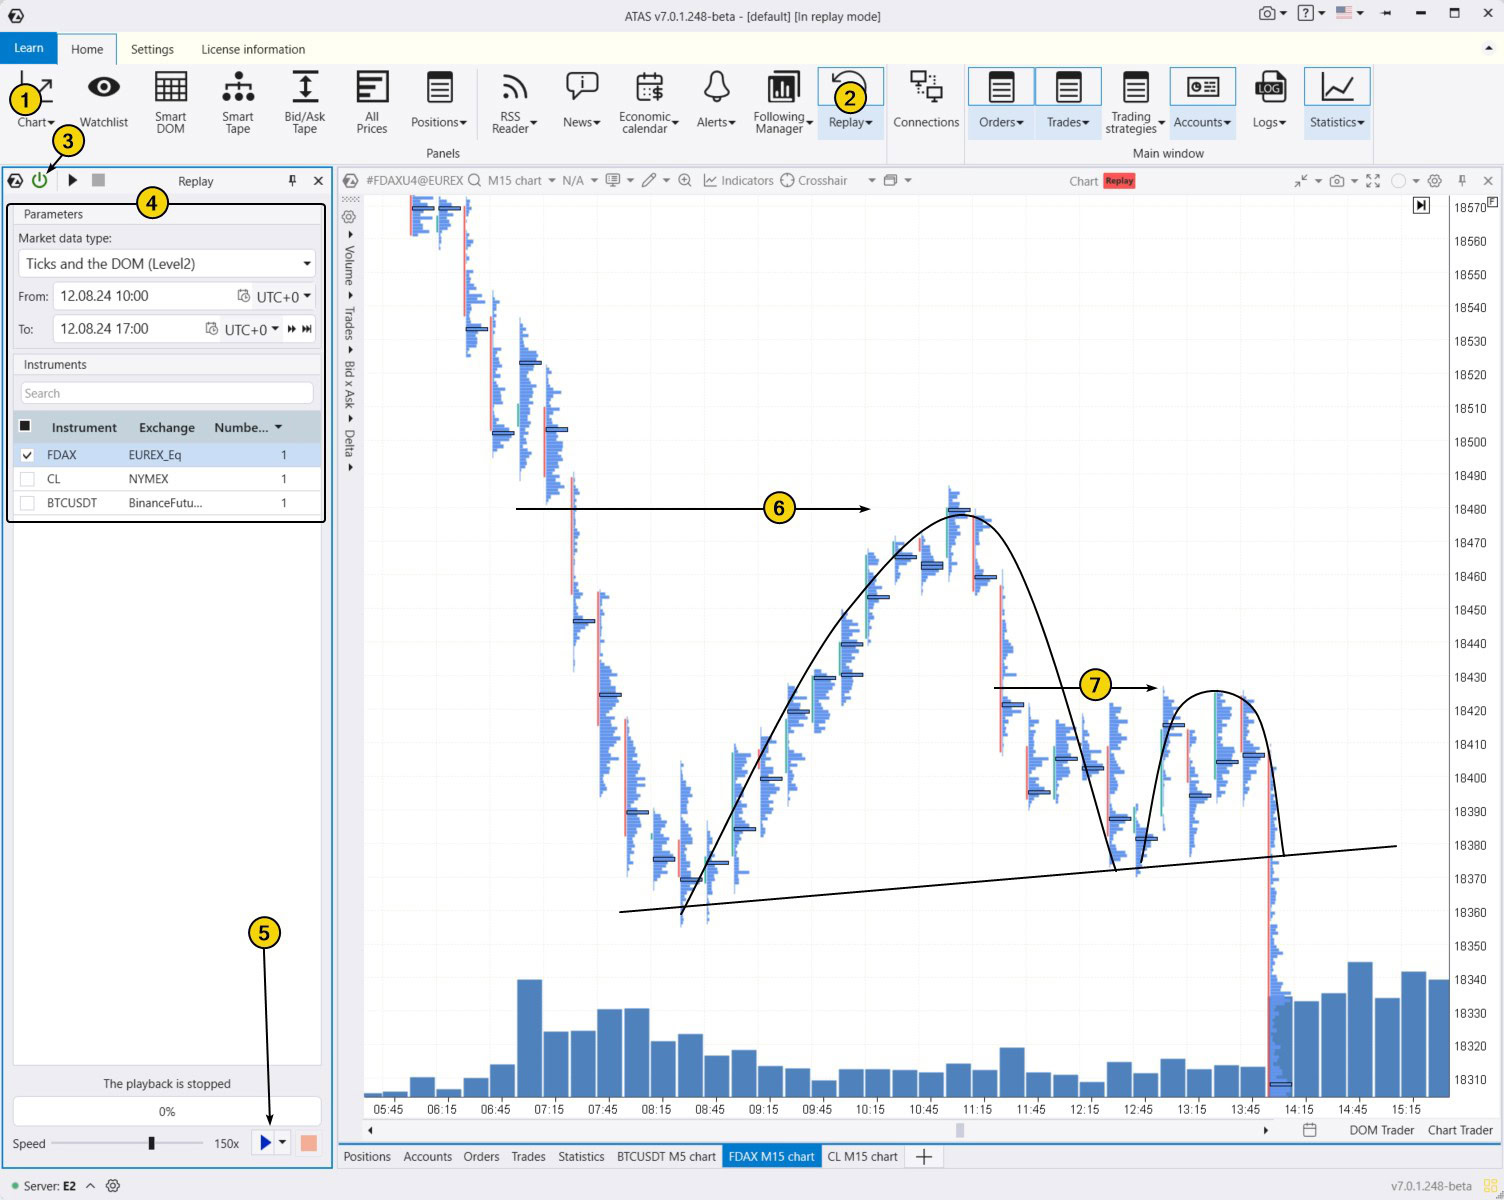
To try the simulator, download the ATAS platform for free, install, and launch it, and then:
- Open a price chart.
- Click on the Market Replay button in the main ATAS menu.
- Activate the Replay mode (the icon should turn green).
- Adjust settings like date and data type if needed.
- Start the playback and enhance your trading skills.
The chart below shows an example of the inverted cup and handle pattern in a downtrend. The top of the “cup” formed at levels (6), where sellers previously had a significant advantage, as indicated by the thin profile. A similar downward reversal from the thin profile (7) occurred during the formation of the “handle” top.
When practicing trading patterns in the Market Replay simulator, you can:
- adjust the playback speed and pause;
- test strategies and track signals from over 400 indicators;
- use Chart Trader and other features to trade on the built-in demo account Replay, and then analyze your performance;
- use drawing objects, for example, mark support and resistance levels;
- use various chart types, such as a non-standard Range XV;
- use exit strategies;
- analyze volumes in the Level II order book, for example, using the DOM Levels indicator, and much more.
ATAS enables you to load tick data from a wide range of markets, not just cryptocurrencies, providing a comprehensive basis for analyzing price and volume interactions and identifying patterns.
Conclusion
Trading patterns like the inverted cup and handle is a subjective approach since these formations are rarely perfect. Their interpretation often depends on the trader’s experience and how much time they have spent observing similar setups.
Pros of trading this pattern:
✔ Decision-making becomes more structured and consistent when using chart patterns.
✔ The inverted cup and handle pattern is based on the signs of demand exhaustion, suggesting that seller dominance will push prices lower.
Cons:
✘ Subjectivity.
✘ Risk of false signals.
✘ Lack of clear rules for stop-loss and take-profit levels.
✘ An outdated method for trading with basic charts.
To increase your chances of success, it is crucial to use modern tools like cluster charts and advanced volume analysis indicators. These can provide clearer, more timely insights into shifts in supply and demand, enabling you to make more informed trading decisions and reduce the risk to your capital.
Download ATAS. It is free. Once you install the ATAS professional volume analysis platform, the free START plan is automatically activated. Cryptocurrency trading and basic features will be available to you. You can use this plan for as long as you like before deciding to upgrade to a more advanced plan for additional ATAS tools. You can also activate the Free Trial at any time, giving you 14 days of full access to all the platform’s features. This trial allows you to explore the benefits of higher-tier plans and make a well-informed purchasing decision.
Do not miss the next article on our blog. Subscribe to our YouTube channel, follow us on Facebook, Instagram, Telegram or X, where we publish the latest ATAS news. Share life hacks and seek advice from other traders in the Telegram group @ATAS_Discussions.
Information in this article cannot be perceived as a call for investing or buying/selling of any asset on the exchange. All situations, discussed in the article, are provided with the purpose of getting acquainted with the functionality and advantages of the ATAS platform.


